HAL Id: hal-00464234
https://hal.archives-ouvertes.fr/hal-00464234
Preprint submitted on 16 Mar 2010
HAL is a multi-disciplinary open access
archive for the deposit and dissemination of
sci-entific research documents, whether they are
pub-lished or not. The documents may come from
teaching and research institutions in France or
abroad, or from public or private research centers.
L’archive ouverte pluridisciplinaire HAL, est
destinée au dépôt et à la diffusion de documents
scientifiques de niveau recherche, publiés ou non,
émanant des établissements d’enseignement et de
recherche français ou étrangers, des laboratoires
publics ou privés.
Experimental observation of speckle instability in Kerr
random media
Umberto Bertolozzo, Stefania Residori, Patrick Sebbah
To cite this version:
Umberto Bertolozzo, Stefania Residori, Patrick Sebbah. Experimental observation of speckle
instabil-ity in Kerr random media. 2010. �hal-00464234�
U. Bortolozzo,1 S. Residori,1 and P. Sebbah2,∗
1
INLN, Universit´e de Nice Sophia-Antipolis, CNRS, 1361 route des Lucioles 06560 Valbonne, France
2LPMC, Universit´e de Nice Sophia-Antipolis, CNRS, Parc Valrose 06108 Nice Cedex 2, France
(Dated: March 25, 2010)
In a disordered medium with Kerr-type nonlinearity, the transmitted speckle pattern was predicted to become unstable, as a result of the positive feedback between the intensity fluctuations and the nonlinear dependence of the local refractive index. We present the first experimental evidence of speckle instability of light transversally scattered in a liquid crystal cell. A two-dimensional controlled disorder is imprinted in the medium through a suitable illumination of a photoconductive wall of the cell, whereas the nonlinear response is obtained through optical reorientation of the liquid crystal molecules. Speckle patterns with oscillating intensity are observed above a critical threshold, which is found to depend on the scattering mean free path, as predicted by theory.
PACS numbers: 42.25.Dd, 42.55.Zz
In a disordered medium, the transmitted intensity measured at a point results from the interference of light incoming from all possible scattering trajectories inside the medium. These constructive and destructive interferences give rise to inten-sity fluctuations [1]. The resulting speckle pattern observed in transmission is a fingerprint of the medium traversed by the wave and is highly sensitive for instance to any displace-ment of scatterers within the medium. This property has been widely used in applications such as speckle imaging [2] or dif-fuse wave spectroscopy [3, 4]. Short and long range speckle correlations, which can also results from frequency or polar-ization shift of the incident beam, have raised considerable interest in the last two decades [5]. But changes in speckle pattern can also be achieved by intensity variation of the in-put beam when considering a nonlinear scattering medium with a Kerr-type nonlinearity. Local intensity fluctuations induce local refractive-index changes, which in turn modify the optical trajectories, resulting in a redistribution of the in-tensity fluctuations within the sample and in a new transmit-ted speckle pattern. Under certain conditions, this feedback mechanism was predicted to become unstable leading to the spontaneous oscillations of the speckle pattern [6, 7]. It was pointed out in [7] that speckle instabilities differ from com-mon nonlinear instable regimes observed in nonlinear optics, since here the feedback is provided by the scattering. Accord-ing to Skipetrov and Maynard [7, 8], the instability threshold
p = hn2Ii 2
(L/ℓ)3
> 1 is reached for any value of the
nonlin-ear correction to the refractive indexn2I, as long as the mean
free pathℓ is small enough. To date, experimental observation
of speckle instability has never been reported.
In this letter, we report the first experimental evidence of speckle instability. A liquid crystal (LC) cell serves simulta-neously as the scattering and Kerr nonlinear medium. A two dimensional (2D) computer-generated image of random scat-terers is projected on a photoconductive wall of the cell, gen-erating a controlled 2D random distribution of the refractive index within the LC layer. A probe laser beam is transversally scattered while inducing a nonlinear (NL) Kerr-reorientation of the LC molecules. Speckle pattern spontaneous oscillations are observed. Instability threshold is identified and found to
be dependent on scattering mean free path, as predicted by theory. A frequency cascade is observed at higher probe inten-sity. Just above threshold, the oscillation frequency is found to be of the same order of the inverse of the NL relaxation time, which is interpreted in terms of NL energy transfer and natural gain selection. Light scattering in random and nonlin-ear media has attracted considerable attention recently with, for instance, the exploration of the impact of a nonlinearity on Anderson Localization [9, 10] or the role of disorder on solitons [11]. Our experimental study is among the very first [12] to explore the dynamic interplay between nonlinearity and multiple scattering.
V0 PH LC IW IP IS G 50 m
FIG. 1. (color online). Experimental configuration. The disorder configuration is imprinted within the LC (bottom-left inset) by illu-minating (IW) the photoconductive wall (P H) of the LC light-valve
with a random distribution of scatterers (top-right inset), whereas the nonlinearity is provided by the molecular reorientation of the liquid crystal under the action of the probe probe (IP). (G=glass cover).
The experimental setup is schematically represented in Fig.1. The 20mm×30mm liquid crystal light-valve (LCLV) is
composed of aL = 55µm-thick LC film in the nematic phase
and a 1 mm-thickBi12SiO20 (BSO) photoconductive
sub-strate, sandwiched between two transparent indium-tin-oxide electrodes [13]. A random pattern (here a random collection of dark disks in a white background, as shown in top-right
2 inset of Fig. 1) is computer-generated and transmitted to a
36.9mm×27.6mm spatial-light-modulator (SLM), spatial
res-olution 1024×768 pixels, which serves as a 2D random mask.
The local voltage applied across the LC film decreases where light impinges on the BSO crystal, inducing local LC reori-entation. A given light intensity distribution is therefore con-verted into a corresponding distribution of molecular orien-tation. As a result of LC birefringence, a 2D refractive index distribution invariant along the longitudinal direction,n(x, y),
is formed within the LC film, which reproduces the initial ran-dom pattern. Because the BSO crystal is preferentially sen-sitive to the blue-green region of the spectrum, a CW diode-pumped solid state laser at532 nm is used as the writing beam
with an intensity of a few mW/cm2
(2mW/cm2
). The refrac-tive index distribution is monitored by a 8-bit CCD-camera and is shown in bottom-left inset of Fig.1. The geometri-cal characteristics of the LC scattering medium are fully con-trolled by adjusting the filling fraction,φ, the diameter D and
positions of the cylindrical scatterers. By shrinking the image on the computer screen, the actual scatterer diameter can be varied fromD = 100µm to 1 µm, leaving φ constant. The
re-fractive index of the scatterers,ns, varies betweenno= 1.52
andne= 1.75, according to the 8-bit coded gray level of the
SLM mask, whereno andneare, respectively, the ordinary
and the extraordinary index of the LC. In the following, we chooseφ =40%, D = 50 or 20 µm and ns= ne= 1.75 while
for the LC matrixn = no.
A linearly polarized HeNe laser (632.8nm wavelength, 5mW power, beam-waistw0=380µm, intensity 1.1 W/cm
2
) serves as the probe beam. Its polarization is parallel to the LC nematic director. The probe beam is transversally scat-tered as it propagates along the LC layer and is back-reflected at the LC/BSO interface with a total reflectivity of 22%. The back-reflected near-field speckle pattern is imaged onto a sec-ond CCD camera and is shown in Fig. 2. We checked that polarization is conserved. This confirms that propagation re-mains in the paraxial approximation limit and allows to esti-mate the mean free path in the transverse direction. Indeed in this limit, the wave equation reduces to a Schr¨odinger equa-tion where time is replaced by longitudinal coordinate,z, to
describe a particle moving in a 2D potential −V (x, y) = −k2 [n2 (x, y) − n2 0]: 2ikn0 ∂A ∂z = (∇ 2 xy+ V (x, y))φ (1)
where A(x, y, z) exp(−ikn0z) is the wave field and n0
is the effective refractive index defined by n0 = S−1R
Sn
2
(x, y)dxdy [14]. When considering transverse
scat-tering, the relevant wavewavector is no longerk = ω/c but
rather the transverse wave-vectork⊥ = ω/v = 2/w0, with v/c = k/k⊥≈ 2 in our case. Because this ratio can be larger
than 1, the productk⊥ℓ ≪ kℓ, making transverse Anderson
localization of light possible in finite-sized random systems even for small index contrast [9, 10, 14]. In our system, a crude estimate of the mean free path from Mie theory (infi-nite cylinders with indexnein a matrixno) and single
scat-tering approximation yieldsℓ ≈ 100µm (resp. ℓ ≈ 40µm)
at 632.8nm forD = 50µm (resp. D = 20µm). The
lo-calization length in 2D is given by ξ ≈ ℓ exp(πk⊥ℓ/2),
which yieldsξ = 228, 6µm (resp. ξ = 55.7µm). As it
propagates freely along the longitudinal direction, the beam will extend transversally, experiencing successively a ballistic regime (t < τ0 = ℓ/v), a subdiffusive multiple-scattering
regime (τ0 < t < Tloc) [15] and a crossover to
localiza-tion (t > Tloc). To identify the regime reached within the
round-trip ballistic time tb = 2L/c spent in the LC cell,
we estimatetb/τ0 = (d/ℓ)(k/k⊥)) ≈ 2.2 (resp. 5.5), and tb/Tloc = 2(tb/τ0)exp(−πk⊥ℓ) ≈ 0.8% (resp. 5.7).
Al-though based on a rough estimate of the mean frfee path, these calculations demonstrate that the multiple scattering regime is well established, even though light may not be yet fully trans-versely localized. 0 0.5 1 1.5 2 2.5 Amplitude Spectrum
a
0 5 10 30 40 50 Time (s) I(t) (bits) 0 5 10 0 0.5 1 1.5 Frequency (Hz) Amplitude Spectrumb
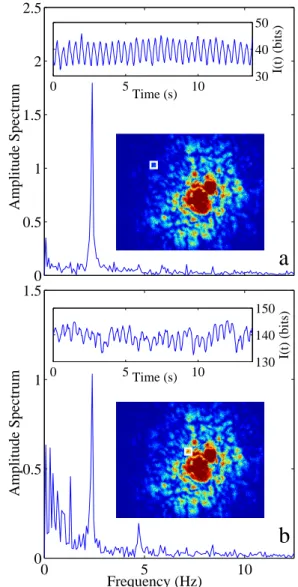
0 5 10 130 140 150 Time (s) I(t) (bits)FIG. 2. (color online). Temporal modulation of speckle intensity and corresponding power spectrum within an area encompassing a single speckle spot (delineated by the white square shown in the speckle pattern CCD image). Time-averaged intensity in this area is (a) I=40 bits and (b) I=140 bits.
100 101 0 0.05 0.1 0.15 0.2 0.25 0.3 0.35 Intensity Oscillation Amplitude 0.65Hz 1.30Hz 2.39Hz 4.71Hz
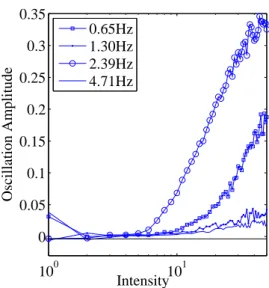
FIG. 3. (color online). Amplitude of oscillations vs average intensity at the different frequencies seen in Fig 2b, obtained by averaging spectra measured at positions of the speckle pattern with same time-averaged intensity.
During its round-trip propagation in the cell, the extraordinary-polarized probe beam experiences nonlinear scattering as its electric field changes molecule orientation. Surprisingly, the speckle pattern is not static but we observe with a naked-eye a temporal modulation of each speckle spot (as shown in the movie [16]). These oscillations are not ob-served for ordinary-polarized light and therefore cannot be attributed to thermal fluctuations. They are found to aver-age out when spatial integration is performed, which shows that no phase relation exists from spot to spot. It is impor-tant to point out that our observations are fundamentally dif-ferent from standard self-phase modulation (SPM) described in the literature for non-disordered media [17]. The uncorre-lated oscillations for different speckle spots confirm the non-deterministic nature of the speckle instability, in contrast for instance with the phase-coherent rings observed in SPM.
We analyze the oscillating speckle behavior by monitoring over time the modulated intensity, spatially averaged over a small area including a single speckle spot. The temporal oscil-lations and the corresponding amplitude spectrum are shown in Fig. 2 for two speckle spots with different time averaged intensity. Low intensity speckle spot shows a single peak at
f0=2.39 Hz (Fig. 2a). This has to be compared to the free
relaxation time of the reorientational nonlinearity of the LC,
τN L = γL2/π2K, where γ is the LC rotational viscosity
andK the elastic constant. For typical values of γ = 0.02
Pa.s andK = 15 pN [18, 19], we find with good agreement f0≈ 1/τN L. The same time constant, approximately400 ms,
has been independently found by measuring directly the re-sponse time of the optical reorientational effect. The speckle instability is therefore solely driven by the slow response time of the reorientational Kerr nonlinearity. This is another reason why it cannot be related to thermal instabilities since thermal fluctuations are expected to be faster than molecular
orienta-tion of the LC (of the order of 100µs [19]). Besides, given
that the intensity used is relatively small and given the small absorption coefficient of pure LC [19], we can safely neglect thermal heating due to laser illumination.
Higher intensity speckle spots show several spectral peaks atf0/2, f0/4 and also at 2f0(Fig. 2b). Increasing the probe
beam intensity results in the same spectral cascade. Remark-ably, the intensity distribution of the speckle pattern offers a direct exploration of the intensity dependence of the insta-bility at fixed input beam intensity. This is further analyzed by averaging spectra measured at positions with same time-averaged intensity. Four peaks with different threshold are identified and their amplitudes relative to the spectral back-ground are plotted versus speckle spot intensity in Fig. 3. Different slopes associated with different threshold are ob-served for each oscillation frequency. Next we investigate the instability threshold dependence with disorder. According to the theoretical predictions [7, 8], the instability threshold
p = hn2Ii 2
(L/ℓ)3
> 1 is expected to decrease with
decreas-ing mean free path. We compare the intensity dependence of the peak amplitude at the main oscillation frequencyf0 for
scatterers with diametersD = 50 µm and 20 µm,
correspond-ing respectively toℓ ≈ 100µm and ℓ ≈ 40µm. Changing
the scatterer dimensions does not affect the oscillation fre-quencyf0. However the instability threshold is clearly seen
in Fig. 4 to decrease with increasing scattering (decreasing
ℓ). This clearly demonstrates the essential role of disorder in
speckle instability and the threshold dependence on the mean free path, as predicted by theory. A more systematic study of the threshold dependence with disorder and a comparison with theoretical predictions are under investigation.
100 101 102 0 0.1 0.2 0.3 0.4 0.5 Intensity Oscillation Amplitude 20 µm 50 µm
FIG. 4. Amplitude of oscillations at f0=2.39 Hz vs. average
inten-sity for two different scatterer diameters D = 50 µm and 20 µm, corresponding respectively to scattering media with mean free path
ℓ ≈ 100µm and ℓ ≈ 40µm. The threshold, which is materialized by
the crossing of the lines, decreases with decreasing ℓ.
4 parametric amplification. In a parametric process, a pump
beam atfpand a probe beam atfminterfere to create a grating
within the nonlinear material. The pump beam is itself scat-tered by this grating and nonlinearity-driven energy transfer is achieved from the pump to the probe when∆f = fp− fm6= 0. This transfer of energy via the Kerr nonlinearity has been
interpreted as an amplification process, where the gain reads asG(∆f ) = 2∆f τN L[1 + (∆f τN L)2]−1 [20]. The
cor-responding gain curve is peaked at∆f = 1/τN L. Starting
from noise, energy from the pump atfpwill be preferentially
transferred into photons at fm = fp − 1/τN L resulting in
the beating of the two beams. In the same way, the spon-taneous speckle oscillations observed in our experiment re-sult from the beating between the incident HeNe beam and the nonlinearly-generated beam at the maximum of the gain curve, giving rise to a temporal modulation atf0≈ 1/τN L.
In conclusion, we have observed speckle instabilities in transverse scattering of light in random LC films with reori-entational Kerr effect. The instability is solely attributed to the combination of scattering and Kerr nonlinearity, with un-correlated oscillations for different speckle spots. It depends on polarization, excluding any thermal effect. The inten-sity distribution of the speckle allows a direct probing of the intensity-dependence of the instability spectrum. A threshold is found which depends on the degree of disorder (ℓ). This
confirms earlier theoretical predictions [7]. The oscillation frequency just above threshold is equal to the inverse of the NL relaxation time and is interpreted in terms of the beating between the incident beam and a generated light emitted at a frequency equal to the maximum of the gain curve associated with the Kerr effect. Two regimes of speckle instability have been predicted theoretically [21]: a slow NL regime where
τN L > τD driven by the relaxation time of the non
linear-ity, as in the experiment presented here, and a fast NL regime whenτN L< τD. This second regime was out of reach in the
present experiment since the reorientational Kerr NL is ex-tremely slow. However, we conjecture that a frequency of os-cillation different from1/τN Lshould be observed, which will
strongly depend this time on the characteristics of the scatter-ing medium. As in a random laser [22, 23], the gain curve will select an eigenmode of the passive system, which in turn will beat with the pump. Different solutions can be suggested to reduce the relaxation time of LC NL reorientation, using for instance ferroelectric liquid crystal (τ < 1ms). This would
allow the exploration of the fast NL regime (τN L < τD),
where the instability oscillation should depend on the
scat-tering characteristics of the material.
This work was supported by the Federation D¨oblin FR2008 and the French National Research Agency under grant ANR-08-BLAN-0302-01.
∗ Contact: [email protected]
[1] J. W. Goodman, Statistical Optics (John Wiley, New York, 1985).
[2] I. Yamaguchi and S. Komatsu, Opt. Acta 24, 705 (1977). [3] G. Maret and P. E. Wolf, , Z. Phys. B 65, 409 (1987).
[4] D.J. Pine, D.A. Weitz, P.M. Chaikin and E. Her-bolzheimer,Phys. Rev. Lett. 60, 1134-1137 (1988).
[5] For a recent review, see S. Zhang, Y. D. Lockerman, J. Park, A. Z Genack, J. Opt. A: Pure Appl. Opt. 11, 094018 (2009). [6] B. Spivak and A. Zyuzin, Phys. Rev. Lett. 84, 1970 (2000). [7] S. E. Skipetrov and R. Maynard, Phys. Rev. Lett. 85, 736
(2000).
[8] S. E. Skipetrov Phys. Rev. E63, 056614 (2001). [9] T. Schwartz et al., Nature (London) 446, 52 (2007).
[10] Y. Lahini, A. Avidan, F. Pozzi, M. Sorel, R. Morandotti, D. N. Christodoulides, and Y. Silberberg, Phys. Rev. Lett. 100, 013906 (2008).
[11] F. Abdullaev, O. Bang, M. P. Sørensen (Eds.), Nonlinearity and
Disorder: Theory and Applications, NATO Science Series , Vol.
45 (Springer,2002)
[12] B. Liu, A. Yamilov, Y. Ling, J. Y. Xu, and H. Cao, Phys. Rev. Lett. 91, 063903 (2003).
[13] U. Bortolozzo, S. Residori, A. Petrosyan, J.P. Huignard, Optics Communications 263, 317 (2006).
[14] H. De Raedt, A. Lagendijk, and P. de Vries, Phys. Rev. Lett. 62, 47 (1989).
[15] P. Sebbah, D. Sornette, and C. Vanneste, Phys. Rev. B48, 12506 (1993).
[16] See EPAPS Document No.?? for a real time video of the speckle instability.
[17] Y. R. Shen, The Principles of Nonlinear Optics (Jonh Wiley and sons, 2003); G. Agrawal, Nonlinear Fiber Optics (Academic Press, 2007).
[18] N.V. Tabiryan, A.V. Sukhov and B. Zeldovich, Mol. Cryst. Liq. Crystals, 136, 1-40 (1985).
[19] I.C. Khoo, Physics Reports 471, 221 (2009).
[20] Y. Silberberg and I. Bar-Joseph, J. Opt. Soc. Am. B1, 662 (1984).
[21] S. E. Skipetrov, J. Opt. Soc. Am. B21, 168 (2004). [22] C. Vanneste, P. Sebbah, Phys. Rev. Lett. 87, 183903 (2001). [23] A. Andreasen et al., “Modes of Random Lasers”,