HAL Id: hal-00328466
https://hal.archives-ouvertes.fr/hal-00328466
Submitted on 10 Nov 2006
HAL is a multi-disciplinary open access
archive for the deposit and dissemination of
sci-entific research documents, whether they are
pub-lished or not. The documents may come from
teaching and research institutions in France or
abroad, or from public or private research centers.
L’archive ouverte pluridisciplinaire HAL, est
destinée au dépôt et à la diffusion de documents
scientifiques de niveau recherche, publiés ou non,
émanant des établissements d’enseignement et de
recherche français ou étrangers, des laboratoires
publics ou privés.
times
K. Tsigaridis, M. Krol, F. J. Dentener, Yves Balkanski, J. Lathière, S.
Metzger, D. A. Hauglustaine, M. Kanakidou
To cite this version:
K. Tsigaridis, M. Krol, F. J. Dentener, Yves Balkanski, J. Lathière, et al.. Change in global aerosol
composition since preindustrial times. Atmospheric Chemistry and Physics, European Geosciences
Union, 2006, 6 (12), pp.5162. �10.5194/acp-6-5143-2006�. �hal-00328466�
© Author(s) 2006. This work is licensed under a Creative Commons License.
Chemistry
and Physics
Change in global aerosol composition since preindustrial times
K. Tsigaridis1,*, M. Krol2, F. J. Dentener3, Y. Balkanski4, J. Lathi`ere4, S. Metzger5, D. A. Hauglustaine4, and
M. Kanakidou1
1Environmental Chemical Processes Laboratory, Department of Chemistry, University of Crete, P.O. Box 2208, 71003, Voutes, Heraklion, Greece
2Netherlands Institute for Space Research, Utrecht, Netherlands and Wageningen University and Research Center, Wageningen, Netherlands
3European Commission, Joint Research Centre, Institute for Environment and Sustainability, Climate Change Unit, Ispra, Italy
4Laboratoire des Sciences du Climat et de l’Environnement, 91191 Gif-sur-Yvette Cedex, France 5Max Planck Institute for Chemistry, Atmospheric Chemistry Division, Mainz, Germany
*now at: Laboratoire des Sciences du Climat et de l’Environnement, 91191 Gif-sur-Yvette Cedex, France Received: 24 March 2006 – Published in Atmos. Chem. Phys. Discuss.: 28 June 2006
Revised: 16 October 2006 – Accepted: 6 November 2006 – Published: 10 November 2006
Abstract. To elucidate human induced changes of aerosol load and composition in the atmosphere, a coupled aerosol and gas-phase chemistry transport model of the troposphere and lower stratosphere has been used. The present 3-D mod-eling study focuses on aerosol chemical composition change since preindustrial times considering the secondary organic aerosol formation together with all other main aerosol com-ponents including nitrate. In particular, we evaluate non-sea-salt sulfate (nss-SO=4), ammonium (NH+4), nitrate (NO−3), black carbon (BC), sea-salt, dust, primary and secondary or-ganics (POA and SOA) with a focus on the importance of secondary organic aerosols. Our calculations show that the aerosol optical depth (AOD) has increased by about 21% since preindustrial times. This enhancement of AOD is at-tributed to a rise in the atmospheric load of BC, nss-SO=4, NO−3, POA and SOA by factors of 3.3, 2.6, 2.7, 2.3 and 1.2, respectively, whereas we assumed that the natural dust and sea-salt sources remained constant. The nowadays in-crease in carbonaceous aerosol loading is dampened by a 34–42% faster conversion of hydrophobic to hydrophilic car-bonaceous aerosol leading to higher removal rates. These changes between the various aerosol components resulted in significant modifications of the aerosol chemical composi-tion. The relative importance of the various aerosol com-ponents is critical for the aerosol climatic effect, since at-mospheric aerosols behave differently when their chemical composition changes. According to this study, the aerosol composition changed significantly over the different
conti-Correspondence to: M. Kanakidou
nents and with height since preindustrial times. The pres-ence of anthropogenically emitted primary particles in the atmosphere facilitates the condensation of the semi-volatile species that form SOA onto the aerosol phase, particularly in the boundary layer. The SOA burden that is dominated by the natural component has increased by 24% while its con-tribution to the AOD has increased by 11%. The increase in oxidant levels and preexisting aerosol mass since preindus-trial times is the reason of the burden change, since emissions have not changed significantly. The computed aerosol com-position changes translate into about 2.5 times more water associated with non sea-salt aerosol. Additionally, aerosols contain 2.7 times more inorganic components nowadays than during the preindustrial times. We find that the increase in emissions of inorganic aerosol precursors is much larger than the corresponding aerosol increase, reflecting a non-linear at-mospheric response.
1 Introduction
Atmospheric aerosols are important constituents of the global atmosphere. They have a direct effect on climate by scattering and/or absorbing solar radiation modifying the ra-diative balance of the atmosphere. They can act as conden-sation nuclei and cloud condenconden-sation nuclei, modify cloud properties and precipitation rates, thereby indirectly influenc-ing the climate (IPCC, 2001). Their surface can also act as medium for heterogeneous reactions, modifying the chem-ical composition of both the gas and aerosol phases in the atmosphere (Tie et al., 2005).
Aerosols contain numerous compounds, which may have various chemical and physical properties, in variable pro-portions and state of mixing (e.g. organic or inorganic, hy-drophobic or hydrophilic). Over source areas the aerosol composition reflects that of the sources. Since the aerosol lifetime is of the order of a few days to a week, aerosols are transported, chemically transformed and affect areas far from where they have been formed. Moreover, organic aerosols (OA) significantly contribute to the total fine aerosol mass (Putaud et al., 2004). Important amounts of organic aerosols have also been observed in the middle troposphere (Hobbs et al., 1998; Huebert et al., 2004; Heald et al., 2005).
OA can be further separated in primary organic aerosols (POA), directly emitted in the atmosphere as aerosols, and secondary organic aerosols (SOA), which are formed af-ter chemical reactions in the atmosphere. POA sources are mainly biomass burning and fossil fuel burning, al-though recent reports (Jaenicke, 2005; O’Dowd et al., 2004) suggest an important role for POA from various biogenic sources. Using recent information on SOA formation ki-netics (Kanakidou et al., 2005a, and references therein), we recently evaluated that biogenically emitted volatile organic compounds (VOC) are the major precursors of SOA on a global scale (Tsigaridis and Kanakidou, 2003). Some of the biogenic VOC oxidation products are semi-volatile and are able to condense and produce new particles or increase the mass of the preexisting ones (Kanakidou et al., 2005a). An-thropogenic aromatic hydrocarbons can also produce SOA. Since POA and SOA have different sources they are also ex-pected to have different chemical compositions and therefore different physicochemical and optical properties and impact on climate and environment.
The human driven emissions of gases and particles have drastically increased since preindustrial times (Van Aardenne et al., 2001). In parallel, humans affected the biogenic emissions via land use changes. Thus, both anthropogenic and biogenic emissions have changed since preindustrial era due to increased agricultural and industrial activities. These changes are reflected in the atmospheric chemical composi-tion, i.e. the oxidant levels and the aerosol chemical compo-sition and therefore, are expected to influence climate. In-deed, Stier et al. (2006) have made climate simulations for the years 1860–2100 and found that altering the chemical composition of aerosols together with their physical prop-erties like mixing state and increased absorbance, affect the climate, especially when moving from the present time to future. The aim of the present work is to evaluate the modifi-cations in the chemical composition of aerosols since prein-dustrial times due to the change in both the anthropogenic and biogenic emissions. We focus on the regional and global changes in the contribution of the various aerosol compo-nents that is expected to affect the properties of the atmo-spheric aerosols. The computation of associated climate im-pact is beyond the scope of the present study. Discussion fol-lows on the chemical composition of the SOA components
and the non-linear interactions of emissions and chemistry. The modeled spatial and temporal SOA composition vari-ability and the factors that are controlling it are thoroughly presented and discussed.
2 Model description
To study the aerosol composition variability since prein-dustrial times, the global 3-dimensional chemistry transport model TM3 has been used (Houweling et al., 1998; Tsi-garidis and Kanakidou, 2003; TsiTsi-garidis et al., 2005, and references therein). A brief model description follows, em-phasizing the differences from these earlier studies, as well as the elements that are important for the present discussion. The model has a horizontal resolution of 3.75◦×5◦in lati-tude and longilati-tude and 19 vertical hybrid layers from the sur-face to 10 hPa. Roughly, 5 layers are located in the boundary layer, 8 in the free troposphere and 6 in the stratosphere. The model is driven by ECMWF ERA15 re-analysis meteorolog-ical data-archive (Gibson et al., 1997; http://www.ecmwf.int/ research/era/ERA-15) updated every 6 h. The ozone bound-ary conditions are based on TOMS data convoluted with cli-matological vertical ozone profiles as described in Lelieveld and Dentener (2000). A timestep of 90 min is applied for physics and 45 min for chemistry and aerosol production.
The model uses a modified version of the Carbon Bond chemical Mechanism version 4 (CBM-4; Gery et al., 1989) to simulate global atmospheric chemistry as described in detail by Houweling et al. (1998), together with sulphur and am-monia chemistry (Dentener et al., 1999; Jeuken et al., 2001). For the present study, reactions of terpenes and aromatics are affecting both gas-phase chemistry and aerosol production as described in detail in Tsigaridis and Kanakidou (2003). The a- and β-pinenes represent two biogenic SOA precursor VOCs, while toluene and xylene represent two anthropogeni-cally emitted aromatic compounds that form SOA. Biogenic emissions of monoterpenes and the 32% of ORVOC that are able to produce SOA (Griffin et al., 1999b) are distributed equally to a- and β-pinene. SOA production from isoprene oxidation is taken into account using the simplified approach of 0.2% aerosol molar yield (Claeys et al., 2004). This ap-proach does not make isoprene a substantial aerosol precur-sor and will be improved in future studies, based on Henze and Seinfeld (2006) recommendations.
2.1 Present day simulation
For the present day, we used a standard model simulation for the year 1990. The emissions adopted for the present and preindustrial simulations are shown in Table 1. An-thropogenic emissions vary annually based on EDGAR-HYDE 1.3 (Van Aardenne et al., 2001), as well as the emis-sions of NOxfrom soils and the biomass burning emissions of gases. The seasonality of biomass burning was kept
the same in both simulations. Methane surface concentra-tions were scaled based on a polynomial fit of the latitudinal concentrations developed by Hein et al. (1997). The OR-CHIDEE dynamic global vegetation model (Lathi`ere et al., 2006) produced monthly varying biogenic emissions for the year 1990 (isoprene, monoterpenes and other reactive bio-genic VOC) that are used in the TM3 model. DMS emissions are driven by the ERA-15 ECMWF 10 m wind speed and surface sea-water DMS concentrations compiled by Kettle et al. (1999). BC and POA emissions are based on the estimates of Ito and Penner (2005), which include both temporal and spatial variations for the present and preindustrial era. These emissions are similar with the average emissions given by Bond et al. (2004). The hydrophilic fractions of POA and BC emissions is assumed to be 80% and 50%, respectively. Particulate nitrate and aerosol associated water (AAW) are computed online with EQSAM (Metzger et al., 2002). The AAW calculation is based only on the inorganic nss-sulfate, ammonium and nitrate components of the total aerosol mass. Therefore, neglecting the other aerosol components for the calculation of AAW affects neither the wet removal and the distribution of aerosols nor any other results of the present study, since AAW in the model is used only as a diagnostic variable. Moreover, the effect of aerosol size increase by wa-ter uptake on the extinction coefficients and thus in the AOD calculations is taken into account for all hydrophilic aerosol components based on a polynomial fit by Veefkind (1999) for sulfate aerosols as described in Tsigaridis et al. (2005).
Sea-salt and dust particles are taken into account for the present study. The daily emissions of these aerosol compo-nents come from the AEROCOM-B compilation for the year 2000 (http://nansen.ipsl.jussieu.fr/AEROCOM; Dentener et al., 2006). Following the AEROCOM recommendations we consider three modes for sea-salt aerosol (aitken, accumula-tion and coarse) and two for dust (accumulaaccumula-tion and coarse) aerosol (Table 2).
2.2 Preindustrial simulation
For the preindustrial simulation, stratospheric ozone is forced based on the 1980 TOMS ozone column. This assump-tion though could underestimate preindustrial stratospheric ozone, since in 1980 the stratospheric ozone depletion and tropospheric ozone increase have been already initiated (Shindell and Faluvegi, 2002). For the preindustrial simu-lation, we used the same meteorology as in the present-day simulation, that of 1990, but different emissions. Therefore, the computed changes since the preindustrial period are en-tirely driven by the change in emissions. Interestingly, the in-crease in emissions of inorganic aerosol precursors SO2and dimethylsulfide (DMS; constant in both simulations), NH3 and NOxsince the preindustrial period of about a factor of 3.4, 6 and 5, respectively, is much larger than the correspond-ing aerosol burden increase of nss-sulfate (factor of 2.6), am-monium (factor of 2.9) and nitrate (factor of 2.7), reflecting a
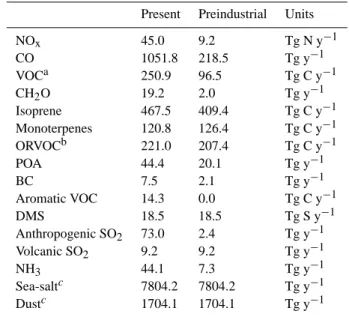
Table 1. Present (year 1990) and preindustrial (year 1860)
emis-sions used by the model.
Present Preindustrial Units
NOx 45.0 9.2 Tg N y−1 CO 1051.8 218.5 Tg y−1 VOCa 250.9 96.5 Tg C y−1 CH2O 19.2 2.0 Tg y−1 Isoprene 467.5 409.4 Tg C y−1 Monoterpenes 120.8 126.4 Tg C y−1 ORVOCb 221.0 207.4 Tg C y−1 POA 44.4 20.1 Tg y−1 BC 7.5 2.1 Tg y−1 Aromatic VOC 14.3 0.0 Tg C y−1 DMS 18.5 18.5 Tg S y−1 Anthropogenic SO2 73.0 2.4 Tg y−1 Volcanic SO2 9.2 9.2 Tg y−1 NH3 44.1 7.3 Tg y−1 Sea-saltc 7804.2 7804.2 Tg y−1 Dustc 1704.1 1704.1 Tg y−1
a: Excluding biogenic species line isoprene, monoterpenes and
other reactive VOC (ORVOC).
b: The fraction of reactive biogenic VOC (excluding monoterpenes
and isoprene) that is able to produce SOA is notated as ORVOC, while the non-SOA producing ORVOC (68% of total ORVOC) are added to the VOC species.
c: Both preindustrial and present emissions are based on the year
2000.
non-linear atmospheric response. Chemistry is a non-linear process since catalytic cycles and feedback mechanisms are involved, therefore the increase in the abundance of a species does not necessarily induces a proportional increase in its ox-idation products, if they increase at all. As a consequence, linear processes, like emissions, coupled to chemistry will have a non-linear response (atmospheric burdens).
For the preindustrial simulation, the anthropogenic emis-sions are based on EDGAR-HYDE 1.3 for the year 1860 (Van Aardenne et al., 2001), as well as the emissions of NOxfrom soils and the biomass burning emissions of gases. Primary carbonaceous aerosol emissions are based on Ito and Penner (2005) for the year 1870. It has to be noted that most models assume that during the preindustrial period the biomass burning emissions are scaled to 10% of that of present day, while based on Ito and Penner (2005) this num-ber is on global average 44%, varying spatially. The bio-genic emissions are calculated by Lathi`ere et al. (2005) for the year 1850 and are based on present day climate forcing from CRU (Climate Research Unit, UK) with relative humid-ity corrected using ECMWF data, and a preindustrial CO2 atmospheric mixing ratio of 280 ppmv. Note that the present day high atmospheric CO2levels enhance the biogenic VOC emissions (due to increased leaf expansion) counterbalancing
Table 2. Sea-salt and dust aerosol log-normal mode properties.
Sea-salt Dust
Diameter Sigma Density Diameter Sigma Density
(µm) (g cm−3) (µm) (g cm−3) Aitken 0.01–0.1 1.59 2.2 – – – Accumulation 0.1–1 1.59 2.2 0.1–1 1.59 2.5 Coarse 1–20 2.00 2.2 1–12 2.00 2.5 VOC/NOx(ppbC/ppb) 5.5 8.0 High anthropogenic Low anthropogenic
Low biogenic High biogenic Intermediate anthropogenic
Fig. 1. VOC/NOxregimes used in the SOA calculations.
Anthro-pogenic: Song et al. (2005); biogenic: Presto et al. (2005).
the reduction of biogenic VOC emissions due to deforesta-tion. This leads to a global increase of biogenic VOC emis-sions of 9%, most of it due to isoprene; SOA precursor VOC (monoterpenes and ORVOC; see Table 1) have been increased by only 2%. We assumed no changes of DMS sea-water concentrations between the pre-industrial and present time. Dust and sea-salt natural emissions are the same for the pre-industrial and present day simulations, an assumption which is consistent with Menon et al. (2002) that indicate an increase of about 8% in sea-salt load since preindustrial era in their standard simulation.
2.3 SOA parameterization
The TM3 model includes coupled gas- and aerosol-phase calculations that include equilibrium chemistry of inorganic aerosol components and partitioning of semi-volatile gas-phase compounds to the aerosol gas-phase. Additionally, the heterogeneous reaction of N2O5 on inorganic aerosols and chemical transformation of hydrophobic primary carbona-ceous aerosols to hydrophilic by reaction with ozone are in-cluded. This chemical aging process depends therefore on O3levels and affects the removal of carbonaceous aerosols from the atmosphere, since hydrophilic aerosols are more ef-ficiently scavenged from the atmosphere than hydrophobic ones. All aerosols are considered to be externally mixed. SOA formation is described using a two-product model ap-proximation, which has been shown to be the simplest way to efficiently represent aerosol formation from both biogenic (Hoffmann et al., 1997) and aromatic VOC (Odum et al., 1997):
VOC+oxidant→a1SOA1+a2SOA2+high volatility products (1)
Where ai is the mass-based production yield of the
semi-volatile lumped SOA product SOAi that partitions between
the gas and particulate phase with a partitioning coefficient
Ki. The oxidants considered in the model for VOC oxidation
are O3, OH and NO3radicals. However, we assumed that in the case of biogenic hydrocarbons the only oxidant leading to SOA formation is O3, while for the aromatic VOC both OH radicals and O3are initiating SOA production. For the biogenic VOC, partly due to the increased reactivity applied in order to accurately represent the mixture of monoterpenes and higher homologues by only a- and β-pinene, ozonol-ysis consumes roughly 80% of this mixture. Further, the partitioning data reported by Presto et al. (2005) are for the ozonolysis of a-pinene. However, assuming that all oxidants can contribute to SOA formation, with the ozonolysis re-ported yields, only a 16% increase in global annual SOAb production is calculated, leading to a 29% increase to the corresponding burden. For aromatics, the ozonolysis of aro-matics is very slow; indeed, more than 99% of aromatic species are being consumed by the reaction of OH radicals in the TM3 model. Therefore, the oxidation of aromatics by other oxidants than OH turns to be negligible source of anthropogenic SOA. The adopted parameterization, together with the related uncertainties in the calculations, has been described in detail earlier (Tsigaridis and Kanakidou, 2003). Although Tsigaridis and Kanakidou (2003) have shown that the oxidation of SOA components can increase the SOA pro-duction by about 20%, in the present study the SOAi
com-ponents are assumed to be chemically inert, since the pa-rameterization is based on overall yields of SOA formation from chamber experiments. More detailed information on the base scenario used in this study is described in Tsigaridis et al. (2005).
The lumped compounds SOAi have different
produc-tion coefficients ai, different partitioning coefficients to the
aerosol phase (high partitioning coefficient means that the compound preferably partitions on the aerosol phase and has lower vapor pressure) and different enthalpies of vaporiza-tion 1H (the temperature dependence of the partivaporiza-tioning co-efficients is linked to the 1H ; high 1H means stronger de-pendence of the vapor pressure on temperature; for details see Tsigaridis and Kanakidou, 2003).
In the present study, the above mentioned SOA formation mechanism has been improved in order to be able to calcu-late different products with different SOA formation yields
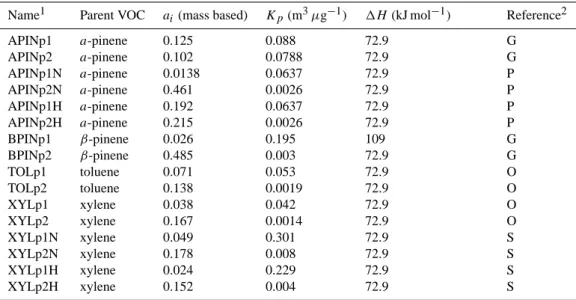
Table 3. Properties of the SOA species used by the two product model for SOA formation.
Name1 Parent VOC ai (mass based) Kp(m3µg−1) 1H(kJ mol−1) Reference2
APINp1 a-pinene 0.125 0.088 72.9 G APINp2 a-pinene 0.102 0.0788 72.9 G APINp1N a-pinene 0.0138 0.0637 72.9 P APINp2N a-pinene 0.461 0.0026 72.9 P APINp1H a-pinene 0.192 0.0637 72.9 P APINp2H a-pinene 0.215 0.0026 72.9 P BPINp1 β-pinene 0.026 0.195 109 G BPINp2 β-pinene 0.485 0.003 72.9 G TOLp1 toluene 0.071 0.053 72.9 O TOLp2 toluene 0.138 0.0019 72.9 O XYLp1 xylene 0.038 0.042 72.9 O XYLp2 xylene 0.167 0.0014 72.9 O XYLp1N xylene 0.049 0.301 72.9 S XYLp2N xylene 0.178 0.008 72.9 S XYLp1H xylene 0.024 0.229 72.9 S XYLp2H xylene 0.152 0.004 72.9 S
1Nomenclature of species was chosen as follows: First 3 or 4 capital letters denote the parent VOC. The letter “p”, followed by the number
1 or 2, denotes the product number. In case there is an additional letter “N” or “H”, it denotes formation under low and high VOC/NOxratio
conditions, respectively. For the intermediate case of aromatic oxidation (5.5<VOC/NOx<8 in ppbC/ppb; Song et al., 2005), the average
parameters of high-to-low VOC/NOxwere used.
2G: Griffin et al. (1999a); O: Odum et al. (1997); P: Presto et al. (2005); S: Song et al. (2005).
depending on the VOC/NOxratio, as proposed by Presto et al. (2005) for a-pinene and Song et al. (2005) for xylene (Fig. 1). In order to simulate the VOC/NOxdependence on SOA formation from β-pinene and toluene, their aerosol pro-duction capability (ai and Ki)has been scaled based on the
a-pinene and xylene SOA production dependence on NOx. For example, the partitioning coefficient KBPINp1N used in the model (β-pinene oxidation product in low VOC/NOx regime; see Table 3 for nomenclature), is calculated as fol-lows:
KBPINp1N =KBPINp1/KAPINp1×KAPINp1N (2)
These numbers can be found in Table 3 for the precursor VOCs considered in the present study. Including such a rep-resentation in the calculation of SOA formation reduces the chemical production of biogenic SOA by about 20% and in-creases the anthropogenic SOA by about the same percent-age. This happens because the new biogenic SOA parame-terization accounts for more volatile components produced at low VOC/NOxenvironments, though in the anthropogenic SOA case the adopted yields from Song et al. (2005) are higher than the ones from Odum et al. (1997). Addition-ally, the product distribution differs substantially around the globe; high VOC/NOxproducts are dominant above remote regions, while low VOC/NOx products are more abundant above industrialized areas. Since the more volatile products are expected to have a different climatic impact compared to the less volatile products, due to different physical and
chem-ical properties of the particles produced, we recommend that future SOA modeling studies include the VOC/NOx depen-dence on the SOA production.
2.4 Aerosol removal processes
Dry deposition for all aerosol components is parameterized similarly to that of nss-sulfate, except for dust and sea-salt particles for which sedimentation has also been considered (Table 4). The in-cloud scavenging of dust, of the hydropho-bic primary carbonaceous aerosols and of the 20% of SOA that is assumed hydrophobic (Chung and Seinfeld, 2002) is lower than that of nss-sulfate (due to their lower water affin-ity) whereas the below-cloud scavenging is kept the same (Seinfeld and Pandis, 1998). The other aerosol components are scavenged with the same efficiency as nss-sulfate. Num-ber and mass distributions of sea-salt and dust are calcu-lated every time step for each mode separately, assuming the lognormal distributions described in Table 2. The size distribution of sea-salt and dust affects their dry deposition rate since sedimentation that is negligible for small particles, dominates for large particle sizes, Wet removal (solubility to clouds and below-cloud scavenging) though is the same for all sizes but depends on its hydrophobic or hydrophilic char-acter of the particles as explained earlier.
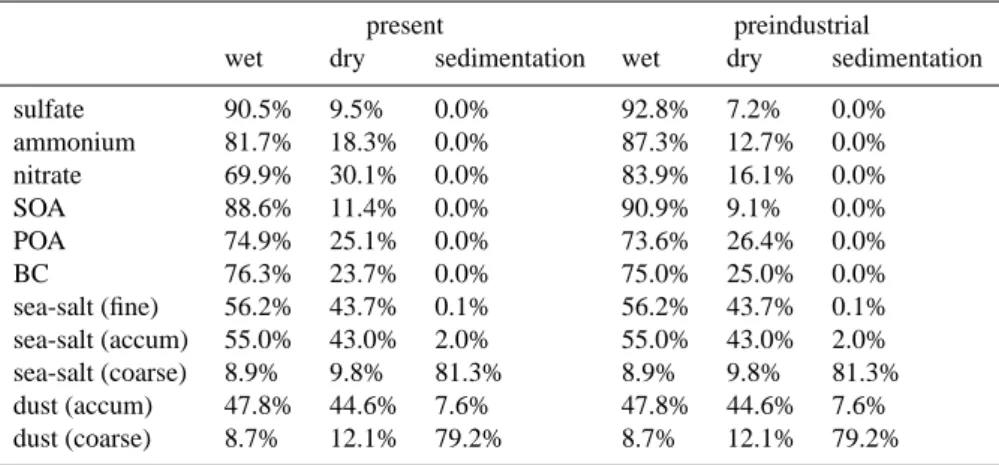
Table 4. Percentage contribution of the removal processes for all aerosol components in the model. Sea-salt coarse fraction has larger size
than the dust coarse fraction (Table 2).
present preindustrial
wet dry sedimentation wet dry sedimentation
sulfate 90.5% 9.5% 0.0% 92.8% 7.2% 0.0% ammonium 81.7% 18.3% 0.0% 87.3% 12.7% 0.0% nitrate 69.9% 30.1% 0.0% 83.9% 16.1% 0.0% SOA 88.6% 11.4% 0.0% 90.9% 9.1% 0.0% POA 74.9% 25.1% 0.0% 73.6% 26.4% 0.0% BC 76.3% 23.7% 0.0% 75.0% 25.0% 0.0% sea-salt (fine) 56.2% 43.7% 0.1% 56.2% 43.7% 0.1% sea-salt (accum) 55.0% 43.0% 2.0% 55.0% 43.0% 2.0% sea-salt (coarse) 8.9% 9.8% 81.3% 8.9% 9.8% 81.3% dust (accum) 47.8% 44.6% 7.6% 47.8% 44.6% 7.6% dust (coarse) 8.7% 12.1% 79.2% 8.7% 12.1% 79.2% 3 Results 3.1 Oxidant fields
The change in the levels of oxidants (O3, NO3, H2O2 and OH) is important for the degradation of VOC and sulfur diox-ide, and therefore for the formation of secondary aerosols. H2O2 and OH are important for the formation of SO=4, whereas O3is the dominant oxidant responsible for the SOA formation. Limited information is available from measure-ments that give an indication on the levels of oxidants during the preindustrial period. Based on our model calculations, the mean boundary layer ozone concentration has increased by more than 74% since preindustrial times, while the cor-responding NOxburden has been increased by more than a factor of 4. The increase in the boundary layer ozone centration resulted in a net decrease in biogenic VOC con-centrations by 42% for the case of isoprene and 59% for monoterpenes. The global mean OH radical concentration also changed since preindustrial era, resulting in a 5% in-crease of the tropospheric methane lifetime. The change in the oxidizing capacity of the atmosphere led to a longer life-time of SO2due to chemical reactions that produce sulfate particles, combined with an increase in its atmospheric load. Comparison with the few existing measurements during the preindustrial period (Volz and Kley, 1988; Anfossi et al., 1991; Sandroni et al., 1992; Marenco et al., 1994; Sandroni and Anfossi, 1994; Pavelin et al., 1999) indicates that the model may overestimate ozone concentrations (within a fac-tor of two and in some cases above a facfac-tor of 3), with only 3 occasions (over wintertime Japan) of calculated O3 con-centration above 30 ppbv. These high O3levels are mainly associated with strong stratospheric influx of ozone in the troposphere in the northern hemisphere during the winter and spring periods. The strong stratospheric influx of O3 is a feature common to global models (Pavelin et al., 1999).
Moreover, it has to be noted that the preindustrial ozone mea-surements are highly uncertain, since the Sch¨onbein method used at the end of the nineteenth century suffers from signif-icant interference from several sources (Pavelin et al., 1999). With regard to H2O2levels, the observed increase of 50% in Greenland since preindustrial times (Sigg and Neftel, 1991) is consistent with our model calculated increase of 48%. 3.2 Aerosol burden
Some indication on the changes in the levels of aerosol constituents since preindustrial period is provided by the ice core measurements. These measurements (Greenland ice core; Mayewski et al., 1986) show an increase in nss-sulfate and nitrate concentration by a factor of 2.8 (from 30 to 84 µg kg−1) and 2.1 (from 55 to 115 µg kg−1), respec-tively, since preindustrial times that is lower than the cal-culated increase by the model (3.9 and 6.4, respectively). Although both measurements and model results are associ-ated with large uncertainties, they indicate that significant changes have occurred both in oxidant levels and in aerosol composition since preindustrial era. In addition, as discussed earlier, the turnover time of the hydrophobic to hydrophilic carbonaceous aerosol depends on oxidant levels. According to our model online calculations, this turnover time has been reduced due to the increase in O3levels, from 1.7 days (for POA) and 1.8 days (for BC) during preindustrial times to 1.1 and 1.0 days, respectively.
Our model calculations suggest that the total annual aver-age aerosol mass in the model domain has increased since preindustrial times from 26.8 Tg to 28.9 Tg (Table 5). This increase is attributed to all aerosol components except dust and sea-salt, which were kept constant at present-day lev-els. Excluding these natural aerosol components, the calcu-lated aerosol mass has increased from 2.7 Tg to 4.8 Tg. Note that our model does not account for the mixing of aerosols
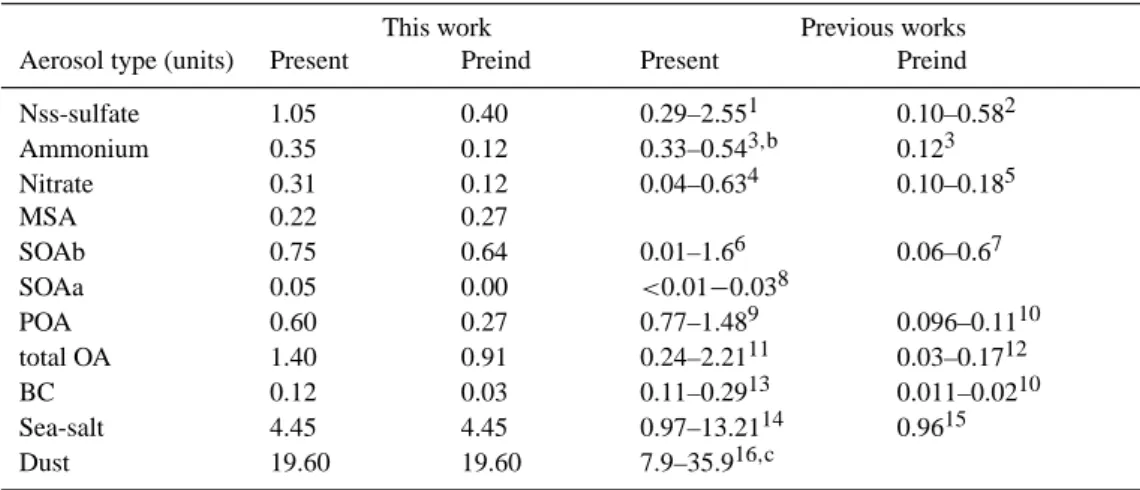
Table 5. Global annual average aerosol burden for the present and preindustrial simulations and comparison with the literature. All units are
Tg.
This work Previous works
Aerosol type (units) Present Preind Present Preind
Nss-sulfate 1.05 0.40 0.29–2.551 0.10–0.582 Ammonium 0.35 0.12 0.33–0.543,b 0.123 Nitrate 0.31 0.12 0.04–0.634 0.10–0.185 MSA 0.22 0.27 SOAb 0.75 0.64 0.01–1.66 0.06–0.67 SOAa 0.05 0.00 <0.01−0.038 POA 0.60 0.27 0.77–1.489 0.096–0.1110 total OA 1.40 0.91 0.24–2.2111 0.03–0.1712 BC 0.12 0.03 0.11–0.2913 0.011–0.0210 Sea-salt 4.45 4.45 0.97–13.2114 0.9615 Dust 19.60 19.60 7.9–35.916,c
1AEROCOMa; Stier et al. (2005); Adams et al. (2001); Tie et al. (2005); Rotstayn and Lohmann (2002); Koch et al. (2003); Kirkev˚ag and
Iversen (2002); Rasch et al. (2000); Chin et al. (2000); Koch (2001); Barth et al. (2000); Kiehl et al. (2000); Boucher and Pham (2002); Chuang et al. (2002); Derwent et al. (2003); Menon et al. (2002); Liao and Seinfeld (2005); TM5b
2Adams et al. (2001); Boucher and Pham (2002); Kiehl et al. (2000); Menon et al. (2002); Liao and Seinfeld (2005) 3Adams et al. (2001)
4Adams et al. (2001); Derwent et al. (2003); Liao and Seinfeld (2005); TM5 5Adams et al. (2001); Liao and Seinfeld (2005)
6Tsigaridis and Kanakidou (2003); Kanakidou et al. (2000); Chung and Seinfeld (2002); Griffin et al. (1999b); Derwent et al. (2003); Liao
and Seinfeld (2005)
7Kanakidou et al. (2000); Chung and Seinfeld (2002); Liao and Seinfeld (2005) 8Tsigaridis and Kanakidou (2003)
9AEROCOM; Stier et al. (2005); Chung and Seinfeld (2002); Koch (2001); Liao and Seinfeld (2005); TM5 10Chung and Seinfeld (2002); Liao and Seinfeld (2005)
11Tie et al. (2005); Reddy and Boucher (2004); Chuang et al. (2002); Menon et al. (2002); Chung and Seinfeld (2002) 12Menon et al. (2002); Chung and Seinfeld (2002)
13AEROCOM; Stier et al. (2005); Tie et al. (2005); Kirkev˚ag and Iversen (2002); Koch (2001); Chung and Seinfeld (2002); Cooke and
Wilson (1996); Liousse et al. (1996); Chuang et al. (2002); Liao and Seinfeld (2005); TM5
14AEROCOM; Stier et al. (2005); Guelle et al. (2001); Liao et al. (2004); Tie et al. (2005); Chuang et al. (2002); Menon et al. (2002); TM5 15Menon et al. (2002)
16AEROCOM; Stier et al. (2005); Ginoux et al. (2001); Liao et al. (2004); Tie et al. (2005); Grini et al. (2005); Miller et al. (2004); Luo et
al. (2003); Zender et al. (2003); Chuang et al. (2002); TM5
aAEROCOM: Median value of all models from the AEROCOM A intercomparison.
bTM5: Krol et al., The European aerosol budget, Manuscript in preparation; Kanakidou et al. (2005b).
cExcluding the Chuang et al. (2002) and Ginoux et al. (2001) burden of more than 30 Tg, the range is 7.9–19.5 Tg.
that could alter the hygroscopicity and the removal of dust particles, a property that may have changed since prein-dustrial era (Kanakidou et al., 2005b). Nss-sulfate, nitrate and black carbon (BC) aerosol have strong anthropogenic sources, since they are either chemically produced by an-thropogenically emitted precursor compounds (SO2and NOx for nss-sulfate and nitrate, respectively) or are directly emit-ted in the particulate phase (BC). Organic aerosols have also a strong primary anthropogenic source but are additionally produced by chemical transformation of biogenic and anthro-pogenic VOC (Tsigaridis and Kanakidou, 2003; Kanakidou et al., 2005a). This secondary source is calculated to increase from 12.8 Tg y−1during preindustrial times to 19.3 Tg y−1at
present. Anthropogenic aromatic VOC oxidation and conse-quent aerosol production is responsible for 30% of this in-crease.
A comparison of the modeled present day results with measurements for OA, BC, sea-salt and dust is shown in Fig. 2. Organic aerosols are mostly underestimated by the model (on average by a factor of 2), while BC compares bet-ter with measurements. The model generally overestimates the sea-salt measurements below 2 µg m−3 by more than a factor of two, while the model simulates better the highest concentrations. The comparison with sea-salt measurements shows a better agreement in the Pacific Ocean, where model results are within a factor of 2 with observations at most
OA 1.E+00 1.E+01 1.E+02 1.E+03 1.E+04 1.E+05
1.E+00 1.E+01 1.E+02 1.E+03 1.E+04 1.E+05
Measurements (μg m-3) M o del ( μ g m -3 ) BC 1.E-02 1.E-01 1.E+00 1.E+01 1.E+02 1.E+03 1.E+04 1.E+05
1.E-02 1.E+00 1.E+02 1.E+04
Measurements (μg m-3) Mo d el ( μ g m -3 ) Sea-salt 0.1 1 10 100 0.1 1 10 100 Measurements (μg m-3) Model ( μ g m -3 ) Dust 0.01 0.1 1 10 100 0.01 0.1 1 10 100 Measurements (μg m-3) Model ( μ g m -3 )
Fig. 2. Measured vs. modeled OA (top-left), BC (top-right), sea-salt (bottom-left) and dust (bottom-right) values for the present day. The solid
line denotes the 1:1 ratio and the dashed lines the 1:10 and 10:1 ratios, respectively. Dust and sea-salt measurements are annual means from the European measurement network EMEP (http://www.emep.int), the North-American measurement network IMPROVE (http://vista.cira. colostate.edu/improve) and measurements compiled by the Global Atmosphere Watch (GAW) program (http://wdca.jrc.it). Carbonaceous aerosol measurements are those used in Tsigaridis and Kanakidou (2003).
measuring stations. From a total of 37 stations used in the comparison, only 4 of them are overestimated by more than a factor of 10. Note however that the modeled mass concen-tration of sea-salt is totally determined by its very short-lived coarse fraction, a fact that severely hampers a comparison with measurements. For dust, the model agrees surprisingly well with the highest concentration levels, which mostly af-fect the global dust burden, and overestimates mainly those concentrations that are below 1 µg m−3. One station where the model overestimates the dust values by more than a fac-tor of 10 is in the southern Atlantic Ocean (Yate, New Cale-donia), with the others being in the Pacific. This indicates some deficiencies in the representation of long range trans-port and/or removal of dust in the model.
When comparing with other model results (Table 5), our simulations simulate well the sulfate burden and tend to lie close to the lowest values of global aerosol load for ammo-nium. The published values of atmospheric loads of POA and BC vary by more than a factor of 3, with the results presented here being at the lower edge of those ranges for OA. BC agrees much better with the measured concentrations around
the globe. This could be attributed either to (i) very effi-cient wet deposition (lifetime due to wet removal of 6.0 and 6.3 days for POA and BC, respectively at present), or to (ii) fast turnover time of the hydrophobic to hydrophilic carbona-ceous aerosols (1.1 and 1.0 days for hydrophobic POA and BC respectively), or to (iii) the adopted POA and BC emis-sions that are generally lower than in other models (Textor et al., 2005) as discussed in Sect. 2. SOA burdens are within the range of previous studies. The sea-salt and dust global burdens lie within the range of previous published model es-timates.
Ammonium is also lower than other models. Since ammo-nium, sulfate and nitrate are in thermodynamic equilibrium, the concentrations of nitrate depend on the availability of am-monium, which in turn is controlled by the amount of sulfate present since ammonium is preferably neutralizing sulfuric acid in the atmosphere and only the remaining ammonium is controlling the HNO3/NO−3 equilibrium. This nicely ex-plains the differences between Adams et al. (2001) results and our model calculations. Adams et al. (2001) global am-monium burden is about 70% more than in our model, in
parallel their nss-sulfate burden lies to the upper values of the published range and is more than 2 times higher than our re-sults, however somewhat surprisingly for nitrate aerosol the two models are in closer agreement (within 20%).
Among the studies reported in Table 5, only Liao and Seinfeld (2005) consider all major aerosols including SOA as in the present study. The preindustrial sulfate burden in Liao and Seinfeld (2005) is about 30% higher than in our simulation, reflecting their adopted larger increase in SO2 emissions. In addition, nitrate aerosols in Liao and Seinfeld (2005) are 50% more abundant than in our study, although the NOxemissions are similar, possibly reflecting the differ-ences in the adopted ammonia emissions between the two studies, in both the preindustrial and present atmospheres. Differences in emissions of POA and BC are also reflected in the burdens of these aerosol components in both studies. Furthermore, in the present study biogenic SOA is more than double the calculated by Liao and Seinfeld (2005). This difference is attributed to the condensation of semi-volatile compounds also on inorganic aerosol components, and the consideration of anthropogenic SOA in the present work. 3.3 Aerosol composition
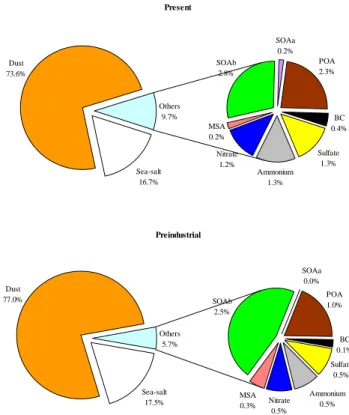
Figure 3 shows the computed relative contribution of the var-ious aerosol components to the total aerosol burden for the present and the preindustrial atmospheres. Anthropogenic emissions have increased the nss-sulfate, nitrate, ammonium, POA and BC component of aerosols, resulting in a lower contribution of the natural components dust, sea-salt and MSA. SOA from biogenic VOC oxidation (SOAb) has in-creased its boundary layer load as a result of both higher oxidant (mainly O3)and pre-existing aerosol levels that en-hance SOA production (chemical production and conden-sation). The increase of inorganic aerosol components in the total aerosol mass leads to more acidic and hygroscopic aerosols, due to the disproportional increase of the sum of nss-sulfate and nitrate relative to ammonium constituents.
Another important constituent of atmospheric particulate matter is the aerosol associated water (AAW), since it af-fects the chemical composition, size and optical properties of aerosols. Note that carbonaceous aerosols, sea-salt and dust are not taken into account in the calculation since they are not included in the EQSAM scheme used in the present study. In particular, the high variability and uncertainty in the organic aerosol hygroscopic behavior (Kanakidou et al., 2005a) is the limiting factor for the consideration of organics in the computations of the AAW. This will not affect the results strongly, since at low relative humidity organic aerosols are expected to be responsible for about 20% of the total AAW, while at high relative humidity their contribution becomes much less important (Kanakidou et al., 2005a). AAW con-tribution to the total aerosol mass has increased by a factor of 2.5 since preindustrial times, because the hygroscopicity of aerosols has increased due to human activities. This
in-Present Sea-salt 16.7% Dust 73.6% Sulfate 1.3% Ammonium 1.3% Nitrate 1.2% MSA 0.2% SOAb 2.8% SOAa 0.2% POA 2.3% BC 0.4% Others 9.7% Preindustrial Sea-salt 17.5% Dust 77.0% Sulfate 0.5% Ammonium 0.5% Nitrate 0.5% MSA 0.3% SOAb 2.5% SOAa 0.0% POA 1.0% BC 0.1% Others 5.7%
Fig. 3. Relative contribution of aerosol components to the total
aerosol burden for the present (top) and preindustrial atmospheres (bottom) based on the model calculations. The total aerosol burden is 28.9 Tg and 26.8 Tg, respectively.
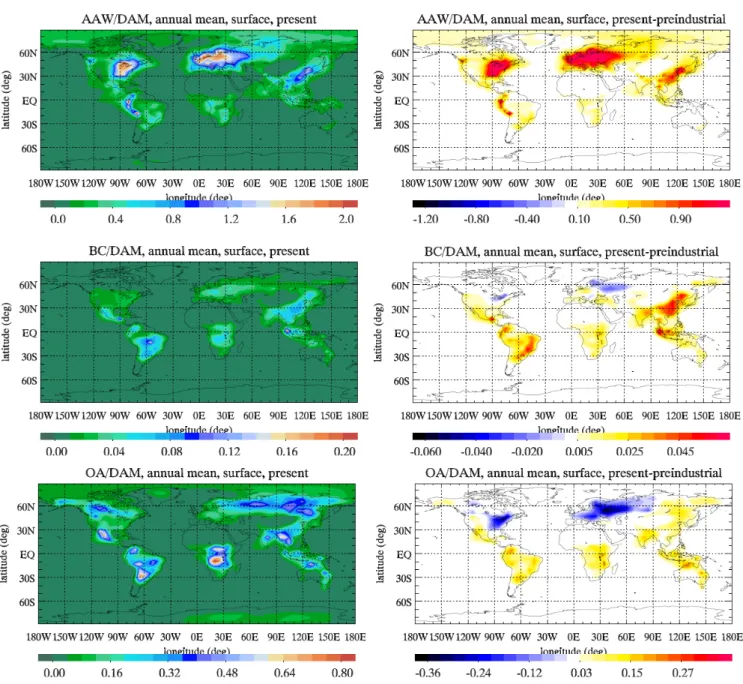
crease can be explained by the general increase of inorganic constituent levels associated with more acidic aerosols. For the present day the model calculates more AAW than the to-tal dry aerosol mass for most of the industrialized regions of the world (northeastern U.S., Europe, southeast China and Japan) where it has drastically increased since preindustrial times (Fig. 4).
With regard to the carbonaceous component of the aerosols, the BC and POA contributions to the total aerosol mass have increased by a factor of 3.3 and 2.3, respec-tively, due to an increase of their emissions since preindus-trial times. Present day OA (POA+SOA) can account for up to 90% of the total particulate matter (Fig. 4). During the preindustrial period the areas where OA is calculated to be the major component (>50%) of the dry total particulate matter, are larger than at the present day. In contrast, BC contribution to dry total aerosol mass has increased since the preindustrial period from 0.1 to 0.4% (Fig. 4). BC has about 50 times higher emissions from fossil fuel burning and more than doubled open vegetation and biofuel burn-ing emissions since preindustrial times. POA emissions from fossil fuel burning also increased by more than a factor of 30 and the emissions from open vegetation and biofuel burning have doubled. Additionally, an important part of OA comes from the oxidation of VOC. This secondary source is mainly
Fig. 4. Annual mean aerosol component to dry aerosol mass (DAM) surface ratio for the present (left panels) and the corresponding difference
from the preindustrial (right panels) simulation. Aerosol components are AAW (top panels), BC (medium panels) and OA (bottom panels).
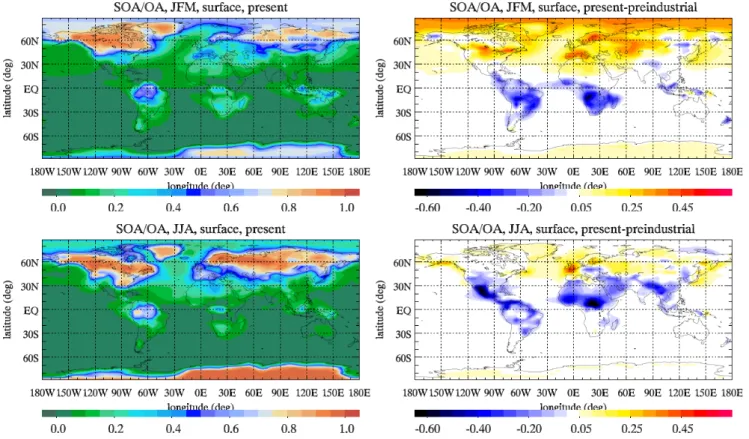
biogenic. Due to the small increase of SOA VOC precur-sors, the increase in SOA load is due to additional production which can be attributed mainly to the O3increase since prein-dustrial times, and the increase of pre-existing aerosol mass, factors that together with temperature control SOA formation in the atmosphere (Tsigaridis and Kanakidou, 2003). The re-gional chemical composition of OA has changed strongly in the tropical biomass burning regions, India and Asia from the preindustrial era to present day, reflecting the disproportional change of SOA/OA ratios (Fig. 5).
3.4 SOA chemical composition and controlling factors In addition to the changes in the contribution of SOA to the total OA mass, the chemical speciation of SOA is also ex-pected to have changed since preindustrial times. Changes in the relative contribution of these species to the total SOA mass are expected to alter the aerosol optical properties and their ability to act as condensation nuclei and cloud conden-sation nuclei, having thus a major impact on climate. For instance, it is expected that by increasing NOxlevels in the atmosphere, SOA will contain more of the high volatility species as well as organic nitrate species. The overall effect
Fig. 5. SOA to OA mass surface ratio for winter (top panels) and summer (bottom panels) for the present (left panels) and the corresponding
difference from the preindustrial (right panels) simulation.
is therefore expected to be an increase in the volatility of the aerosol and a decrease of the hygroscopicity (Presto et al., 2005). Note that higher volatility SOA species tend to con-dense at lower temperatures and thus at higher altitudes in the troposphere. It is therefore expected that the increase in NOx levels since preindustrial period will partially shift particle formation toward colder areas. However, this effect is coun-terbalanced by the increasing primary particles that enhance SOA formation in the boundary layer as further discussed. Indeed, the SOA species produced over low VOC/NOx ra-tio areas contribute to 72% to the total SOA mass at present time, in contrast to the preindustrial region that this contri-bution was 48% (in the boundary layer the contricontri-butions are 50% and 7%, respectively). The changes in the chemical composition of the SOA component are investigated in this section by the mean of the calculated changes in the lumped SOA species taken into account in our model.
3.4.1 Changes at the surface
In order to investigate the spatial change in the chemical composition of SOA since preindustrial times, we calculated for each one of the SOA species the spatial variation of the partitioning (Sect. 2) between the aerosol and the gas phases as the ratio of aerosol phase concentration to its total (aerosol
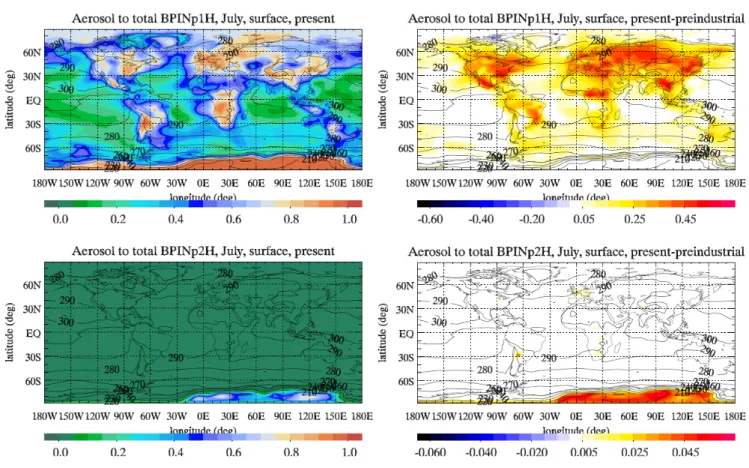
and gas-phase) concentration. Figure 6 shows the ratios dur-ing July at the surface for two SOA species with distinct volatility and thus different properties and possible climatic impact (BPINp2H: relatively high volatility, expected to be mostly in the gas phase at surface; BPINp1H: relatively low volatility, expected to be mostly in the aerosol phase at sur-face; for naming of the species, see footnote of Table 3). In our model, BPINp1H has the highest partitioning coefficient (lowest vapor pressure) and additionally has a high enthalpy of vaporization (strong temperature dependence). This ex-plains why it has the highest aerosol-phase to total mass ra-tio of all the model biogenic SOA species at the surface. In atmospheric samples this species could be linked to the less volatile among the semi-volatile compounds. On the con-trary, the smallest partitioning coefficient from all SOA com-pounds (highest vapor pressure) has been attributed to the BPINp2H, thus this SOA species could correspond to the more volatile among the semi-volatile compounds found in atmospheric samples. The other semi-volatile compounds of the two product model produced from β-pinene oxidation are less abundant, while these produced from the a-pinene oxidation chain represent intermediate volatility for semi-volatile compounds found in atmospheric samples.
BPINp2H is mostly in the gas-phase at the earth’s sur-face, even over areas with high aerosol loads. This is most
Fig. 6. Ratio of aerosol-phase to aerosol- and gas-phase SOA species (surface) for the present (left panels) and the corresponding difference
from the preindustrial (right panels) simulation for BPINp1H (top panels) and BPINp2H (bottom panels). Contours show the monthly mean temperature (K).
pronounced in the preindustrial period, when (excluding the South Pole) more than 90% of this species is in the gas phase. At the South Pole both BPINp1H and BPINp2H are found primarily in the aerosol phase due to the extremely low tem-peratures. North Pole temperatures are somewhat higher than at South Pole, and only the less volatile SOA species are dominantly in the aerosol-phase. There, temperature is the controlling factor. However, this is not the case in the other areas of the world, where the SOA species reside mostly in the aerosol phase mainly above land, and hardly above the oceans, even at locations with similar temperatures. This is because they tend to condense on pre-existing aerosols, which are more abundant above continental source regions. This land-sea difference is evidenced in both the preindus-trial and present day simulations. The present day simula-tions show a more pronounced land-sea difference, due to the higher primary aerosol emissions.
3.4.2 Zonal mean changes
The zonal mean of the aerosol-phase to total mass ratios for the same two SOA species are shown in Fig. 7. Due to the very low temperatures in the upper troposphere/lower stratosphere (above 300 hPa) most SOA species reside in
the aerosol phase. The most volatile species (BPINp2H) is mainly (>50%) present in the gas-phase at temperatures above 240 K, while the corresponding threshold temperature for the less volatile species is 285 K. Thus, the more volatile species partition mainly in the gas-phase in the whole model domain except the cold area around the tropopause and in the lower stratosphere above South Pole, while the less volatile species are mostly present in the aerosol phase. Similar re-sults are calculated for both the present and preindustrial at-mospheres and indicate that, contrary to the surface, the par-titioning of SOA species in the upper layers of the tropo-sphere is temperature-driven. In addition, at very low tem-peratures, even for the very volatile species, the partitioning to the aerosol phase becomes very high, and forces almost all SOA material to reside in the aerosol phase. For the case of the less volatile BPINp1H, the difference in the partitioning at the surface discussed in Fig. 6 is also evident in Fig. 7.
It has to be mentioned once more that the present day at-mosphere has more NOx than the preindustrial one, which causes different product yields of the parent VOC oxidation products (Presto et al., 2005; Song et al., 2005) and different product distribution, resulting in a further change in aerosol physical and optical properties.
Fig. 7. Ratio of aerosol-phase to aerosol- and gas-phase SOA species (zonal mean) for the present (left panels) and the corresponding
difference from the preindustrial (right panels) simulation for BPINp1H (top panels) and BPINp2H (bottom panels). Contours show the zonal mean temperature (K). Note the different scale between the two panels on the right.
The chemical composition of SOA itself has also been modified, mainly due to the change in the preexisting aerosol mass. SOA produced from biogenic VOC contribute to about 90% to the total SOA in the present day (Tsigaridis and Kanakidou, 2003) and are mostly found in the tropo-sphere. About 20% penetrates to the stratosphere (above 100 hPa) for the present day and 22% for the preindustrial simulation. These amounts are highly dependent on the way stratospheric-tropospheric exchanges are parameterized in the model, together with the temperature dependence on the partitioning coefficient of the SOA species. In the case of anthropogenically produced SOA (SOAa), only about 9% of their total burden is in the stratosphere. Regarding the tropo-spheric load of biogenic SOA, the model calculates that the boundary layer is enriched in SOAb since preindustrial times, since it contains nowadays 5.0% of the total SOAb burden compared to 3.8% in the past. This increase is attributed to the presence of more primary aerosol able to absorb the gas-phase SOAb species due to the enhanced emissions in the present day. Another important factor is the increase in tropospheric ozone that enhances the oxidation of the par-ent VOC to semi-volatile SOA precursor compounds in the lower atmosphere.
3.4.3 Changes in biogenic SOA chemical composition In the present work we investigated changes in the relative contribution of the different SOAb species considered here that are driven from the temporal and spatial differences in temperature, oxidant levels and amount of pre-existing aerosol. Our model is able to provide information on the changes in the VOC oxidation product distribution due to the shift from high VOC/NOx to low VOC/NOx environ-ments. The change in the relative contribution of the indi-vidual SOAb species to the total SOAb mass in the boundary layer and in the free troposphere is displayed in Table 6. This relative contribution change is calculated by:
[present contribution (%)]−[preindustrial contribution (%)] [preindustrial contribution (%)] (3) In the boundary layer, the significant increase in the primary aerosol mass favors the condensation of the most volatile SOAb species, such as BPINp2N, which has increased its rel-ative contribution to the total SOAb mass (normalized, based on Eq. 3) by more than a factor of 4, while BPINp1N has doubled its relative contribution. The corresponding species that are being produced from the oxidation of β-pinene in high VOC/NOx environments have decreased their relative contribution, due to the enrichment of NOx in the present
Table 6. Relative contribution to the total biogenic SOA mass of the various SOA species at present day and corresponding relative change
since preindustrial era, as calculated by Eq. (3).
Boundary layer Free troposphere Stratosphere
Present Change Present Change Present Change
APINp1N 4.2% 249.2% 0.5% 144.4% 0.2% 115.4% APINp2N 30.6% 397.0% 20.4% 111.1% 13.8% 94.5% APINp1H 36.2% −42.9% 5.0% −41.7% 2.2% −37.9% APINp2H 9.2% −35.5% 8.9% −47.7% 6.2% −47.6% BPINp1N 0.7% 114.2% 0.0% 37.7% 0.0% 7.9% BPINp2N 12.7% 430.8% 51.3% 32.7% 61.7% 28.3% BPINp1H 3.9% −51.7% 0.2% −46.1% 0.0% −37.8% BPINp2H 2.6% −39.6% 13.7% −46.4% 15.9% −45.8% North America 0.0 0.2 0.4 0.6 0.8 1.0 1.2 1.4 0.0 0.2 0.4 0.6 0.8 1.0 1.2 1.4 Measurements Mod el South America 0.0 0.2 0.4 0.6 0.8 1.0 1.2 1.4 0.0 0.2 0.4 0.6 0.8 1.0 1.2 1.4 Measurements Mod el Europe 0.0 0.2 0.4 0.6 0.8 1.0 1.2 1.4 0.0 0.2 0.4 0.6 0.8 1.0 1.2 1.4 Measurements Mod el Africa 0.0 0.2 0.4 0.6 0.8 1.0 1.2 1.4 0.0 0.2 0.4 0.6 0.8 1.0 1.2 1.4 Measurements Mod el Asia 0.0 0.2 0.4 0.6 0.8 1.0 1.2 1.4 0.0 0.2 0.4 0.6 0.8 1.0 1.2 1.4 Measurements Mod el Oceania 0.0 0.2 0.4 0.6 0.8 1.0 1.2 1.4 0.0 0.2 0.4 0.6 0.8 1.0 1.2 1.4 Measurements Mod el Atlantic Ocean 0.0 0.2 0.4 0.6 0.8 1.0 1.2 1.4 0.0 0.2 0.4 0.6 0.8 1.0 1.2 1.4 Measurements Mod el Pacific Ocean 0.0 0.2 0.4 0.6 0.8 1.0 1.2 1.4 0.0 0.2 0.4 0.6 0.8 1.0 1.2 1.4 Measurements Mod el
Fig. 8. AOD results vs. measurements (500nm) from the AERONET network (http://aeronet.gsfc.nasa.gov) separated by region. The solid
line denotes the 1:1 ratio and the dotted lines the 1:2 and 2:1 ratios, respectively.
day atmosphere that makes their chemical formation path-way less favorable.
In the free troposphere, the medium-volatility SOAb species APINp1N and APINp2N, have more than doubled their relative contribution, while that of the other SOAb species has changed by less than 50% on an annual basis. Like in the free troposphere, the species produced in low VOC/NOx environments are favored against the ones pro-duced in high VOC/NOxenvironments due to the change in oxidant levels, which affects the product distribution of bio-genic VOC oxidation.
3.5 Aerosol optical depth
AOD calculations are based on wet aerosol mass concentra-tions, size resolved specific extinction coefficients for sea-salt are based on Shettle and Fenn (1979), for dust on Pat-terson (1981) and on Volz (1973), while for the rest of the aerosol components the specific extinction coefficients are shown in Table 7. The specific extinction coefficients are corrected for the effect of relative humidity as explained in Sect. 2.1. This has to be viewed as the upper limit for the water effect on aerosols and AOD, since hydrophilic car-bonaceous aerosols are expected to be less hydrophilic than sulfate. The lower limit of this effect is calculated by the assumption that only sulfate and nitrate extinction coeffi-cients are affected by water uptake. The resulting AOD is
Table 7. Specific extinction coefficients used in the AOD calculations. Ammonium aerosol contribution is included to that of sulfate and
nitrate.
Aerosol component B(m2g−1) Reference
SO=4 5 Jeuken et al. (2001)
NO−3 5 Jeuken et al. (2001)
BC 9 Liousse et al. (1996); Tegen et al. (1997)
POA 4 Liousse et al. (1996)
SOA 4 Liousse et al. (1996)
0% 20% 40% 60% 80% 100%
Present Preindustrial
Sulfate Nitrate POA BC SOA Sea-salt Dust
Fig. 9. Contribution to the total aerosol optical depth for each one of the aerosol species (annual global mean) for the preindustrial (top; AOD
0.084) and present (bottom; AOD 0.102) atmospheres. Ammonium aerosol is included in the nss-sulfate and nitrate contribution.
calculated to be 20% lower than the base case where all hy-drophilic aerosols are treated like sulfate, pointing out that the error introduced by that assumption is lower than 20%.
The global mean Aerosol Optical Depth (AOD) at 550 nm calculated by the model increased from 0.084 in the prein-dustrial atmosphere to 0.102 nowadays, a value smaller than the satellite measurements, mainly due to the underestima-tion of some aerosol components burden (Sect. 3.2). On av-erage, the model tends to underestimate the AERONET net-work observations by about 10% (Fig. 8). There is a general trend on underestimating the AOD measurements, with the exception of Africa, where a general overestimation is cal-culated. The overestimation in the AOD calculations over Africa, mostly attributed to dust load, can explain the high global annual mean percent contribution of dust to the AOD (Fig. 9), for both the preindustrial and present atmospheres. The contribution of each species has changed since preindus-trial times, with the most important change being the more than doubling of the nss-sulfate, nitrate, and BC contribu-tions to the AOD, resulting from an increase of their sources and thus their atmospheric load. The POA contribution to the AOD has increased by 86%. The increase in BC con-tribution by a factor of 2.7 is higher than that of POA due to BC lower solubility (reflected by the insoluble/soluble ra-tio in the emitted amounts compared to that of POA), which results in relatively less effective removal and thus higher burden (and higher AOD) compared to that of POA during the present day. Since sea-salt and dust have equal burdens during the present and preindustrial simulations, their
rela-tive contribution to the total AOD has decreased nowadays by about 15% due to the increase of the other aerosol com-ponents. The SOA burden increases at the present day, but not so notably as the mainly anthropogenic aerosols. There-fore, SOA relative contribution to the total AOD is only 11% higher nowadays.
The percent contribution of the various components to the AOD per continent is shown in Fig. 10 both for the present and preindustrial atmospheres. As expected, the strongest changes have occurred over the most industrialized conti-nents, namely North America, Europe and Asia. The an-thropogenic emissions of SO2 and NOx have enhanced the nss-sulfate and nitrate aerosols, resulting in higher contribu-tion to the AOD. In areas with strong deforestacontribu-tion, namely North and South America, Africa, and Indonesia – Oceania, the increase in the relative contribution of primary carbona-ceous aerosols to the total AOD is also important.
4 Conclusions
The anthropogenic aerosol burden in the atmosphere has in-creased since preindustrial times by more than a factor of two for most anthropogenic aerosol species due to the increase in the emissions from human activities. In addition, the rela-tive contribution of each one of the aerosol components has changed. Since preindustrial times black carbon, nss-sulfate and nitrate aerosols have increased their atmospheric load by a factor of 3.3, 2.6 and 2.7, respectively. This change is
Europe 0% 10% 20% 30% 40%
SO4 NO3 POA BC SOA SS Dust
Present Preindustrial 57% 80% N. America 0% 10% 20% 30% 40%
SO4 NO3 POA BC SOA SS Dust
Present Preindustrial 53% 67% S. America 0% 10% 20% 30% 40%
SO4 NO3 POA BC SOA SS Dust
Present Preindustrial 54% 62% Asia 0% 10% 20% 30% 40%
SO4 NO3 POA BC SOA SS Dust
Present Preindustrial 60% 79% Africa 0% 10% 20% 30% 40%
SO4 NO3 POA BC SOA SS Dust
Present Preindustrial
77% 86% Indonesia and Oceania
0% 10% 20% 30% 40%
SO4 NO3 POA BC SOA SS Dust
Present Preindustrial
Fig. 10. Map: Continental box regions definition for the AOD comparison. The African box overlaps with the European and the Asian ones.
Charts: Relative percentage contribution of aerosol components per continent for the present and preindustrial atmospheres. The effect of water is included to each one of the aerosol components. The continental mean AOD values for the present and preindustrial simulations respectively are: Europe: 0.204, 0.146; N. America: 0.092, 0.074; S. America: 0.099, 0.087; Asia: 0.179, 0.136; Africa: 0.311, 0.279; Indonesia and Oceania: 0.071, 0.060. SS means sea-salt.
accompanied by 34–42% faster conversion of hydrophobic to hydrophilic carbonaceous aerosol, attributed to the tropo-spheric O3increase. Organic aerosols have increased their atmospheric load by 65%. Due to the increase in inorganic
salts, aerosol associated water has also increased. Interest-ingly, the increase in emissions of inorganic aerosol precur-sors SO2, NH3 and NOx since the preindustrial period of about a factor of 30, 6 and 5, respectively, is much larger
than the corresponding aerosol burden increase of nss-sulfate (factor of 2.6), ammonium (factor of 2.9) and nitrate (factor of 2.7), reflecting a non-linear atmospheric response.
Due to the change in the abundance of primary particles in the atmosphere, the semi-volatile species that form SOA con-dense to the aerosol phase easier at present time, increasing the boundary layer load of SOA to the total particulate mass faster than in the free troposphere and the lower stratosphere. The present-day added primary particles also favor the con-densation of more volatile species in the boundary layer, at the expense of formation in the upper troposphere. In areas with high preexisting aerosol loads, the amount of aerosol is the most important parameter that controls whether the SOA species resides in the gas or the aerosol phase, while at low pre-existing aerosol concentrations the most impor-tant parameter is temperature. The first case is applicable close to the surface over continental areas while the second applies to the upper layers of the atmosphere and the South Pole. The most volatile SOA species tend to condense and accumulate in the upper layers of the troposphere where the temperatures are very low and removal is slow, while the non volatile species concentrate close to the surface since they are not able to reach the upper model layers, due to condensation on preexisting aerosol and subsequent removal by wet deposition. Additionally, due to the change in the atmospheric chemical composition, SOA species formed in low VOC/NOxratio regions contribute globally by 72% to the total SOA mass at present day compared to 48% dur-ing the preindustrial period (50% and 7% in the boundary layer, respectively). This is important for aerosol proper-ties, since the compounds present on SOA which are formed in different VOC/NOx regions are expected to have dif-ferent physicochemical characteristics, like solubility, hy-grophilic/hygrophobic behavior, CCN activity etc, and thus different climatic impacts.
Significant regional changes in aerosol composition have occurred since preindustrial period, reflecting the industri-alization in the north hemisphere and the intensive defor-estation and biomass burning in the tropics. The changes in aerosol composition alter the water associated to aerosols together with their physicochemical and optical properties, which will in turn affect the condensation nuclei and cloud condensation nuclei properties of aerosols themselves. Parti-cles have become more hydrophilic and their chemical com-position change has altered their potential impact on climate. This involves both the direct effect, due to changes in the optical properties of aerosols, and the indirect effect, due to changes in the cloud properties and precipitation rates. To evaluate these changes additional knowledge is needed on the hygroscopic and optical properties of mixed atmospheric aerosols and their interactions with gaseous compounds.
If we account for all carbonaceous and inorganic aerosols and the aerosol associated water, the aerosol optical depth (AOD) has increased by 21% since preindustrial times. Black carbon and primary organic carbon have increased
their contribution to the total AOD by a factor of 2.7 and 1.9, respectively, nss-sulfate by a factor of 2.2, nitrate by a factor of 2.4 while the SOA contribution has increased by 11%. Excluding dust and sea-salt, sulfate has the highest AOD contribution in both simulations except the preindus-trial second half of the year (July to December) when SOA dominates. We assume that dust and sea-salt loads have not changed since preindustrial times, but due to the increase of other aerosol constituents their contribution to the AOD is about 15% lower.
Acknowledgements. This work has been supported by European
Social Funds and Greek National Resources EPEAEK II – PYTHAGORAS grant.
Edited by: U. Lohmann
References
Adams, P. J., Seinfeld, J. H., Koch, D., Mickley, L., and Jacob, D.: General circulation model assessment of direct radiative forcing by the sulfate-nitrate-ammonium-water inorganic aerosol sys-tem, J. Geophys. Res., 106, 1097–1111, 2001.
Anfossi, D., Sandroni, S., and Viarengo, S.: Tropospheric ozone in the nineteenth century: the Moncalieri series, J. Geophys. Res., 96, 17 349–17 353, 1991.
Barth, M. C., Rasch, P. J., Kiehl, J. T., Benkovitz, C. M., and Schwartz, S. E.: Sulfur chemistry in the National Center for At-mospheric Research Community Climate Model: Description, evaluation, features, and sensitivity to aqueous chemistry, J. Geo-phys. Res., 105, 1387–1415, 2000.
Boucher, O. and Pham, M.: History of sulfate aerosol radiative forcings, Geophys. Res. Lett., 29, 1308, doi:10.1029/2001GL014048, 2002.
Chin, M., Rood, R. B., Lin, S.-J., M¨uller, J.-F., and Thompson, A. M.: Atmospheric sulfur cycle simulated in the global model GOCART: Model description and global properties, J. Geophys. Res., 105, 24 671–24 687, 2000.
Chuang, C. C., Penner, J. E., Prospero, J. M., Grant, K. E., Rau, G. H., and Kawamoto, K.: Cloud susceptibility and the first aerosol indirect forcing: sensitivity to black car-bon and aerosol concentrations, J. Geophys. Res., 107, 4564, doi:10.1029/2000JD000215, 2002.
Chung, S. and Seinfeld, J. H.: Global distribution and climate forcing of carbonaceous aerosols, J. Geophys. Res., 107, 4407, doi:10.1029/2001JD001397, 2002.
Claeys, M., Wang, W., Ion, A. C., Kourtchev, I., Gelencs´er, A., and Maenhaut, W.: Formation of secondary organic aerosols from isoprene and its gas-phase oxidation products through reaction with hydrogen peroxide, Atmos. Environ., 38, 4093–4098, 2004. Cooke, W. F. and Wilson, J. J. N.: A global black carbon aerosol
model, J. Geophys. Res., 101, 19 395–19 409, 1996.
Dentener, F. J., Feichter, J., and Jeuken, A.: Simulation of the trans-port of Rn222using on-line and off-line global models at differ-ent horizontal resolutions: a detailed comparison with measure-ments, Tellus, 51B, 573–602, 1999.
Dentener, F., Kinne, S., Bond, T., Boucher, O., Cofala, J., Generoso, S., Ginoux, P., Gong, S., Hoelzemann, J. J., Ito, A., Marelli, L.,