HAL Id: halshs-02008937
https://halshs.archives-ouvertes.fr/halshs-02008937
Submitted on 6 Feb 2019
HAL is a multi-disciplinary open access
archive for the deposit and dissemination of
sci-entific research documents, whether they are
pub-lished or not. The documents may come from
teaching and research institutions in France or
abroad, or from public or private research centers.
L’archive ouverte pluridisciplinaire HAL, est
destinée au dépôt et à la diffusion de documents
scientifiques de niveau recherche, publiés ou non,
émanant des établissements d’enseignement et de
recherche français ou étrangers, des laboratoires
publics ou privés.
China
Liubing Xie, Elfie Swerts, Denise Pumain
To cite this version:
Liubing Xie, Elfie Swerts, Denise Pumain. Economic Development Zones and Urban Growth in China.
Cybergeo : Revue européenne de géographie / European journal of geography, UMR 8504
Géographie-cités, 2018, �10.4000/cybergeo.30143�. �halshs-02008937�
Economic Development Zones and Urban Growth
in China
Zones de Développement Economique et croissance urbaine en Chine
Liubing Xie, Elfie Swerts and Denise Pumain
Electronic version URL: http://journals.openedition.org/cybergeo/30143 DOI: 10.4000/cybergeo.30143 ISSN: 1278-3366 Publisher UMR 8504 Géographie-cités
Brought to you by Centre national de la recherche scientifique (CNRS)
Electronic reference
Liubing Xie, Elfie Swerts and Denise Pumain, « Economic Development Zones and Urban Growth in China », Cybergeo : European Journal of Geography [Online], Space, Society,Territory, document 880, Online since 21 December 2018, connection on 06 February 2019. URL : http://
journals.openedition.org/cybergeo/30143 ; DOI : 10.4000/cybergeo.30143 This text was automatically generated on 6 February 2019.
Economic Development Zones and
Urban Growth in China
Zones de Développement Economique et croissance urbaine en Chine
Liubing Xie, Elfie Swerts and Denise Pumain
Introduction
1 China’s urbanization process of the last decades is often quoted for its most specific
feature that is a planned urban growth coupled with a planned economic development, translated in a multiplication of Economic Development Zones (EDZ) (Wu and Ma, 2006; Chan, 2010; Wu, 2016; Swerts 2013; Swerts, Liao 2018). Although not unique in the world, this planned development is remarkable by its amplitude (more than 3000 EDZ are enumerated in 2018) and its effectiveness, since between 1978 and 2018 China’s urbanization rate shifted from 40% to more than 60%. We shall review below the renewed adjustments of the policies that have accompanied this rapid urban transition. Two major ambitions were assigned to these planning policies: at local scale, the stated objective was to generate a ripple effect on adjacent areas (Chen, 1995; Chen and Jameson 2012; Pak, Park, 1997; Ge, 1999;); at national scale, the evolution of development policies through EDZ was a diffusion of economic development toward the Western provinces and from large to medium size cities.
2 Many papers have discussed the effectiveness and sustainability of such policies that
were recommended and applied especially in emerging countries, and not always meeting expectations (Castells Hall, 1994; Rodrigues-Pose, 2014). As early as in 1970s, Free trade or Special Economic Zones are recommended by United Nations Industrial Development Organisation (UNIDO) for helping less advanced countries to develop their economic production while opening to foreign investment. Dedicated infrastructures, administrative support and special regimes of taxes enhance the major comparative advantage of these countries which is cheap labor costs and entail a new international division of labor (Aydalot, 1976). Although investments may not always be successful, the economic assessments of the global balance are positive, as stated in many reports
(Akinci and Crittle, 2008) and in China as well (Zeng, 2010 and 2011). Wang (2012), exploiting a Chinese municipal dataset, and comparing the changes between the municipalities that created a SEZ in earlier rounds and those in later waves, concludes that the SEZ program increases foreign direct investment not merely through firm relocation and does not crowd out domestic investment. With dense investment in the targeted municipality the SEZ generates wage increases for workers more than the increase in the local cost of living, but the effects are heterogeneous: zones created later have smaller benefits and municipalities with multiple SEZs experience larger effects than those with only one SEZ. Zeng (2011) edited the 260-page report “Building Engines for Growth and Competitiveness in China” for the World Bank. It assesses the leading role of Special Economic Zones and Industrial Clusters in China’s economic development. Using various development zones as case studies, Zeng argues that the economic success has relied on various factors such as strong commitment from the top leadership, a gradualist approach, proper role of the government, FDIs and the diaspora as well as technology innovation and adaptation.
3 In the early 1990s a turn in claimed objectives from economic development and
international competitiveness towards sustainable development is engineered by international organizations (UNCTAD, 2015): “strategies should promote competitiveness through enabling efficient performance on all issues that matter to business success, including economic, social and environmental issues, rather than exempting zones from their own national laws on labor practices or the environment”. However, fifteen years later, the report observes the failure of this bending in EPZ policies: having identified some 4000 Export Processing Zones in the world and providing a detailed analysis for a hundred of them, including 10 in China, it regrets that “most EPZs are not yet promoting environmental and social features”, but acknowledges that in China those located “in ‘low carbon cities’ provide environmental services including the development of alternative sources of energy, enhanced waste management systems, grey water recycling and recycling systems connected to a circular economy logic”. Indeed, the Chinese concept of “Eco-industrial park” may represent an advance in this direction and even includes an international certification of sustainability practices coined in the ISO 14001 standard (Shi, H. et al, 2012). However, detailed local surveys of the efficiency of EPZ for urban sustainability are more critical and have recommended a necessary shift in the management of these zones, whose success in boosting urban growth also generates problems in “land resources allocation, environmental deterioration, and provision of social security and welfare” (Wong and Tang, 2005, p. 314). Scrutinizing the behavior of local actors, whose political advancement has become linked with the economic performance of their district, municipality or province, new practices are developed to provide space to economic development: either the state supplies land to listed companies, or developers buy collectively owned rural land, or an urban status is given to a rural administration “thus changing rural collectively owned land into state land” (Wu, 2009). In this process, urban development becomes less strictly linked with Economic Development Zones and may also rely more on residential investment or real estate speculation (Aveline-Dubach, 2016). Under local governments’ strong incentive to expand, urban built areas in China almost doubled from 1996 to 2000 (Ye & Wu 2014).
4 This process is complex because it involves many causal entanglements between
incentives from the State, local initiatives, financial investment, real estate and building, employment and population growth. Without possibly disentangling the causality chains,
our limited objective is to measure to what extent there is a statistical correlation between investment in Economic Development Zones and urban demographic growth. The originality of the paper is to observe that relationship at two disaggregated geographical levels, districts and urban agglomerations, merging two new data bases that were collected by two of the authors. This enables the cover of all of China over the 1983-2013 period, whereas most of studies are based on much smaller number of observations and shorter time periods.
5 We shall at first review the ambition of the policies and their evolution (section 1: EDZ as
a tool of urban development in China). In a second step we explain how we have collected and merged the original data (section 2: Collecting and assembling two data bases). In a third step we characterize the spatial distribution of EDZ and its evolution (section 3: Are EDZ going to the West and down the urban hierarchy?). Eventually, we measure to what extent the major ambitions of policies regarding a diffusion of economic development toward the Western provinces and from large to medium size cities became or not a reality (section 4: A two-level analysis of the relationship between EDZ and urban growth).
EDZ as a tool of urban development in China
6 The EDZ that were implemented in China are narrowly dependent on the evolution of
national policies for economic development and urbanization. They have received different names and were assigned distinct objectives according to their period of creation and location, the decision to open them may also stem from different levels of Chinese administration. The creations have accelerated during the 1990s, and by the end of 2003 the number of local ‘development zones’ or ‘industrial development districts’ had reached 3837. Among them, only 6% (232) were approved by the national government and 26.6% (1019) were approved by the provincial governments. Although the major development zones are approved by the central or provincial governments, most of the development zones are administered solely by municipal governments. By the end of 2006, the number of industrial development zones had grown to 6015 (Xie, 2018, p.4).
Evolution of EDZ policies
7 As many state policies in China, the creation of Economic Development Zones is a gradual
policy: experimentation is made in a few places before being generalized if successful. Some cities were granted special status by the Chinese Government in the late 1970s, as part of the reform of the economic system initiated to open up to the world an economy that had long remained closed in on itself. A first set of economic zones, open to foreign companies and investments, enjoyed certain privileges over other regions, such as a reduced rate of taxation on profits and advantages in material and infrastructure terms. The stated objective was to generate a ripple effect on adjacent areas (Chen et al., 1995; Howell and Yusuf, 1996; Pak, 1997; Ge, 1999; Minxin and Pei, 2009). Thus, in the late 1970s and early 1980s, the first four SEZs (Shenzhen, Zhuhai and Shantou in Guangdong, and Xiamen in Fujian) were established (Liang, 1999). Till 1993, these 5 SEZs have installed 9300 foreign-invested enterprises and utilized FDI 3.9 million dollars.
8 In 1986, the Chinese government announced the “High technology Research and
two plans fostered the establishment of a new type of Economic Development Zone, i.e. National High-tech Industrial Development Zone. For example, the Beijing High-tech Industrial Development Zone and the Shanghai Caohejing High-tech Industrial Development Zone were established in 1988 as well as all of Hainan, the Pudong area in Shanghai then followed in 1990 (Broadman and Sun, 1997; Yeung et al., 2009). To complete this system, 14 so-called "open coastal cities" were established in 1984 (Dalian, Qinhuangdao, Tianjin, Yantai, Qingdao, Lianyungang, Nantong, Shanghai, Ningbo, Wenzhou, Fuzhou, Guangzhou, Zhanjiang and Beihai); these open coastal cities have developed "Economic and Technological Development Zones" (ETDZ) that are more oriented towards the modernization of the Chinese industrial fabric (Pak, 1997). In parallel, the Yangtze and Pearl River deltas, the Xiamen-Zhangzhou-Quanzhou triangle in Fujian, the Shandong and Liaodong peninsulas, Hebei and Guangxi have been successively transformed, since 1985, into Open Economic Zones, thus forming a coastal strip open to the globalized economy (Bell and N'Guiamba, 1993; Perkins, 1994; Pak, 1997; Démurger et al., 2002). This first series of policies were clearly linked to the rising role of China as the manufacturing factory of the world. The selected areas are close to exporting infrastructures of maritime harbors. They also are close to the major urban areas and already more economically developed parts of China.
9 At the time of the reform of housing system and land use regulation from 1978 to 1991,
the land became rapidly commoditized and the real estate sector was fledging. Accompanied with the over-heated real estate market in 1992 and 1993, a “fever” for EDZ development overtook all of China with the bourgeoning of over 300 provincial- and national- level EDZs (Gu and Zhao, 1998). Finally, since 1992, fourteen border economic cooperation zones, grouping together border towns in the interior of the country, have completed the Chinese government's economic opening mechanism. They have established 15 free trade zones, 47 national economic and technical zones and 53 high and new technology zones in large and medium-sized cities (Chen, 1995; Fu and Gao, 2007).
Types of EDZ
10 The different types of economic development zones were assigned different goals by
Chinese authorities. Economic and Technological Development Zones (ETDZ) were established to stimulate economic development and industrial output, they are highly dependent on FDIs and their economic activities are mainly manufacturing industries. ETDZs are designed by the Chinese Government to be both the showcases and the foundation for the economic opening of the country and the development of Chinese innovative industry. They would also be a powerful engine of the regional economy. Fourteen Economic and Technological Development Zones (ETDZs) were established from the end of 1984 until 1988, then forty new ones between 1992 and 1993 and between 2000 and 2002. ETDZs are located only in open cities (Special Economic Zones SEZs). They benefit both from Chinese investments and foreign funds dedicated to the development of the high-tech industry, mainly oriented towards exports. The primary goal of High-tech Industrial Development Zones (HIDZs) is to facilitate the innovation and development of high-tech industries by attracting foreign and domestic high-tech companies, thus upgrading the technological level of Chinese economy. Fifty-three High-Tech Industrial Development Zones (HIDZ) were dedicated to the development of Chinese scientific research and its application through the development of a high-tech industry.
Through the promotion of incubators, accelerators, and other entrepreneurial platform, HIDZs provide strong support to technology entrepreneurs (Xie et al., 2018).
11 The main activity of Export processing zones (EPZs) is fabricating, processing and
assembling the export-oriented goods, they are normally located near the ports or national borders. Fifteen Free Trade Zones (FTZs) have been created since the 1990s. They specialize in activities related to foreign investment and international trade, as well as storage and customs activities. Bounded Areas (BAs) are established for the storage, processing and trade of export-oriented goods, they are often established near the ports or airports (Sun 2016). Fourteen Border and Economic Cooperation Zones (BECZs) have been created since 1992 to develop cross-border trade in the North and West of China and thus develop the economies of minority regions. In order to attract companies to the designated zones, governments provide facilities and favorable policies such as tax deduction and cheaper land leasing fees.
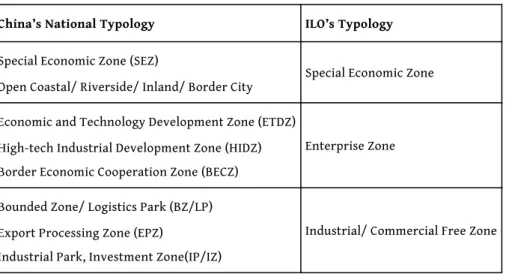
12 Fu and Gao (2007) have compared the Chinese typology with the typology by the
International Labor Organization (ILO), that is more internationally comparable (table 1). The typology of ILO classifies manufacture related EPZs into three main types, Special Economic Zones, Industrial Free Zone and Enterprise Zones. The latter two, including other services related to EPZs, are all called “Development Zones” in China. According to Fu and Gao, Special Economic Zones and Open Coastal Cities in Chinese typology correspond to Special Economic Zones in ILO’s Typology. As the main concern of our research is about China, we have collected information about date and creation of EDZ in distinguishing between: Economic and Technology Development Zones (ETDZ), High-tech Industrial Development Zones (HIDZs) and Border Economic Cooperation Zone (BECZ), which correspond to Enterprise Zones in ILO’s typology; and Bounded Zones; and Bounded Zones/Logistics Park (BZ/BLZ), Export Processing Zone (EPZ), and Industrial Park/Investment Zones (IP/IZ), which correspond to Industrial/Commercial Zone in ILO’s typology.
Table 1. Chinese and international nomenclatures of EDZ
China’s National Typology ILO’s Typology
Special Economic Zone (SEZ)
Open Coastal/ Riverside/ Inland/ Border City Special Economic Zone Economic and Technology Development Zone (ETDZ)
High-tech Industrial Development Zone (HIDZ) Border Economic Cooperation Zone (BECZ)
Enterprise Zone
Bounded Zone/ Logistics Park (BZ/LP) Export Processing Zone (EPZ)
Industrial Park, Investment Zone(IP/IZ)
About the location and management of EDZ
13 EDZs have a full range of administrative and geographical implementations. They can be
large areas, either entire provinces or much smaller areas, such as Coastal Development Zones. They can also be cities, like Shenzhen, or provincial capitals. The creation of the Economic Development Zone instituted, within “open” cities (or Special Economic Zones SEZ), areas benefiting from material and immaterial infrastructures advantageous for their industrial and economic development. Most often, these are city districts either specifically created or converted to become an EDZ. A city may combine several types of EDZs, while being itself an SEZ or located in a special economic region or province.
14 Another source of differentiation among EDZ is about their territorial status: depending
of it being national, provincial or municipal different regulations are applied. The national level EDZs are approved by State Council and they enjoy favourable policy from “National Economic and Technological Development Zone Policy”. They are supervised and managed by the State Development and Reform Commission, the Ministry of Commerce, the Ministry of Land and Resources and the Chinese Development Zones Association. The provincial and municipal EDZs are respectively approved by provincial and municipal authorities.
15 As development zones have been established by all level of governments from district/
county level to national level, thousands of development zones have emerged in the last several decades. According to Zhai and Xiang (2007), by the end of 2003 the number of local ‘development zones’ or ‘industrial development districts’ had reached 3837.
Collecting and assembling two data bases
16 Our research combines information from two original data bases that were collected by
authors, one on Chinese Economic Development Zones by Liubing Xie, one on Chinese districts and urban agglomerations by Elfie Swerts (2013 and 2017).
An original database on Chinese Economic Development Zones
17 We have built a database on major development zones across China, that were selected
according to the importance of the administrative level where they were decided, their size, their economic performance and the continuity of their investment. Detailed information about their attributes (see below) was also required but not always completely available. The data were extracted from three sources: a series of reports from China Knowledge research reports (2012-2014), the official website of the Ministry of Commerce of China1, and the official websites of the development zones2. We collected
information about development zones that are in fact executed and initiated mainly by national or provincial governments. We also include a few of the municipal-level development zones that are listed in the reports by China Knowledge because of their outstanding economic performance.
18 With a range of different zones existing in the same district/city, sometimes overlapping
between different zones happen; in some cases, one zone can incorporate some other zones in the same jurisdiction. It is also possible that the same zone may have different names of different categories. For example, many Economic Development Zones
incorporate an Export Processing Zone and/or a Bounded Zone. When several zones share the same administration the statistics of the big zone may also include the statistics of the smaller zones in its jurisdiction. Therefore, it is always difficult to register the exact number of zones in one district and categorize them. This dataset tries to keep the data precise and simple, therefore, one zone is registered only once, and the incorporated small zones are not registered twice.
19 The total number of development zones in the dataset amounts to 348. Compared to the
estimated total number of EDZs in the country, the size of our sample may appear limited. However, it is much larger than any of those that were until now used for comparative studies (hundreds versus less than a dozen usually). Moreover, our sample enables a geographical analysis at national level. Each zone is located in the exact district/county where it is established. Earlier researchers have mostly studied development zones at the scale of provinces or official cities, it is an innovative approach to go one step further to locate the zones in the exact districts and counties they belong to. The exact location of the zones in the county-level administrative units enables to assess whether the urban growth poles at district level match the establishment location of development zones.
20 Many other features of the development zones were collected as well, including year of
establishment, year of upgrading, level of decision, surface, economic index (including Gross Domestic Production, Gross Industrial Output, Foreign Direct Investment), major industries.
21 The year of establishment is the year when the zone starts operating or if the sources only
mentioned it the year of decision. The level of decision is the administrative level where the decision of establishing or upgrading a certain zone is made, and this level corresponds to the status of the zone. There are three levels concerned: national, provincial, and municipal. For the direct-controlled municipalities (Beijing, Shanghai, Tianjin, Chongqing), they are administratively at the same level as a province, however, for in order not to further confuse the readers, the EDZs that locate at these four municipalities are still noted as “municipal” level.
22 The surface of the development zones is registered as well. In some cases, the zone
underwent an upgrading of status, and the same time received an extension of surface. We have collected the year of upgrading, and the subsequent expansion of surface if the information was available.
23 The major industrial activities that are involved in the zones are collected and compared
with the nomenclature of the UN system of classification of economic activities: the Global Industry Classification Standard (GICS). Combining the two systems, 14 industrial sectors are classified and recorded in the dataset: information technology, machinery and equipment manufacturing, materials, pharmaceutical products, logistics, textiles and other light industries, motor vehicles manufacturing, chemicals, food and beverages, energy, mineral processing, wholesale and retail trade, service activities, and aeronautics and astronautics.
24 The dataset has the advantages of being precise and comprehensive and it can be reused
by other researchers for further investigation. However, the dataset has some limitations. The data is collected from three sources: a series of reports from China Knowledge, the official website of the Ministry of Commerce of China, and the official websites of the development zones. Although each source is reliable for academic research, they have different preference for the kinds of data they gather, and they may have different
measurement for the same data as well. Therefore, comparing the data can be difficult in some cases. For example, the surface of the zones is sometimes noted as a planned surface and other times as a built surface, sometimes the sources give only the administrative surface of the zones. Another limitation concerns the year of establishment and the year of upgrading, as not all sources noted the process of upgrading, and less about the expansion of the surface, therefore we might underestimate the number of zones that underwent upgrading and expansion.
An original database on Chinese cities
25 Data source on demographic and socio-economic population was collected at district level
from the 1982, 1990, 2000 and 2010 Chinese Censuses. As no official source is yet available in China for measuring urban growth at a disaggregated geographical level in a way that would ensure a good comparability with other countries, E. Swerts (2013 and 2017) has built the Chinacities data base on the concept of urban agglomerations that were delineated according to international standard.
26 The ChinaCities database was built in four steps:
1. In a first step, the continuous urban built up area separated by less than 200 meters was delineated using Google Earth images from the year 2000 with a resolution of 7,000 feet (~ 2,134 m). This step was carried out within the framework of a Master project (Swerts, 2009) and the project e-Geopolis (http://www.agence-nationale-recherche.fr/?Projet=ANR-07-CORP-0019).
2. This perimeter was georeferenced and integrated in a Geographic Information System (GIS) and adjusted to entire district level units3 where the urban zone was dominant, whatever
their urban/rural type (Qu/urban districts, Xian/rural counties and Xianjishi/district level cities).
3. Because some rural areas can be very dense, both in terms of population and urban buildings, the number of urban units could be overestimated, some “morphological
agglomerations” possess a workforce overwhelmingly engaged in primary sector activities
(agriculture, forestry and fishing). To bring a correction, an economic criterion has been added that refines the urban character of these observed morphological settlements. It excludes from the database all morphological settlements located in agricultural counties. This was made possible by collecting the demographic and economic data from official censuses of 1982, 1990, 2000 and 2010 at district level and associating these data to the zones defined from the continuous urban built area perimeters.
4. In a fourth step, when the population of the small district level cities could be over-estimated and too large to be entirely contained in the agglomeration, the smaller town’s level units (Zhen/towns and Xiang/villages) were used to more precisely delineate the agglomeration’s perimeter. The data on Zhen were available for 2000 and 2010 but not for previous periods. As a consequence, the urban areas are defined with more precision in 2000 and 2010. For years 1982 and 1990, the delineation of the agglomerations remains constrained by the limits of the counties. Therefore, the population of urban agglomerations located in a county whose boundaries are much more extended that those of its built up area were excluded from the data base. In order to avoid any ambiguity, we name this part of the
ChinaCitiesDatabase “ChinaCitiesDatabase adapted to counties”.
27 The ChinaCities database contains 9,525 cities with their population in 2010 and 2000. This
is a large number compared to the 657 “cities” that are officially defined by the Chinese government. Our definition enables better international comparisons because it includes
many smaller towns that do not have the status of “city” in China (Swerts, 2013, Pumain et al., 2015, Cura et al., 2017).
Crossing information at district and urban agglomeration levels with
GIS
28 Information about EDZ was collected in a file at district level ensuring consistency and
enabling its geolocation and comparison with data on populations from the Chinacities data base. There are 2877 county level units in 2000 and 2874 in 2010. The computation of urban growth at district level requires overcoming the changes in their administrative delineation between the two dates: changes include upgrading counties to be urban districts, merging two or multiple districts, or splitting one district between two or multiple districts, and even more complex combination of splitting and merging of multiple districts. We adjusted the dataset of 2000 by matching the districts that had changed their names, adding up figures for the districts that have been merged, while deleting those having been split and the ones involving too complicated changing of boundaries. In the end, 2685 district-level units of the two datasets have been preserved. Except for very few sporadic omissions in some provinces, the data for several provinces/ cities are especially problematic due to too big changes of administrative boundaries, including the Guangxi Autonomous Region, Ningxia Autonomous Region, Haixi of Qinghai province, Luohe of Henan province, therefore they are obliterated from the dataset.
29 We offer two analyses of the relationship between the creation of EDZ and urban growth,
one at district level and the other at the level of urban agglomerations. For the latter, in the process of merging the two data sets, only 328 among the 348 EDZs are located in urban agglomerations. Therefore 328 EDZs are preserved in the data set, and they are located inside 255 urban agglomerations. However, a few zones, which are located in rural areas or areas with low population density for example some Tibetan cities, are left out. Moreover, as the number of urban agglomerations (9488) is much larger than the number of districts (2750), the agglomerations that are not able to match with districts are left out when merging the two data sets. However, this has minor effect on our studies of EDZs’ distribution or the effects of the establishment of EDZs.
Are EDZ going to the West and down the urban
hierarchy?
30 As the creation of EDZ in China has a clear starting date and is undoubtedly an
“innovation” that introduced an opening to foreign capital in a socialist economy, we first want to observe to which extent it follows the usual spatio-temporal pattern of innovation waves in urban systems, i.e. a hierarchical diffusion.
An innovation process with cycles
31 Over time, the creation of EDZ was by no means regular, alternating after a first period of
experimentation three or four cycles of booming and slowdown in the number of creations (figure 1).
Figure 1. Creation of EDZs over time and according to their territorial status
32 Most of development zones were established across the past three decades since the early
1990s. The earliest development zones in the dataset were established in Shanghai in 1983, and in Qinghuangdao, Suzhou, Nantong, Lianyungang, Yantai, Guangzhou, Zhanjiang, Qingdao and Tianjin in 1984. With the only exception of Kunshan Industrial Park located in Suzhou, all the other 9 zones established in 1983 and 1984 are located in the Coastal Open Cities4, a series of cities that were given similar status as the earlier 5
cities of Special Economic Zones and opened to oversee investment in 1984. The “fever” for establishing development zones then spread to other cities in the following years, although it was mainly coastal cities which followed the trend in the first place, while cities in western and central China such as Wuhan, Chongqing, and Chengdu started their development zones only after 1993. There was a rapid increase of decadal amount of newly-established development zones from 1991 to 1993, respectively 18, 89, and 37 zones were established in 1991, 1992 and 1994. However, this rapidly increased fever proved to be only short-lived, because the decadal number of newly-established development zones dropped again to no more than 10 from 1994 to 1999. Another cycle of “development zone fever” appeared in 2000 and lasted till 2006, during which period the decadal newly-established zones exceeded 15 (with the exceptions of 4 in 2004 and 8 in 2005).
33 However, it is evident that the “golden age” for establishing new zones was between 1991
and 1993, although the number of newly-established zones bounced back a bit from 2000 to 2006, the total number of new zones in these years is outnumbered by the decadal figure for 1992.
A clear propagation to the West
34 It is a common belief that the eastern regions have much more EDZs than western and
middle regions. However, very few researches have thoroughly investigated the distribution between regions. Thanks to their inclusion in GIS, the EDZ were georeferenced at the barycenter of the districts and urban agglomeration where they were located, and a first map of their spatial distribution was drawn (as seen in figure 2),
according to the date of creation. Here we can test the hypothesis that after concentrating at first in the eastern part of China the EDZs development gradually diffused to the central and western regions, following the state policy. On figure 2 the EDZs are categorized into 6 groups according to their establishment year: 1983-1990, 1991-1995, 1996-2000, 2001-2005, 2006-2010, 2010-2013. The map shows that earliest zones (1983-1990) are largely located in the Open Coastal Cities and major provincial capitals, both in eastern regions and other parts of China; however, the total number of the zones is limited. The second wave of economic development grew as a real “fever” in the early 1990s, with an explosion of zones around 1992, the EDZs of this era are most likely to be located along the eastern coast. However, the newest zones, especially the ones that are established after 1995 are much more widely dispersed across the whole country.
Figure 2. Districts including at least one EDZ according to establishment year
35 As reading dot maps is not so easy, we have made a cursory demonstration of the shift to
the west of the location of EDZs by simply computing the average longitude of their districts according to the date of creation (table 2). With the only exception of the 2006-2010 period the trend is a continuous decrease of longitude, representing a westward movement of EDZ’s development.
Table 2. Average longitude of EDZs according to establishment year
EDZ in urban
agglomerations 1983-1990 1991-1995 1996-2000 2001-2005 2006-2010 2010-2013
average longitude 116.20 114.35 112.36 110.69 114.18 106.75
36 Many of the newer development zones are established in middle and western regions. For
example, Wangcheng ETDZ that is established in 2000, Ningxiang ETDZ (2002) are in the Hunan province in the middle region, and Lhasa ETDZ (2001), Xining ETDZ (2000) are respectively in the western regions of Tibet and Xinjiang. Chongqing, one of the most important city in the western region, has established 38 development zones. Among the 27 zones in Chongqing that are recorded in our dataset, 24 zones were established after 2000.
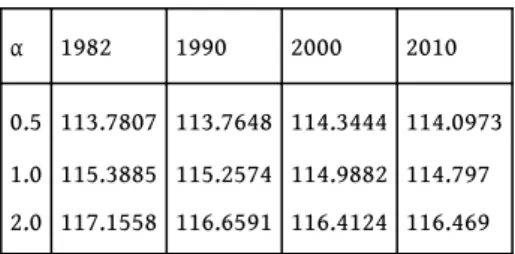
Using the ChinaCities database, some analyses that link to our result can also be performed. For the table 2 giving average longitude, the result would be more robust if adding a null model giving for example the location of synthetic EDZs if they depend on population only under a controlled form. In the simplest setting, if the probability of adding a new EDZ in a given city is proportional to a power law of its population
, then in the large number of EDZs limit, we should have a proportion of EDZs in the corresponding city and thus an expected longitude given by . Results for three values of α (from infralinear scaling when α = 0.5 to supralinear scaling for α =2) are given in table 3. In the exponents corresponding to the activities considered, we naturally observe also a shift to the West, but far lower than the one observed for EDZs in the paper, justifying the claim of an actual shift to the West, independently of population. The inverted trend for alpha = 0:5 would be interesting to investigate in terms of balancing in the urban system between small, medium-sized and large cities. Further work is possible, as a more robust null model should also take into account the actual number of EDZs in time, and simulate drawings using these. These results reinforce the feeling of trust about results of the paper5.
Table 3. Values of average longitude for synthetic systems of EDZs
α 1982 1990 2000 2010 0.5 1.0 2.0 113.7807 115.3885 117.1558 113.7648 115.2574 116.6591 114.3444 114.9882 116.4124 114.0973 114.797 116.469
High urban concentration and some evidence of hierarchical
diffusion
37 There is an obvious trend that EDZ are located in the largest urban areas of China, as
represented on table 4: only 32 EDZs are located in the 6518 agglomerations that have less than 50 thousand inhabitants. The average number of EDZ per city is regularly growing with urban size class and there is a noticeable gap isolating urban agglomerations above 10 million inhabitants as ten times more attractive locations than the other million plus cities.
Table 4. Repartition of EDZ according to size of urban agglomerations
Pop. in thousands <50 50 ~ 100 100 ~ 500 500-1000 1000 –
10 000 > 10000 total number of agglomerations 6518 1786 958 142 79 5 9488
number of EDZ 32 20 39 40 69 55 255
average nb. of EDZ per city 0.005 0.01 0.04 0.28 0.87 11
38 On figure 2 we can observe the spatial clustering of EDZs around several large regional
urban centers: the three major megalopolises along the coast, i.e. “Jing-jin-ji” (ie. Beijing-Tianjin-Hebei metropolitan area, Yangtze River Delta metropolitan area and Pearl River Delta metropolitan area concentrate most of the EDZs. However, some western and central regions, although not as dense, show evident clustering effect as well, and the total numbers of EDZs located in these areas are also considerable. These regions include Cheng-Yu Metropolitan Area (around western cities Chengdu and Chongqing), Middle Yangtze metropolitan area (around central cities Wuhan and Changsha), and Central plain metropolitan area (around Taiyuan and Zhengzhou). Some more discrete clusters appear in the western regions of Yunnan, Xinjiang, Shaanxi, Gansu-Qinghai, and coastal region of Shandong, and North-Eastern region.
39 The average population size of urban agglomeration according to establishment year does
not seem to comply with our hypothesis of hierarchical diffusion of EDZs within the Chinese urban system (Table 5). The result might be affected by the small number of zones created in some years. For example, the 34 zones that were established between 2006 and 2010 are largely located in Beijing, Tianjin, and Shanghai. The fact that the three largest cities established a number of zones at the same time might bias the result. However, when counting only the years during which large number of zones were established, a declining trend of the size of urban agglomerations where EDZs are located can be observed. This result both tends to validate the geographical theory of hierarchical diffusion of that innovation and confirms the deliberate policies intending to favor the economic development of medium size cities in China. But without more documented surveys on case studies it remains rather difficult to disentangle the interplay between endogenous creation and top-down state-led creation, even if obviously the “go-towards-west” seems strongly influenced by State policies.
Table 5. Average population size of urban agglomerations according to year of establishment
EDZ in urban
agglomerations 1983-1990 1991-1995 1996-2000 2001-2005 2006-2010 2010-2013
Number of Zones 30 149 33 64 34 13
Average population size
A two level analysis of the relationship between EDZs
and urban growth
40 As EDZs are providing advantages to certain areas for attracting foreign investment and
firms as well as supporting infrastructures, they also sometimes favor immigration from the countryside and therefore should exhibit higher growth rates of their population than the other parts of the country. However, as accompanied by the policy of unique child, the demographic transition has been very rapid and despite the growing urbanization rate, the growth of urban populations has become rather low. A figure taken from World Bank compares the population growth rate of China with India and the USA (figure 3). China’s annual population growth rate constantly decreased since 1990, from 1.2% in 1990 to 0.8% in 2000, and 0.5% in 2010. The figure of Chinese annual growth rate in 2010 is significantly lower than that of India (1.4%), even lower than that of America (0.8% ), and at the same level as France (0.5%).
Figure 3. Annual population growth rate of China compared with India and the USA
(source: World Bank)
41 To measure the impact of the installation of EDZs on population growth, or the reverse
effect of previous urban growth on attracting EDZs, is difficult because of possible time delays and spatial spill-over from the exact location of EDZs toward the neighboring urban agglomeration. Our data are covering a large part of China, but they are too coarse grained to enable a detailed analysis of the direction of causality. For the sake of simplicity, we computed urban growth rates at district and agglomeration levels, between 2000 and 2010 and compared them with the location of EDZs, whatever their date of creation.
EDZ and population growth in districts
42 At district level, there is an unsurprising but tremendous impact from the creation of
EDZs on local urban growth. Whereas the average growth rate of the population in all 2685 districts is 0.7% per year, the 277 districts having received EDZs, whatever their type, have grown much more rapidly, most of the time between 3 and 4% per year, while those having not benefitted of the investment had a slow growth of 0.5% per year. The variation of growth rates, that is usually high, is also reduced among the districts that
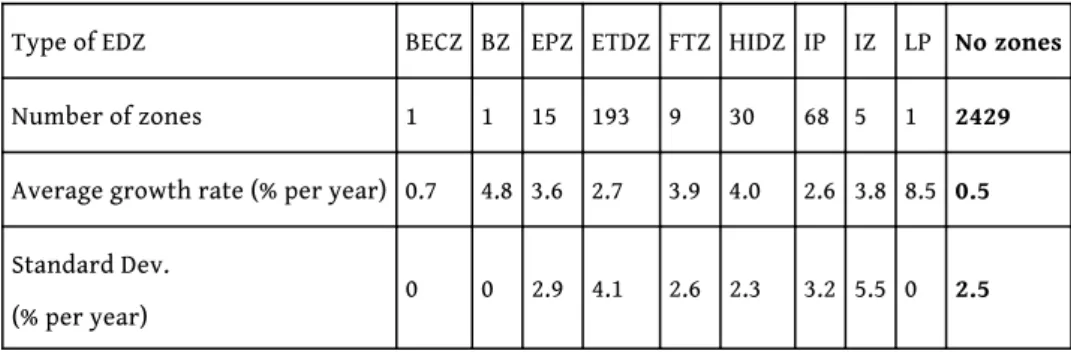
were equipped with EDZs. Moreover, the increase of urban population is growing with the number of EDZs created locally: according to a simple regression, one additional economic zone increases the annual population growth rate by 1.3%. Due to the large number of observations the correlation coefficient is statistically significant, however, its low value prevents us from detecting a clear correlation between the number of zones and growth rates (R-squared = 0.047, see annex table 1), which may be explained by the high variability of growth rates for districts having small numbers of economic development zones and the lack of information about the varying size of these districts. Table. 6 Parameters for growth rates categorized by type of EDZ
Type of EDZ BECZ BZ EPZ ETDZ FTZ HIDZ IP IZ LP No zones
Number of zones 1 1 15 193 9 30 68 5 1 2429
Average growth rate (% per year) 0.7 4.8 3.6 2.7 3.9 4.0 2.6 3.8 8.5 0.5 Standard Dev.
(% per year)
0 0 2.9 4.1 2.6 2.3 3.2 5.5 0 2.5
43 The administrative level having decided the creation of EDZs introduces smaller
variations between average growth rates of districts, with a slight advantage when they result from a national initiative (table 7). Our results also may support the “entrepreneurial local states” theory of Fitzgerald (2002) that the municipal governments have more substantive power to launch projects such as industrial zones, as they have direct control over land resources which is essential for financing EDZs development, while provincial governments are under the direct supervision of the central government and they do not have direct control over land, thus they are relatively disadvantaged compared with municipalities.
Table 7 Parameters for growth rates categorised by decision level of EDZs
Decision level of EDZ Municipal Provincial National Not known No zones
Number of zones 123 61 113 30 2428
Average growth rate
(% per year) 2.5 2.1 3.7 3.3 0.5
Standard deviation 4.7 2.1 2.9 4.0 2.5
EDZ and population growth of urban agglomerations
44 The location of new EDZs is usually chosen according to the proximity of markets or of
infrastructures enabling exportations, thus not far from urban agglomerations or within them. Merging the district file with the Chinacities data base provide information about whether EDZ location had or not a significant impact on the expansion of these urban
areas. Indeed, the urban agglomerations are the relevant geographical entities for exploring a number of questions concerning the rationale of EDZ in the economic development and urbanization processes when thinking of the Chinese territory at national scale.
45 It must be reminded that the average growth rate of all urban agglomerations, with or
without EDZ, is a little higher than the growth of total population (0.7% per year), with rather high fluctuations: half of the agglomerations have growth rates between -1.4% and 3.6% per year (table 8).
Table 8. Annual growth rates of population in urban agglomerations (%)
Growth rate Min. 1st Qu. Median Mean 3rd Qu. Max. SD
(% per year) -10.5 -1.4 0.4 0.7 3.6 25.2 3.8
46 A first result it that urban agglomerations where EDZs were implemented have higher
growth rates (4.3%) on average than those without any (1.2%). This could be interpreted either as a direct impact of investment on urban growth, or as a selection effect, if zones where investment occurred were already more dynamic.
47 Due to the different activities that different types of EDZs prioritize and different policies
including different degree of tax deduction given by local or national governments, it is possible that different typology defined by Chinese authority correspond to different patterns of urban population growth.
48 Table 9 shows the growth rates computed for urban agglomerations where each category
of the typology of EDZs is located. The variation of the growth rate is largely increasing with the number of the zones in each type. Except for Logistic Park (LP) and Bounded Zones (BZ), and Border Economic Cooperation Zones (BECZ) that have only one observable, the 5 Investment Zones (IZ) correspond to the highest average annual population growth (5.7%), closely followed by the 68 Industrial Park (IP) (5.6%), the 17 Export Processing Zones (EPZ) (5.6%), and the 9 Free Trade Zones (FTZ) (5.1%). The 30 High-tech Industrial Development Zones (HIDZ) have an average growth rate of 4.4%, while the Economic and Technological Development Zones (ETDZ) have the lowest but still remarkable average growth rate of 3.5% per year.
Table 9. Annual growth rate of population (%) in urban agglomerations by typology of EDZs
Typology BECZ BZ EPZ ETDZ FTZ HIDZ IP IZ LP All agglome-rations
Number of zones 1 1 17 232 9 30 68 5 1 9488
Average growth rates 7.9 3.1 5.6 3.5 5.1 4.4 5.6 5.7 0.2 1.2
49 By running ANOVA test, it can be concluded that different types of zones have evidently
different effects on the urban growth, and that the typology of EDZs is a significant factor that affects the annual population growth in urban agglomerations: it confirms that agglomerations receiving Border Economic Cooperation Zones (one case only), Industrial Zones (68 cases) and Logistic Park (one case), tend to grow more rapidly than those equipped with Bounded Zones (one case) or simple Economic and Technical Development Zones (232 cases) for instance (figure 4, see also annex, Fisher test with probabilities lower than 10 -3).
Figure 4. ANOVA analysis of growth rate by typology of EDZs
50 A second hypothesis is that different administrative levels of EDZs, including national,
provincial, and municipal EDZs, correspond to different degrees of impacts on annual population growth, because different administrative level corresponds to different policies towards the zones. For example, the national level EDZs enjoy the more favorable policies listed in the “policy of national economic and technological development zones” (Guojiaji jingji jishu kaifa qu zhengce). We assume that EDZ(s) with higher status should have bigger positive impact on population growth of the urban agglomeration where it locates. To simplify the model, we consider only the administrative level when the zone started operating, which corresponds to the decision level for creating the zone.
51 Table 10 shows that the distribution of each category of EDZ is generally dispersed.
Interestingly, contrary to our assumption, the municipal-level zones correspond to the highest growth rate of 5.1% among the three types of zones, closely followed by urban agglomerations where national-level zones are located, which have an average annual growth rate of 4.2%. And the agglomerations where provincial-level zones are located correspond to the lowest growth rate (2.6%). Similarly, to the previous results from district level, this might be explained by Fitzgerald’s theory (2012) that municipal governments in China are more advantaged in their control over land compared to provincial and national governments. An ANOVA test confirms that different administrative levels have evidently different effects on the urban growth, although it is not an effect that would strictly increase with the administrative level.
Table 10. Growth rates (%) according to decision level of EDZs
Level of decision Municipal Provincial National All agglomerations
Number of zones 123 61 113 9448
Average growth rates 5.1 2.6 4.2 1.2
Standard Dev. 2.5 2.6 2.9 3.8
52 The third hypothesis is that the number of major EDZs in a certain agglomeration is
positively correlated to its annual population growth rate. It is likely that more economic zones will bring more economic growth and more employment opportunities, which lead to more migration and population growth. Fig.5 shows that the number of major economic zones is indeed positively correlated to the annual population growth rate. It shows that one additional economic zone increases the annual population growth rate by 0.14% (See annex table5), which is a considerable impact comparing to the average growth rate of 0.7%. Due to the large number of observations the correlation coefficient is significant, however, with a low value (R-squared = 0.033), because there is a high variability of growth rates for urban agglomerations having small numbers of economic development zones.
Figure 5. Regression analysis of urban agglomeration growth rate on number of zones
53 The fourth hypothesis is that the establishment year of the first zone in a certain urban
agglomeration is negatively correlated to the annual population growth rate. In other words, the earlier one urban agglomeration started to establish economic zones, the more
it is likely to benefit from the economic activities in the economic zones, which can be translated into higher annual population growth rate. As our data of annual growth rate is calculated from 2000 and 2010 census, the zones established after 2000 might not be accurately represented, therefore in this part only the zones established before 2000 are considered in the model. Figure 6 shows a graphic presentation of the correlation between the two variables. It is evident that the establishment year of the first zone is negatively correlated to the annual population growth rate. The regression analysis shows that to delay one year of the establishment of first economic zone, decreases 0.09% in annual population growth of the urban agglomeration (See annex table6). Therefore, if one urban agglomeration starts the establishment 10 years later, the growth rate drops by 0.9%. And the p value of the model is between 0.1 and 0.05, thus the correlation is significant. However, the R-squared shows a low value (R-squared=0.018), because of the high variability of growth rates for urban agglomerations having small numbers of economic development zones. Therefore, it can still be concluded that the correlation coefficient is significant.
Figure 6. Regression analysis of growth rate on the establishment year of the first zone in each agglomeration
54 Other hypotheses which were made revealed rather insignificant results: among the three
economic indices that can be used for measuring the economic performance of the EDZs, only the global industrial output (GIO) is positively correlated to the annual population growth, while the local GDP of the urban agglomerations, and the FDI are not. Another assumption frequently made about the effect of diversity of urban activities on urban growth also revealed insignificant at district level.
Conclusion
55 The aim of this paper was not to try a new assessment about the impact of the Chinese
policies of establishing Special Economic Zones and different kinds of Economic Development Zones on the national economic development, which already is largely documented. The slight added value of our paper is in offering, for the first time to our knowledge, a geographically disaggregated analysis of EDZs location and differential impact on urban growth. Meanwhile, we were able to analyze a few features of the geographical distribution of EDZs in the Chinese urban system and thus to test to what extent it meets the ambition of national policies of territorial development.
56 Our conclusion from observing some 348 Economic Development Zones established
between 1983 and 2013 and distributed in 277 districts and 255 urban agglomerations in the whole of China, is first of all that their development is very strongly linked with urban growth, not only in the districts but at the level of urban agglomerations as well. According to the wave-like evolution of the creation of EDZs during the period, we have tested the theory of a hierarchical diffusion of this “innovation”. We have observed that there is a clear westward diffusion of EDZs over time. This matches the ambition of Chinese policies having at first selected places to attract foreign investment in cities of the Eastern coast in order to favor exportations at the time where China raised its role as world factory and in the second phase having converted and adapted these EDZs as instruments of territorial and urban development all over the country. The policy tending to direct EDZs towards smaller urban agglomerations is also perceptible, even if not systematic.
57 In conclusion, the location choices of the EDZs in China are operated in a distinctly
different way from the logic of sole economic consideration, but subject to the political environment and the national plan of the central government. In the end, the location choice of the SEZs are used as institutional tools to divert the FDIs and domestic investments to certain regions and cities, where the agglomeration effects are not necessarily strong, thus aiming to achieve a more geographically balanced development plan and narrow down the increasing inequalities between the coastal regions and the other parts of China especially the western regions.
58 However, the implementation of EDZs is not sufficient for explaining the high variations
in urban growth rates. Far from that, other processes interfere and more and more overcome the impact of Economic Development Zones on urban development. They are linked with other trends including the growing influence of finance and real estate that are visible in global urbanization and that Chinese local authorities at different administrative levels do operate for adding value to their land. That trend was already well identified by Ye an Wu in 1996, it has now become a potential source of conflict between urban actors and rural ones, and a concern about urban sprawling trends and their consequences on agricultural land and environmental quality (Ye and Wu, 2014).
BIBLIOGRAPHY
Akinci G., Crittle J., 2008, Special economic zones: Performance, lessons learned, and implications for zone
development. Washington DC, The World Bank.
Aveline-Dubach N. 2016, Centralité du foncier et dynamiques immobilières en Chine au prisme de l’Etat
Développeur. https://hal.archives-ouvertes.fr/hal-01298409
Aydalot P., 1976, Dynamique spatiale et développement inégal, Paris, Economica
Broadman H.G., Sun X., 1997, "The distribution of foreign direct investment in China". World
Economy, Vol.20, No.3, 339-361.
Castells M., Hall, P. 1994, Technopoles of the World: The Making of the 21st Century Industrial Complexes. London, Routledge.
Chan K.W. 2010, "Fundamentals of China’ urbanization", The China Review, Vol.10, No.1, 63–94. Chen L., Jameson M., 2012, "Rents, party cadres and the proliferation of Special Economic Zones in China" Journal of Economic Policy Reform, Vol.15, No.3, 207-221. https://www.tandfonline.com/ doi/abs/10.1080/17487870.2012.692469
Chen X. 1995, "The Evolution of Free Economic Zones and the Recent Development of Cross National Growth Zones", International Journal of Urban and Regional Research Vol.19, No.4, 593-621. China Knowledge, 2012-2014, China Knowledge. Research Reports. Singapore: China Knowledge Newswires Pte Ltd. Retrieved from https://search-proquest-com-s.acces-distant.sciences-po.fr/ publication/2029680
Cura R., Cottineau C., Swerts E., Ignazzi C.A., Bretagnolle A., Vacchiani-Marcuzzo C., Pumain D., 2017, “The old and the new: qualifying city systems in the world with old models and new data”.
Geographical Analysis. Vol.49, No.4, 363-386.
Fu, X., Gao, Y., 2007, Export Processing Zones in China: A Survey. ILO, s. t., University of Oxford -University of Cambridge, 50 p.
Ge W., 1999, "Special economic zones and the opening of the Chinese economy: Some lessons for economic liberalization", World Development, Vol.27, No.7, 1267-1285.
Gu C., Zhao L, 1998, Chinese High-tech industries and development zones. Beijing: Zhongxin press. Moriconi-Ebrard F., Perez J., 2017, Shanghai et Guangzhou sont les deux agglomérations urbaines les plus peuplées du monde, Confins No.30.
Pak C., Park J.D., 1997, The special economic zones of China and their impact on its economic
development, Vol.58, 496-497.
Pumain D., Swerts E., Cottineau C. Vacchiani-Marcuzzo C., Ignazzi A., Bretagnolle A., Delisle F., Cura R., Lizzi L, Baffi S., 2015, "Multi-level comparison of large urban systems", Cybergeo, No.706. https://journals.openedition.org/cybergeo/26730
Rodriguez-Pose A. and Hardy D., 2014, Technology and Industrial Parks in Emerging Countries. London: Springer.
Shi, H., Tian J., Chen L., 2012, "China’s Quest for Eco-Industrial Parks, Part I, Journal of Industrial
Ecology, Vol.16, No.1, 8-10.
Swerts E., 2013, Les systèmes de villes en Inde et en Chine. Université Paris I, thèse de doctorat. Swerts E. 2017, A data base on Chinese urbanization: ChinaCities, Cybergeo : European Journal of
Geography No.830. http://journals.openedition.org/cybergeo/28554
Swerts E., Liao L., 2018, "The Chinese Urban System: Political Evolution and Economic Transition", in: Rozenblat C. Pumain D. Velasquez E. (eds), International and Transnational
Perspectives on Urban Systems. Springer Nature, Advances in Geographical and Environmental
Sciences, 215-235.
UNCTAD 2015, Enhancing the Contribution of Export Processing Zones to Sustainable Development Goals. https://unctad.org/en/pages/PublicationWebflyer.aspx?publicationid=1418
Wang J., 2013, "The economic impact of special economic zones: Evidence from Chinese municipalities", Journal of Development Economics, Vol.101, 133-147.
Wong S., Tang B., 2005, "Challenges to the sustainability of ‘development zones’: A case study of Guangzhou Development District, China". Cities, Vol.22, No.4, 303–316, 2005
Wu F., Ma L., 2006, "Transforming China’s globalizing cities". Habitat international, Vol.30, No.2, 195-198.
Wu F. 2009, "Land Development, Inequality and urban villages in China", International Journal of
Urban and Regional Research, Vol.33, No.4, 885-889.
Wu F., 2015, Planning for growth: Urban and regional planning in China. London and New York, Routledge.
Wu F., 2016, "Emerging Chinese Cities: Implications for Global Urban Studies", The Professional
Geographer, 68:2, 338-348.
Xie L., 2018, Land finance strategies and urban growth in China: Economic Development Zones, real estate,
and population growth. Paris, Institut d’Etudes Politiques, Master thesis, p.4.
Xie K., Song Y., Zhang W., Hao J., Liu Z., Chen, Y., 2018, "Technological Entrepreneurship in Science Parks: A Case Study of Wuhan Donghu High-Tech Zone." Technological Forecasting & Social
Change, Vol.135, 156-168.
Yeh A. G. O., Wu, F., 1996, "The new land development process and urban development in Chinese cities", International Journal of Urban and Regional Research Vol.20, No.2, 330–353.
Ye L., Wu A.M., 2014, Urbanization, land development and land financing: evidence from Chinese cities. Journal of Urban Affairs, Vol.36, No.1, 354-368.
Zeng D.Z., 2010, Building engines for growth and competitiveness in China: Experience with special
economic zones and industrial clusters. Herndon: World Bank Publications.
Zeng, D.Z., 2011, How Do Special Economic Zones and Industrial Clusters Drive China’s Rapid Development ? World Bank, Policy Research Working Paper 5583.
Websites
Ministry of Commerce of People’s Republic of China: http://www.mofcom.gov.cn/xglj/ kaifaqu.shtml
APPENDIXES
Annex 1: Complements of statistical analyses
Table 1. ANOVA analysis of typology on population growth at district level
Df Sum Sq Mean Sq F value Pr (>F) Typology 9 0.1785 0.019835 28.56 <2e-16 (<0.001) Residual 2742 1.9043 0.000695
Table 2. ANOVA analysis of administrative level on growth rate at district level
Df Sum Sq Mean Sq F value Pr (>F) Typology 5 0.1627 0.03253 46.52 <2e-16 (<0.001) Residual 2746 1.9202 0.0007
Table 3. ANOVA analysis of growth rate by typology of EDZs at agglomeration level
Df Sum Sq Mean Sq F value Pr (>F)
Typology 9 0.0767 0.008523 8.616 1.33e-12 (<0.001) Residual 1213 1.1999 0.000989
Table 4. ANOVA analysis of growth rate on administrative level at agglomeration level
Df Sum Sq Mean Sq F value Pr (>F)
Level of decision 3 0.0651 0.021704 21.84 8.87e-14(<0.001) Residual 1219 1.2115 0.000994
Table 5. Analysis of growth rates according to the number of zones at agglomeration level
Estimate Std. Error Pr (>|t|)
Number of zones 0.0014 0.0002 2.03e-10 (<0.001) Simple regression coefficients
Table 6. Analysis of growth rates according to the establishment year of the first zone at agglomeration level
Estimate Std. Error Pr (>|t|) Year of the earliest zone -0.0009 0.0005 0.0767 Simple regression coefficients
NOTES
1. See website of Ministry of Commerce of People’s Republic of China: http:// www.mofcom.gov.cn/xglj/kaifaqu.shtml
2. See for example the official website of Suzhou Industrial Park: http://www.sipac.gov.cn/ 3. The delineation of elementary units (county and township) that were aggregated within the perimeters of urban agglomerations, were purchased from the Data China Center of the University of Michigan (http://chinadatacenter.org/). Two additional databases were purchased at the Township level. The first describes the population of Towns (Zhen) for the year 2000 and the second the population of Towns (Zhen) and townships (Xiang) in year 2010.
4. In 1984, China further opened 14 coastal cities—Dalian, Qinhuangdao, Tianjin, Yantai, Qingdao, Lianyungang, Nantong, Shanghai, Ningbo, Wenzhou, Fuzhou, Guangzhou, Zhanjiang and Beihai— to overseas investment. See for example http://www.china.org.cn/e-china/openingup/sez.htm 5. We thank an anonymous reviewer for this excellent suggestion that greatly improve the quality of our paper.
ABSTRACTS
China’s urbanization has followed an original trajectory including during the last four decades a strongly planned economic development. The policy of creating Economic Development Zones is one of the major tools in use for modernizing the economy. We try here to measure the relationship between Economic Development Zones and urban demographic growth at disaggregated geographical levels (districts and urban agglomerations). An original database documenting EDZ characteristics and location has been collected at district level and coupled via a GIS to the ChinaCities database. We explore both to what extent the selection of places where
EDZ developed is linked with the former hierarchical and spatial pattern of Chinese urban system and what impact the EDZs have had on urban development. We conclude that the selection of places mainly guided from national policies followed a hierarchical diffusion of this “innovation” in the Chinese urban system. Measuring the impact of that policy on urban growth however leads to the introduction of the hypothesis that other policies mainly inspired at local level may as well have widely influenced the spatial distribution of urban growth.
L’urbanisation de la Chine s’est effectuée selon une trajectoire originale au cours des quatre dernières décennies, soutenue par un développement économique fortement planifié. La politique de création de Zones de Développement Economique est l’un des principaux outils de modernisation de l’économie. Nous tentons ici de mesurer la relation entre l’implantation de ces Zones de Développement Economique et la croissance démographique observée à des niveaux géographiques fins (districts et agglomérations urbaines). Une base de données inédite sur les caractéristiques et la localisation des Zones de Développement Economique (EDZ) a été construite à l’échelon des districts. Elle est couplée par un système d’information géographique à la base de données ChinaCities. Nous cherchons à voir si la sélection des lieux choisis pour implanter les EDZ dépend de la structure antérieure, hiérarchique et spatiale, du système de villes chinois, et quel a pu être l’impact des EDZ sur le développement urbain. Nous concluons que le choix des lieux, guidé principalement par les politiques nationales, suit un processus de diffusion hiérarchique de cette « innovation » dans le système urbain chinois. Mesurer l’impact de cette politique sur la croissance urbaine conduit cependant à introduire l’hypothèse que d’autres politiques menées à l’échelon local ont pu aussi largement influencer la répartition spatiale de la croissance urbaine.
INDEX
Mots-clés: développement économique, croissance urbaine, urbanisation, politique urbaine, géographie économique
geographyun 935, 906, 156
Keywords: economic development, urban growth, urbanization, urban policies, economical geography, China
AUTHORS
LIUBING XIE
Sciences Po Paris/CNRS, France, Research Assistant, liubing.xie@sciencespo.fr ELFIE SWERTS
University of Lausanne, Switzerland, FNS Senior Researcher, elfie.swerts@gmail.com DENISE PUMAIN