1
Design-Integrated Urban Heat Island Analysis Tool and Workflow:
Development and Application
by
Hellen Rose Anyango Awino
Bachelor of Architecture University of Texas at Austin, 2014 Submitted to the Department of Architecture in Partial Fulfillment of the Requirements for the Degree ofMaster of Science in Architecture Studies at the
Massachusetts Institute of Technology
June 2019
@ Massachusetts Institute of Technology. All rights reserved.
Signature of Author: __________________________________________________________________ Department of Architecture
May 23, 2019
Certified by: __________________________________________________________________________ Leslie K. Norford Professor of Building Technology Thesis Supervisor Accepted by: _________________________________________________________________________
Nasser Rabbat Aga Khan Professor Chair of the Department Committee on Graduate Students
2
Committee
Thesis Supervisor: Leslie K. Norford, PhD
George Macomber Professor in Construction Management Professor of Building Technology
Associate Head, Department of Architecture
Thesis Readers: Christoph Reinhart, PhD
Professor of Building Technology Carlos Cerezo Davila, PhD
3
Design-Integrated Urban Heat Island Analysis Tool and Workflow:
Development and Application
by
Hellen Rose Anyango Awino
Submitted to the Department of Architecture on May 23, 2019 in Partial Fulfillment of the Requirements for the Degree of Master of Science in Architecture Studies
Abstract
The Urban Heat Island (UHI) effect is a well-studied phenomenon broadly attributed to human activities that transform open terrain into cityscapes. Among global 21st-century concerns, projected trends in population growth, urbanization, and regional climate change could exacerbate the warming in cities and intensify the UHI effect. Yet, microclimate analysis essential to assessing UHI intensity is often neglected, resulting in poor planning practices with adverse effects on health, comfort and energy use within cities. With buildings responsible for substantial quantities of global energy consumption and carbon emissions, this context demands climate-responsive design to achieve better-performing cities.
The UHI effect presents an urban design challenge, but only recently has there been a platform for design workflow integration. Despite existing engines that accurately evaluate UHI intensity in urban environments, architects, designers, and urban planners have often not incorporated such simulation into microclimate studies due to prohibitively expensive computational costs, disconnected workflows within unintuitive or unfamiliar platforms, and uncertainty about difficult-to-obtain urban climatology parameters. These hindrances cause impactful delay within the design feedback loop and often generate a lack of confidence in the simulation process and output. This thesis proposes a Computer-Aided-Design integrated graphical user interface for the Urban Weather Generator (UWG), an urban-scale climate prediction tool developed by Bruno Bueno to simulate microclimatic conditions of urban sites using operational weather station data. The goal is to make the powerful and computationally cheap engine accessible to design workflows by incorporating it as a plugin within the conventional design software Rhinoceros-3D, and by coupling it with the Local Climate Zone classification scheme developed by urban climate experts Iain Stewart and Timothy Oke to standardize quantitative physical descriptions of cities. The proposed update automates geometric parameter extraction and implements a reliable means of urban morphological parameter estimation. As a case study, an iterative urban-scale design exploration is analyzed for selected climates.
Thesis Supervisor: Leslie Keith Norford
5
Contents
Abstract 3 Contents 5 Acknowledgements 8 List of Figures 9 List of Tables 11 Nomenclature 12 1. Introduction 13 1.1. Objective 13 1.2. Context 131.2.1. Population Growth and Rapid Urbanization 13
1.2.2. Urban Heat Island Effect 14
1.2.3. Microclimate Analysis 16
1.3. Thesis Structure and Scope 17
2. Background 18
2.1. Urban Weather Generator (UWG) 18
2.1.1. Engine 18
2.1.1.1. UWG Parameters 21
2.1.1.2. Limitations 22
2.1.2. User Interfaces 23
6
2.1.2.2. Tool Accessibility 25
2.2. Local Climate Zone Classification System 26
2.2.1. Typologies 27
2.3. UWG and LCZ 30
3. Urban Weather Generator for Rhino 31
3.1. Integration into Rhino and Use Interaction 31
3.1.1. Graphical User Interface 32
3.1.1.1. File and Directory Input 33
3.1.1.2. Building and Urban Parameter Input 34
3.1.1.3. Simulation Parameter Input 35
3.2. Workflow 36
3.2.1. Current Workflows 37
3.2.2. Proposed Workflow 38
3.2.2.1. Geometric Parameter Extraction 38
3.2.2.2. Morphological Parameter Extraction 40
4. Design-Integrated Urban Analysis 41
4.1. Overview 41
4.2. Methodology 42
4.2.1. Tested Model Sets 43
4.2.2. Simulation Parameters 45
4.3. Results and Findings 47
7
4.3.2. Climate Impact 88
4.3.2.1. Temperature 88
4.3.2.1. Rural Reference Location 88
4.3.2.3. Wind and Water Observations 91
4.3.3. Energy Use Intensity 93
4.3.3.1. Vegetation Impact 95
4.4. Carbon Intensity and Cost 100
5. Conclusion 103
5.1. Summary of Contributions 104
5.2. Future Work 105
References 106
Appendix 109
A. Tested Model Sets Expanded Information 109
B. Local Climate Zones Abridged Definitions 117
8
Acknowledgements
I have had the great privilege to work under respected faculty and with remarkable peers over my two years at MIT. I am forever grateful for this time, and for the knowledge and experiences shared. First, I would like to thank my advisor, Professor Leslie Norford. I greatly appreciate the time I have spent learning from you and your generous support over the two years. Your advice and wisdom have pushed me to explore beyond my boundaries. I am grateful for the guidance of Professor Christoph Reinhart. Your curiosity and never-ending enthusiasm have inspired me to question everything and trust my intuition. I am very thankful for the advice of Carlos Cerezo Davila. Your insight and mentorship has been an invaluable part of my learning.
To dear Anna Song, this process would not be possible without you. I am forever grateful for your patience, persistence, openness to explore unknown territories and continued interest and effort in making the GUI work.
I would like to thank Chris Mackey, Saeran Vasanthakumar and Ladybug Tools LLC for their continued guidance and support in the development of the UWG for Rhino GUI as well as for the support of the open source code. I would like to thank the Urban Interface and the Environmental Performance teams at KPF for their collaboration and generous contribution of the urban design iterations considered in this study. I am grateful for the work of the Bruno Bueno and all the contributors who followed to further develop and maintain UWG.
A special thank you to dear Andreea O’Connell, Suraiya Baluch and Cynthia Stewart: I can never forget your overwhelming kindness. Thank you for your generous support.
Thank you to my inspiring BT lab colleagues for the supportive community. A special thank you to Nate and Shreshth for your critical advice and refreshing perspectives. A special thank you to Alpha, Moh, and Khadija for your always kind and encouraging words, and for the shared laughter. To dear Petra Liedl, I am forever grateful for the confidence you have had in me over the years. To dear Nubianna Aben, Jossie Osellu and Jackie Lieck, I have carried your love and support with me over the years.
Finally, to Judith Millicent Were, Ishmael Jackoyo and Patricia Lohra Atieno: joka Awino, words can never describe the gratitude I have for your unconditional love, support and encouragement. I appreciate your care. Nyar Kobiero odagi loch.
9
List of Figures
Figure 1. Growth Rates of Urban Agglomerations by Size Class, 2018-2013 13 Figure 2. Spatial and Temporal Profiles of the UHI Effect and Schematic Description of Urban 15
Figure 3. UWG Engine Components : 20
Figure 4. UWG Microsoft Excel Interface 24
Figure 5. UWG Dragonfly Workflow 26
Figure 6. LCZ Classification Components 27
Figure 7. Standard classified LCZs 28
Figure 8. LCZ Subclasses with combined built and land cover types 29
Figure 9. UWG for Rhino Input Framework 32
Figure 10. EPW + STAT File Input 33
Figure 11. Unit Check 33
Figure 12. Building Typology Parameters 34
Figure 13. Rhino 3D Canvas Building Selection 35
Figure 14. Urban Parameters 35
Figure 15. Run UWG Window 36
Figure 16. UWG Simulation Process 36
Figure 17. Current Design Workflow of Text-based UIs 37
Figure 18. Rhino 3d replaces textual description of urban sites 38
Figure 19. Rhino 3d reduced workflow 39
Figure 20. UWG for Rhino Workflow 39
Figure 21. LCZ Parameter Extraction 40
Figure 22. ASHRAE Climate Zones 42
Figure 23. LCZ Parameter Extraction 42
Figure 24. Iteration 1 43
Figure 25. Iteration 2 43
Figure 26. Iteration 3 44
Figure 27. Iteration 4 44
Figure 28. Traffic Schedule 47
Figure 29. William P. Hobby Airport, Houston 89
10
Figure 31. Seattle-Tacoma International Airport, Seattle 90
Figure 32. O'Hare International Airport, Chicago 90
Figure 33. LaGuardia Airport, New York 91
Figure 34. Seattle-Tacoma, Seattle Wind Wheel 92
Figure 35. LaGuardia, New York Wind Wheel 93
Figure 36. Net Change in Cooling and Heating EUI 94
Figure 37. Model Set 1 Cooling EUI 96
Figure 38. Model Set 1 Heating EUI 96
Figure 40. Model Set 2 Cooling EUI 97
Figure 41. Model Set 2 Heating EUI 97
Figure 42. Model Set 3 Cooling EUI 98
Figure 43. Model Set 3 Heating EUI 98
Figure 44. Model Set 4 Cooling EUI 99
Figure 45. Model Set 4 Heating EUI 99
Figure 46. Houston | CO2 Intensity and Electricity Cost 100 Figure 47. Atlanta | CO2 Intensity and Electricity Cost 101 Figure 48. New York | CO2 Intensity and Electricity Cost 101 Figure 49. Seattle | CO2 Intensity and Electricity Cost 102 Figure 50. Chicago | CO2 Intensity and Electricity Cost 102
11
List of Tables
Table 1. UWG Simulation Parameters 45
Table 2. UWG Building Typology Parameters 46
Table 3. LCZ Properties for used typologies (I. D. Stewart & Oke, 2012) 46
Table 4. Local Climate Zones Abridged Definitions 117
12
Nomenclature
EnergyPlus Weather Data (EPW)
EnergyPlus Weather Data Statistics (STAT) Microsoft Excel (XLSM)
Extensible Markup Language (XML) Comma Separated Value (CSV) Urban Heat Island (UHI) Urban Cool Island (UCI)
Urban Weather Generator (UWG) Computer Aided Design (CAD) The US Department of Energy (DOE) Rhinoceros 3D (Rhino)
Grasshopper (GH)
MATLAB formatted data (MAT)
Boundary Representation Objects (BREPs) Local Climate Zones (LCZ)
World Urban Database and Access Portal Tools (WUDAPT) Urban Modeling Interface (umi)
Design Iterate Validate Adapt (DIVA)
Architecture Engineering Construction (AEC) Rural Station Model (RSM)
Vertical Diffusion Model (VDM) Urban Boundary Layer Model (UBLM) Urban Canopy Layer (UCL)
Urban Canopy – Building Energy Model (UC-BEM) Floor Area Ratio (FAR)
13
1.
Introduction
1.1.
ObjectiveThe objective of this research is to incorporate Urban Heat Island analysis into a useful design workflow in order to shape urban design practices that affect building performance.
1.2.
Context1.2.1.
Population Growth and Rapid UrbanizationThe United Nations projects that the world population will reach 8.6 billion by the year 2030, 9.8 billion by 2050, and 11.2 billion by 2100 (UN-DESA Population Division, 2017). The majority of this growth, as illustrated in Figure 1, is foreseen in the developing regions of the world, especially Africa and Asia, which are also set to experience the highest rates of urbanization globally with average growth rates between 3% and 5% (UN-DESA Population Division, 2018a).
Figure 1. Growth Rates of Urban Agglomerations by Size Class, 2018-2013 (UN-DESA Population Division, 2018b)
14
In many regions, this growth will occur informally and largely through unstructured densification that will strain local resources and pose major hindrances to governments already struggling to address the various developmental challenges triggered by urbanization (UN-DESA Population Division, 2015)(UN-DESA Population Division, 2014). Issues such as lack of infrastructure and housing, increased density and congestion, and inadequate planning for large-scale energy- and resource efficiency require both urgency and careful consideration in planning.
1.2.2.
Urban Heat Island EffectCharacteristically, urbanization imposes significant environmental changes on the urban environments it produces. One such major consequence is the considerable increase of temperatures in urban centers relative to surrounding rural or undeveloped areas due to the transformation of open terrain into dense, urban cityscapes. This phenomenon, known as the Urban Heat Island (UHI) effect, was first proven in early 1800s studies by the pioneer of urban climate studies, Luke Howard (Howard, 1883). It has since been extensively documented in numerous city- and climate-specific field experiments that have demonstrated the UHI effects’ magnitude and characteristics.
Causes of the UHI effect lie in the roughness of urban areas along with the artificial materials that blanket these canyons relative to the open, natural terrain of rural surroundings. The differences in morphology disrupt surface energy and radiation balances and cause cities to experience increased temperatures (Oke, 1982). Increased urban surfaces cause greater absorption of solar radiation. The canyons created by the vertical profiles of buildings restrict the surfaces’ exposure to the relatively cool sky and reduce wind speeds, thereby respectively decreasing radiative and convective heat removal from the canyons (Oke, 1982). The material choices of urban surfaces cause increased thermal admittance and decreased evapotranspiration due to reduced amount of vegetation (Oke, 1982). Additionally, the waste heat from the combustion of fuels for transportation, industrial processes and building conditioning causes increased anthropogenic heat gain (I. D. Stewart & Oke, 2012).
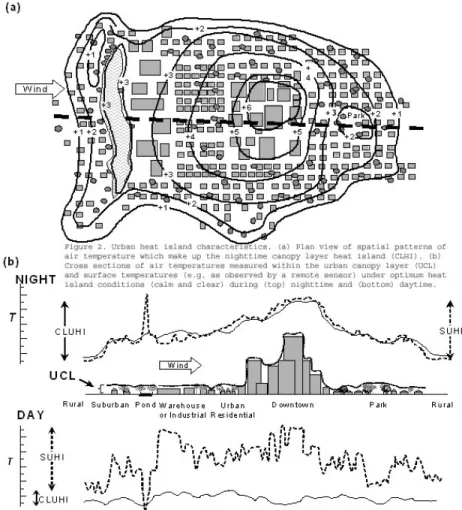
The UHI effect has both spatial and temporal profiles. In spatial form, the UHI effect is characterized by a sharp rise in the canopy-layer air temperature at the boundary of rural - suburban areas, followed by a slow and often variable increase towards the downtown core of the urban area where the warmest temperatures occur (Figure 2a). In temporal form, the UHI effect has a diurnal
15
pattern with the highest intensity at night (Figure 2b), expressing a lag in the cooling of cities, and in some situations leading to the opposite “urban cool island” effect during early morning hours.
Figure 2. Spatial and Temporal Profiles of the UHI Effect and Schematic Description of Urban Atmosphere Components
(Voogt, n.d.)
The UHI effect implicates some of the most significant challenges of the twenty-first century: the population growth and rapid urbanization discussed in the above section, as well as regional climate change and global warming. These challenges put sustainable urban development as one of the top priorities of the century. However, without proper understanding of and action to properly mitigate the UHI effect, these combined factors could exacerbate the warming in cities and intensify the UHI effect. This becomes highly detrimental to health and comfort within cities, energy use intensity (EUI) and carbon footprints of urban areas and incontestably, the impact of regional climate change on urban systems.
16
1.2.3.
Microclimate AnalysisMicroclimate analysis is one of the first steps that architects typically make when approached with a design exercise. This process involves documenting the physical aspects of site context such as neighboring buildings, streets, and vegetation, as well as the environmental factors affecting the site such as wind speeds and direction, sun path and radiation, and temperature ranges and humidity. This process is not only important for creating a design that is contextually responsive, but it is crucial for developing climate-responsive strategies to inform design decisions.
The environmental site factors are available in weather files typically developed for cities globally. The United States Department of Energy (U.S. DOE) funds a database managed by the National Renewable Energy Laboratory (NREL) to collect this information in a format named EnergyPlus Weather (EPW) file that is made available on the EnergyPlus website (https://energyplus.net/weather). This file has compiled weather statistics measuring the environmental factors mentioned above on an hourly basis.
The gap between the UHI effect and urban design and building performance lies in microclimate analysis. The difference in temperatures between rural and urban areas is often unaccounted for because the EPW data for a city is typically gathered ten meters above ground at an airport. For most cities, airports are located on the more rural outskirts, but the collected information is still used to describe the urban centers, causing a discrepancy between the provided and actual conditions of the urban area. This oversight often results in design errors for various performance metrics that are useful for benchmarking and establishing environmental performance targets at both building- and urban scales. Ultimately, the design decisions made for urban spaces contribute to global environmental impacts.
17
1.3.
Thesis Structure and ScopeThe objective of this research is to incorporate Urban Heat Island analysis into a useful design workflow in order to bridge the gap between the UHI effect analysis and the practices that shape urban design and affect building performance. This thesis is structured in three parts:
1. The proposal of a Computer-Aided-Design (CAD) integrated graphical user interface (GUI) for the Urban Weather Generator (UWG), an urban-scale climate prediction tool developed by Bruno Bueno to simulate microclimatic conditions of urban sites using operational weather station data (Bueno, 2012).
2. The integration of the Local Climate Zone classification scheme developed by urban climate experts Iain Stewart and Timothy Oke to standardize quantitative physical descriptions of cities (I. D. Stewart & Oke, 2012).
3. A demonstration of the workflow in an iterative urban-scale design exploration analyzed for selected climates using UHI intensity to compare cost and carbon intensity.
The goal is to make the powerful and computationally cheap engine accessible to design
workflows by incorporating it as a plugin within the conventional design software Rhinoceros-3D (Rhino 3D), and by coupling it with the LCZ scheme. By linking three components, UWG, rhino 3D and the LCZ scheme, the proposed workflow automates geometric parameter extraction and implements a reliable means of urban morphological parameter estimation.
18
2.
Background
2.1.
Urban Weather Generator (UWG)The Urban Weather Generator (UWG) is a physics-based urban-scale climate prediction tool developed by Bruno Bueno (2012) to simulate microclimatic conditions of specific urban sites using operational weather station data. The UWG software takes in meteorological conditions recorded at a rural reference site in the form of an EPW file and morphs the data to output simulated hourly urban air temperature based on specified urban characteristics. The output allows for precise analysis and planning in the design process, as well as for accurate predictions of energy performance at building and neighborhood scales.
2.1.1.
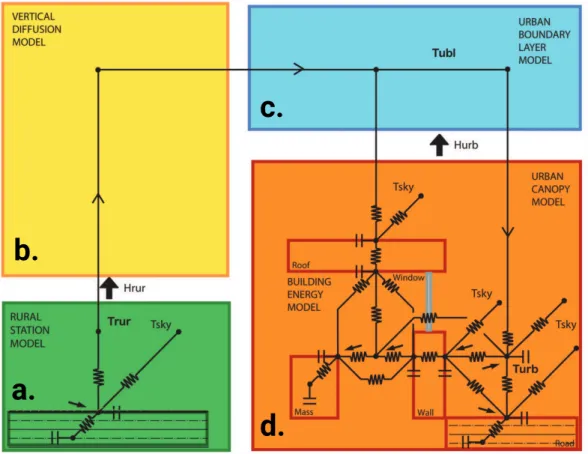
EngineUWG uses energy balance equations to evaluate the two-way interactions between buildings and the climate by implementing four components (Figure 3): rural station model (RSM), vertical diffusion model (VDM), urban boundary-layer model (UBLM), and urban canopy and building energy model (UC-BEM) (Bueno 2012; Bueno et al. 2012). The engine takes into consideration local surface radiation exchanges, sensible heat fluxes from building operations and from building surfaces to output urban-scale building and climate information including building energy consumption, urban air and surface temperatures, surface solar irradiation, local wind speeds as well as urban heat island intensity (Bueno et al., 2012; Yang, 2016).
The RSM is based on an energy balance at the soil surface; a transient heat diffusion equation that represents the storage and release of heat from the ground is solved via finite differences. The RSM collects hourly-recorded meteorological data from a rural reference site, calculates the sensible heat fluxes, and provides the solutions to the VDM and UBLM.
The VDM applies a heat diffusion equation to calculate vertical air temperature profiles above the reference weather station. It uses the air temperatures and velocities read from the reference weather station and the sensible heat fluxes calculated at the RSM as input. The computed air temperatures are forwarded to the UBLM.
19
The UBLM uses an energy balance for a designated control volume within the urban boundary layer to calculate air temperatures above the urban canopy layer. The calculation uses air temperatures at the different heights provided by the VDM and the rural and urban sensible heat fluxes provided by the RSM and the UC-BEM as input. The UBLM distinguishes the daytime boundary layer from the nighttime boundary layer, as well as the urban-sea breeze circulation, which is induced by the UHI effect and radial in form, from the advection effect of measured wind, which is horizontal and directional in flow.
The UC-BEM calculates urban canopy air temperatures and humidity levels using radiation, precipitation, air velocity and humidity data recorded at the reference weather station, as well as the air temperatures calculated by the UBLM. The model is based on the town energy balance (TEB) scheme developed by Masson (2000) to simulate turbulent fluxes within urban areas, and an integrated building energy model incorporated to more precisely capture the effects of buildings on the urban climate and the urban climate’s effects on urban-scale energy consumption (Bueno, et al., 2012). The energy balance considers heat fluxes from building surfaces and roads, waste heat from HVAC equipment and other anthropogenic heat sources, and the radiant exchange between the urban canyon air and the sky. In order to maintain a low computational cost for simulations, the building energy model takes in assumptions and geometric representations of buildings simplified to a level of achieving a comprehensive BEM; it accounts for solar radiation, heat conduction through the envelope, ventilation and internal gains, as well as indoor humidity and air temperature fluctuation.
20
Figure 3. UWG Engine Components :
the Rural Station Model (RSM), the Vertical Diffusion Model (VDM), the Urban Boundary-Layer (UBL) model and the Urban Canopy and Building Energy Model (UC-BEM). (Bruno Bueno et al., 2012)
The UWG engine has been tested for several climates, and through evaluations against measured data, the performance is found to be satisfactory; the expected error margin is within the air temperature range observed in different locations of the simulated urban area (Bruno Bueno et al., 2012). The engine’s performance is also found to be comparable to counterpart atmospheric weather prediction models that can be computationally expensive; UWG’s computational cost is intentionally maintained at the same order of magnitude as annual building energy simulations (Bueno et al., 2012). The economical computational nature of the engine lends itself well to iterative and parametric workflows that require relatively rapid feedback. The output allows for precise microclimate analysis that can lead to informed planning in the design process. The output can also be applied toward accurate predictions of energy performance at building and neighborhood scales.
a.
b.
c.
21
2.1.1.1.
UWG ParametersThe UWG requires more than 50 parameters that describe an urban site’s morphological and geometrical parameters and a rural reference site’s meteorological statistics that are to be morphed using the given urban site data. These inputs can be categorized into five clusters: building construction, including assembly and glazing; building operations and systems, including internal gains, ventilation and conditioning methods; urban characteristics, including site coverage, anthropogenic heat sources, vegetation properties and boundary layer parameters; and lastly, reference site location, obstacle height, meteorological factors and meteorological factors measurement height.
Various sensitivity analyses conducted over the years via UWG were used to zero in on key factors that contribute the highest impact on the UHI effect in different climates and in different urban configurations (Bueno et al., 2012; Mao et al., 2018; Nakano, 2015; Yang, 2016). The results of these analyses supported the UWG engine calibration - to make it more robust, more physically sound, and more capable of processing detailed building information - and critical for user experience, the sensitivity analyses have led to a reduction in the number of inputs to be entered by the user. UWG parameters are classified as required inputs or as optional parameters. From each of the analyses, parameters classified as required were found to have significant impact on the UHI effect across the climates tested and must therefore be input by users. Parameters found to have minor impact on the UHI effect are considered as optional and have been assigned reasonably estimated values as defaults that can be optionally adjusted by users.
The sensitivity analyses have also concluded that the UHI effect varies locally from place to place, and therefore, parameter sensitivity needs to be considered on a case by case basis (Mao et al., 2017). Bueno et al. (2012) conducted a study for Toulouse and Basel that revealed morphological parameters, specifically horizontal building density and façade-to-site area ratio, to be critical. Additionally, some vegetation parameters were found to be sensitive in the Basel case. Boston and Singapore case studies by Nakano (2015) confirmed the significance of site coverage ratio and façade-to-site ratio, and highlighted sensible anthropogenic heat and building roof material to be relevant, but determined that vegetation impact on the UHI effect in Boston was not captured by the UWG engine. Nakano (2015) also found the reference height of the VDM, which relates to the role of advection in the energy balance of the urban boundary layer, to be significant for Boston
22
and for cities with high wind velocities, although Bueno et al. (2014) resolved that advective heat flux had insignificant impact on the urban boundary layer energy balance. For an analysis completed in Abu Dhabi (Mao et al., 2017), no vegetation parameter was identified as a strong parameter; the authors attributed this to the fact that there is nearly no vegetation for the studied area. The most critical parameters identified by Mao et al. (2017) included the VDM reference height, the UCM-UBL exchange coefficient, the fraction of waste heat directed into the canyon and the winter-season nighttime boundary layer height; these values also happen to be the most uncertain and the most difficult to obtain.
2.1.1.2.
LimitationsA major limitation of the UWG is the number of parameters required to run a simulation. In addition to geometric parameters, urban and reference site morphological parameters are also required and these tend to be difficult to obtain or unknown to many potential users outside of urban climatology field.
The UWG is not engineered to indicate varying UHI intensities within a specified urban site although such a study can be accomplished by parceling a broader urban site into microclimate-scaled pieces. The engine is also not engineered to capture specific building level details that could be captured by conducting a full energy analysis.
Depending on the type of vegetation prevalent on a site, grasses or trees, the method that the UWG engine uses to process vegetation representation may affect the outcome of the simulation. For wind, UWG does not simulate flows, rather it calculates the reduced canyon wind speeds due to obstacles and does not consider wind direction (Yang, 2016). Additionally, absolute humidity in urban area is assumed to be the same as the absolute humidity in the rural area and that is used to calculate the relative humidity in the urban area (Mao, 2018).
The simplifications and assumptions of the model prevent it from capturing very site-specific microclimate effects, particularly for highly heterogeneous urban sites. (Bueno et al., 2014). However, these simplifications contribute considerably to the engine’s computational efficiency.
23
2.1.2.
User InterfacesSince the original development, the UWG has been edited and enhanced by Aiko Nakano (Nakano, 2015), Joseph Yang (Yang, 2016), Jiachen Mao (Mao, 2018) and Ladybug Tools LLC (https://www.ladybug.tools).
Currently, three different functional interfaces allow access to the UWG engine: an Microsoft Excel interface (UWG 4.1) maintained by Jiachen Mao (https://github.com/Jiachen-Mao/UWG_Matlab), a Python programming script (https://github.com/ladybug-tools/uwg), and a plugin for Rhino’s graphical algorithm editor Grasshopper (GH) called Dragonfly (https://www.ladybug.tools/dragonfly.html). The two latter versions are developed and maintained by Ladybug Tools LLC (https://www.ladybug.tools). The Microsoft Excel interface uses the original MATLAB format. This MATLAB code was translated by Ladybug Tools LLC to create the Python programming script and is implemented in the Dragonfly plugin.
2.1.2.1.
WorkflowsThe UWG requires meteorological parameters in the form of an EPW file and an EnergyPlus Weather Data Statistics (STAT) file, and an input file in the form of Microsoft Excel (XLSM), Extensible Markup Language (XML) or Comma Separated Value (CSV) defining the parameters that describe urban geometry, urban morphology and the reference site. The program outputs modified hourly weather data in the form of an EPW file, an open XML spreadsheet (XLSX), or a MATLAB formatted data (MAT) that can be used to extract urban-scale building and climate information.
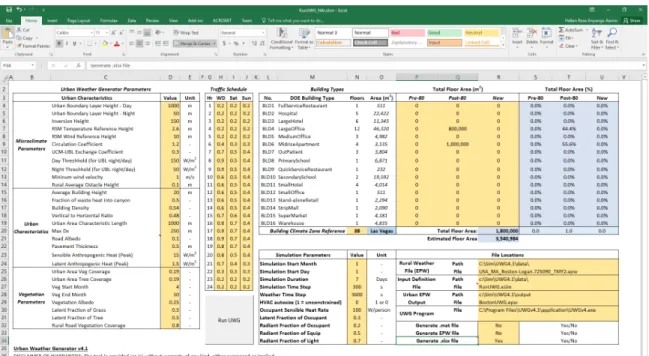
The three UWG versions differ chiefly by user interaction and workflow. The Microsoft Excel interface (Figure 4) requires the user to key in a set of required values in cells categorized by urban and building characteristics, and a set of values that the interface derives from user input via simple calculations. The user must then open the UWG MATLAB code, provide an EPW file, reference the parameter XLSM file and define a save location file path before prompting UWG to run. The output options are XLSX, EPW and MAT formatted data. Apart from interface and interaction, UWG 4.1’s other obstacle to accessibility is purchased license access to MATLAB, a software not commonly used within design workflows.
24
Figure 4. UWG Microsoft Excel Interface
The Python translation by Ladybug Tools LLC requires a parameter CSV file, an EPW file and a save directory. After editing the CSV file, the user must call a generated Python script, which references the required files and directory; via command prompt to execute UWG.
Presently, Dragonfly is the only functional UWG interface with a design-integrated workflow. Aiko Nakano, contributor to UWG 3.0, also recognized the need for the UWG tool within a design platform and developed a standalone interface as well as a plugin coupled with the Urban Modeling Interface (umi) plugin for Rhino, an engine used to simulate urban-scale operational energy, walkability and daylighting (Nakano, 2015). Maintenance, software compatibility issues, and hosting platform updates led to the UWG 4.1 upgrade although Nakano’s accomplishment built the foundation for UWG design platform- and workflow-integration. Dragonfly enables the modeling and estimation of large-scale phenomena such as UHI, climate change, and local climate factors, such as topography, and makes climate variables accessible to a network of analysis tools that rely on climate data as a basis for analysis and simulation. The benefit of hosting UWG within the Ladybug Tools toolkit is to use standardized open formats for data transfer, to build interoperability with other Ladybug tools and to coalesce multiple components to accomplish specific tasks (Mackey & Roudsari, 2017).
25
2.1.2.2.
Tool AccessibilityUWG 4.1 and the Python translation are text-based interfaces that predominantly require manual data entry and have workflows disconnected from those of CAD users, a large population of students, researchers and professionals who would benefit from including the UWG into early phases of urban climate prediction and analysis. The gap in the workflow is having to textually describe geometric parameters that can be extracted from the CAD models already created by CAD users. From the authors’ experiences, this gap, along with the impression that the process may be less intuitive and less user-friendly for some designers, architects, and urban planners, discourages the implementation of the UWG into design analysis and consequently bypasses the iterative design feedback loop that can be engaged due to the computationally inexpensive nature of UWG calculations.
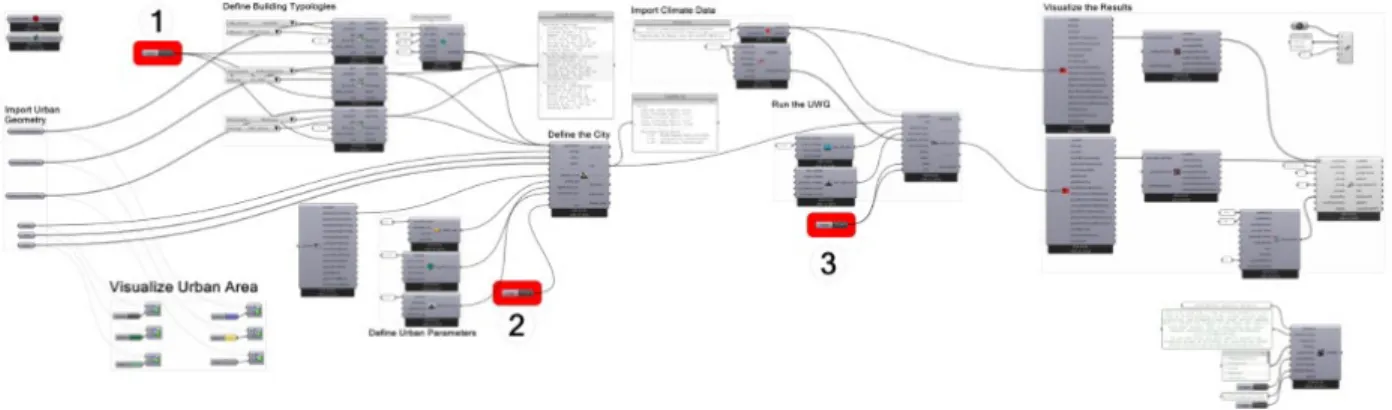
Moderately advanced visual scripting ability is required to run the UWG using Dragonfly, and Ladybug Tools provides sample workflow (Figure 5) with all necessary components (Mackey, 2017). Dragonfly uses GH to collect CAD objects from Rhino, fed in as boundary representation objects (BREPs) and obtains the geometric properties required for UWG parameters. Non-geometric parameters are input via text panels, drop-down selections or Boolean toggle buttons. The components are prepopulated with default values for parameters determined through UWG case studies and sensitivity analyses to have a small magnitude of impact on simulation results once set to initial reasonable estimates (Mao et al., 2017; Nakano, Bueno, Norford, & Reinhart, 2015). This significantly reduces the number of inputs required from the user but all parameters are visible and available for users to set. Values obtained from the interface populate a CSV file that runs UWG upon user command in GH. Dragonfly is a significant development in the process of incorporating UHI and urban climate analysis into an established network of building science tools within the design workflow.
26
Figure 5. UWG Dragonfly Workflow
2.2.
Local Climate Zone Classification SystemTaking the temperature difference between what is classified as rural and what is classified as urban has made a simple framework to define and compare UHI intensity (I. D. Stewart & Oke, 2012). However, the clarity of the definitions for “rural” and “urban” make measuring UHI intensity more complex and sometimes problematic, especially for an entire urban space. Rural and urban environments vary greatly in complexity in each of their scopes. Variability in surfaces and surface roughness, material classifications, vegetation properties and the densities of these spaces all affect readings at both rural and the urban meteorological measurement stations. The contextual setting of a rural station, which is the base point for UHI intensity comparison, is just as important as the urban context.
Urban climate experts Iain Stewart and Timothy Oke introduced the Local Climate Zone (LCZ) classification system as a means to standardize the quantitative physical descriptions of cities in a way that is relevant to observing urban climates. They define a local climate zone as an area of uniform surface roughness and surface cover with a characteristic length of hundreds to several thousands of meters (I. D. Stewart & Oke, 2012). The uniformity of roughness element, buildings and vegetation, and surface cover types, permeable and impermeable, causes LCZ classifications to differ from one another in air temperature regime at one to two meters above ground (I. D. Stewart & Oke, 2012).
27
Other such classification schemes exist; however, the LCZ system is visual and largely based on the standard and quantitative characterizations of urban and rural spaces. The components of the classification have clear definitions for the values and ranges for four categories: the height of roughness features - buildings and vegetation, the density or packing of the roughness features, the permeability and impermeability of surrounding surface cover types, and the thermal admittance of the roughness features’ and surface cover types’ materials (
Figure 6
).Figure 6. LCZ Classification Components (I.D. Stewart, 2011)
2.2.1.
TypologiesThe four defining LCZ components shown in Figure 6 result in numerous typological configurations that describe a range of terrains between the two extremes of rural and urban settings. For example, the urban extreme is a high, densely compact, impervious neighborhood constructed by heavy materials, and the rural extreme is a flat, open, pervious and bare landscape. The LCZ authors formulated a set of 17 likely but generic typologies to be used as the starting point for area classifications (Figure 7). These 17 types are divided into a built category comprising of LCZ numbers 1-10 in the classification, and land cover category - LCZ letters A - G in the
28
classification. The built category is based on predominant constructed features on a single land cover type and the land cover category is based on the parcel’s seasonal or ephemeral features (I. D. Stewart & Oke, 2012).
Figure 7. Standard classified LCZs (I.D. Stewart, 2011)
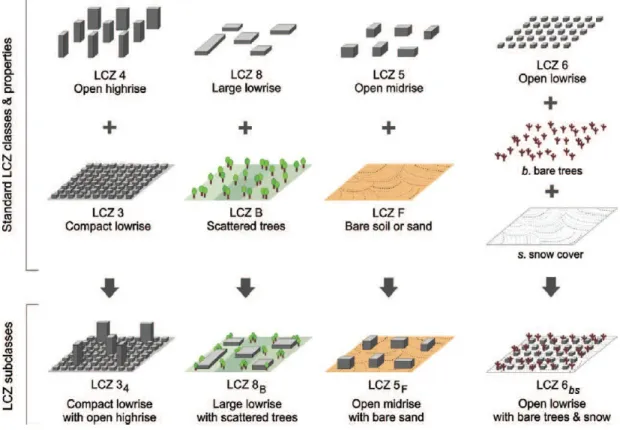
The authors formulated a means to conjoin the standard classes to create new, diversified and varied subclasses that accommodate flexibility. As opposed to the generic and strictly uniform compositions of the 17 standard typologies, the conjoined classes, or subclasses, are able to capture peculiarities and nuanced variations that are common in real rural and urban systems (Figure 8). The subclasses are composed of different mixtures of built types, land cover types and land cover properties of the higher and lower parent classes. The sub-classification system is best for including secondary features that are assumed to affect local climate and improve comparison of a particular site with other studies. For example, sub-classification allows temporal flexibility for studies focused on monthly, weekly or daily scales, or for studies that have features that change significantly with weather pattern i.e. snow covered ground, agricultural practices i.e. barren ground or seasonal changes i.e. wet, water-logged ground (I. D. Stewart & Oke, 2012). The authors advise against too many or too complex sub-classifications for the purpose of enhancing the physical site description because these undermine the principal function and may not result in observations significant difference from any parent class involved (I. D. Stewart & Oke, 2012).
29
Figure 8. LCZ Subclasses with combined built and land cover types
(I. D. Stewart & Oke, 2012) ©American Meteorological Society. Used with permission.
The key advantage of the LCZ classification system for UHI studies is that it clarifies the definitions of the terms “urban” and “rural” as typically used in UHI analyses thereby creating a framework for the standardization of urban temperature observations (I. D. Stewart & Oke, 2012). Because the system is based heavily on standard and defined geometric characterizations, urban spaces and rural areas are straightforwardly organized by where they fall on the spectrum.
30
2.3.
UWG and LCZThe LCZ framework is suitable for coupling with UWG because the difficult-to-obtain urban morphological parameters necessary for UWG simulation can be extracted through this classification system. From the observations made for each LCZ, a range of values is observed for sky view factor, aspect ratio, mean building or tree height, terrain roughness class, building surface fraction, pervious and impervious cover, surface admittance, albedo and anthropogenic heat flux. A combination of the first seven properties can be used categorize a given site’s LCZ class. Thereafter, the last three properties, which are relevant for UWG inputs, can be extracted and used to complete simulations.
This classification scheme was proposed as a more accurate framework for UHI effect studies. The property ranges defined by the authors are determined from urban climate studies and observations and are a better and more reliable means of estimating unknown urban morphological parameters. Additionally, there is an ongoing effort by World Urban Database and Access Portal Tools (WUDAPT) to map cities according to the LCZ scheme ( www.wudapt.org/). Through a mapping tool published on their website, one can access LCZ maps available for various regions worldwide as they progressively become mapped. This means that LCZ parameters will increasingly become readily available and accessible information for microclimate studies.
A full definition and description of these parameter values can be found in the appendix of Local Climate Zones for Urban Temperature Studies (I. D. Stewart & Oke, 2012). Table 3 in the appendix C of this documents displays LCZ properties.
31
3.
Urban Weather Generator for Rhino
The UHI effect presents an urban design challenge, but only recently has there been a platform for design workflow integration. Despite existing engines that accurately evaluate UHI intensity in urban environments, architects, designers, and urban planners have often not incorporated such simulation into microclimate studies due to prohibitively expensive computational costs, disconnected workflows within unintuitive or unfamiliar platforms, and uncertainty of difficult-to-obtain urban climatology parameters. These hindrances cause impactful delay within the design feedback loop and often generate a lack of confidence in the simulation process and output. The proposed tool, UWG for Rhino, is a CAD integrated GUI for the UWG. The goal is to make the powerful and computationally cheap engine accessible to design workflows by incorporating it as a plugin within the conventional design software Rhino 3D, and by coupling it with the LCZ classification scheme. The proposed update automates geometric parameter extraction through Rhino 3D and implements a reliable means of urban morphological parameter estimation through the LCZ scheme.
3.1.
Integration into Rhino and Use InteractionUWG for Rhino runs the Python translation of the original UWG MATLAB code completed by Ladybug Tools LLC (https://github.com/ladybug-tools/uwg). The Python programming application is more accessible than the MATLAB version because it does not require a license purchase. The plugin is programmed within Rhino version 6, which hosts a built-in developer
32
platform, Rhino.Python, used for cross-platform scripting (McNeel, 2019b). Rhino.Python applications operate on both Windows and Mac systems. The platform allows access to exclusive functions used within Rhino software that are otherwise inaccessible. It also offers Eto controls (McNeel, 2019a), an open source cross-platform dialog box framework unavailable to older Rhino versions, that is used to achieve a GUI consistent with the Rhino interface design.
UWG for Rhino handles geometric parameters the same way that Dragonfly does. It extracts geometric building properties such as height, footprint, floor area, and façade area, and geometric urban properties, such as land area, characteristic length and average obstacle height. From these properties, it is able to calculate building density, site coverage ratio, and façade-to-site ratio as well as generate weighted averages for building program and age so that users must not manually calculate and record these parameters.
3.1.1.
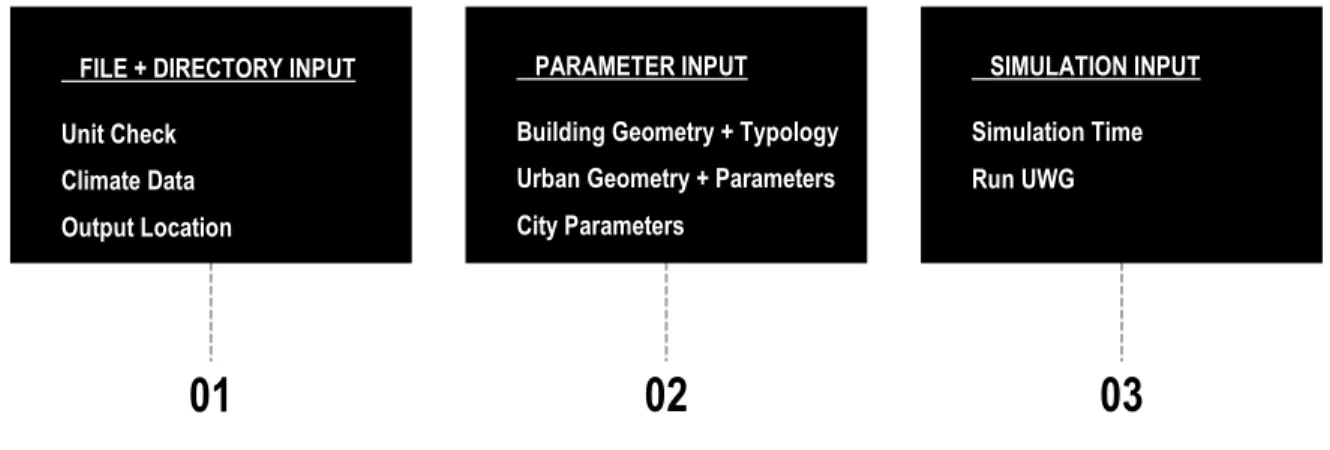
Graphical User InterfaceThe GUI is clustered into three parts: (01) preliminary input, (02) parameter input and (03) simulation input as shown in Figure 9.
Figure 9. UWG for Rhino Input Framework
The preliminary inputs include import of climate data and the selection of an output directory for the resulting EPW file (01 in Figure 9). In this stage, there is a unit check, and conversion is possible, to assure the user is in metric units. The parameter input part is subdivided into three parts: selection of urban geometry and definition of building typology, definition of urban parameters and
01
FILE + DIRECTORY INPUT Unit Check
Climate Data Output Location
02
PARAMETER INPUT Building Geometry + Typology Urban Geometry + Parameters City Parameters
03
SIMULATION INPUT Simulation Time Run UWG
33
definition of city parameters (02 in Figure 9). The simulation input is where the user can execute UWG after entering simulation run time (03 in Figure 9).
3.1.1.1.
File and Directory InputThe first step is to prompt the user to input the necessary climate files: an EPW file as well as a STAT file. These can be downloaded directly from the U.S.DOE EnergyPlus website (https://energyplus.net/weather) via the provided “Download files” (Figure 10) or input from a local directory with the “Files on computer” (Figure 11) option. Next, the Rhino 3d file unit setting is checked. The user is warned in the case which a unit conversion must be completed.
Figure 10. EPW + STAT File Input
34
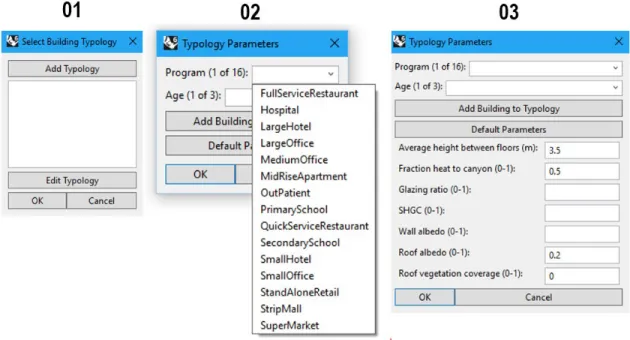
3.1.1.2.
Building and Urban Parameter InputThe second step of the process is to input simulation parameters. Under the typology parameters tab (Figure 12), users can select 3D geometry to define the building typologies. Users can define buildings by selecting the geometry on the Rhino 3D work plane and clicking on “Add
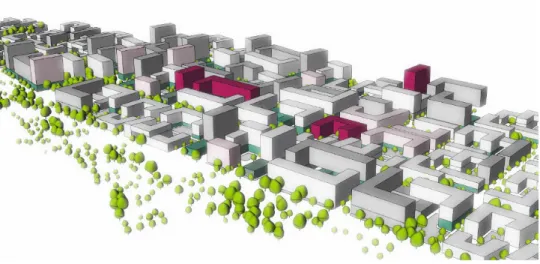
Typology” (01 in Figure 12). The selections can then be tagged as one of the U.S.DOE reference building types (https://www.energy.gov/eere/buildings/commercial-reference-buildings) and according to age (02 in Figure 12). All non-key parameters can be edited under the “Default Parameters” button (03 in Figure 12). Selected buildings are itemized under the “Select Building Typology” window (01 in Figure 12), and are displayed to the user via color scheme by reference type and color fade for age on the Rhino work plane (Figure 13).
35
Figure 13. Rhino 3D Canvas Building Selection
Under the urban parameters tab, users select geometry and adjust parameters relating to vegetation (01 and 02 in Figure 14), and traffic parameters (03 in Figure 14). This input tab includes anthropogenic sensible heat flux and has a slider input to adjust traffic schedules.
Figure 14. Urban Parameters
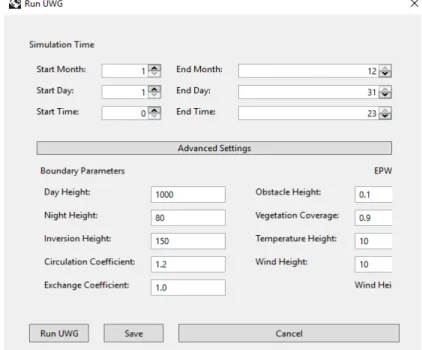
3.1.1.3.
Simulation Parameter InputThe “Run UWG” tab is where the user can execute UWG (
Figure 15
). Here, simulation dates and time are defined to execute UWG. Additionally, one can enter advanced parameters regarding the boundary layer and the reference rural site.36
Figure 15. Run UWG Window
3.2.
WorkflowIn order to produce a morphed EPW weather data file, UWG requires climate data, informs of EPW and STAT files, a description of the reference site where the rural meteorological measurements are taken, and descriptions of the urban site and the urban morphology (
Figure 16
).37
3.2.1.
Current WorkflowsThe current Microsoft Excel and Python versions are text-based interfaces that predominantly require manual data entry and have workflows disconnected from those of CAD users, a large population of students, researchers and professionals who would benefit from including UWG into early phases of urban climate prediction and analysis. The user starts with an urban site to be analyzed and must textually describe urban geometry and urban morphological parameters in order to input that information into the UWG (Figure 17). Once UWG produces a morphed weather file, if the user changes the urban site based on findings from other studies, such as microclimate analysis, the user must again textually describe urban geometry and urban morphological parameters in order to reprocess the simulation (Figure 17).
Figure 17. Current Design Workflow of Text-based UIs
The gap in the workflow is having to textually describe geometric parameters that can be extracted from the CAD models already created by CAD users. From the authors’ experiences, this gap, along with the impression that the process may be less intuitive and less user-friendly for some designers, architects, and urban planners, discourages the implementation of UWG into design analysis. Consequently, the iterative design feedback loop that can be engaged due to the computationally inexpensive nature of UWG calculations is bypassed.
38
3.2.2.
Proposed WorkflowUWG for Rhino is a design-integrated workflow alternative complementary to Dragonfly, the other functional UWG GUI. Whereas Dragonfly has a customizable workflow with modularized and interoperable components within the GH interface, UWG for Rhino is conceived for a simple and standard workflow. The goal is to further broaden the user base by eliminating, GH, an additional platform which is integral to the principles of Dragonfly as a part of the Ladybug Tools toolkit but not necessary for this purpose. The goal is to make UWG an intuitive, user-friendly and straightforward process for Rhino users, especially those who are not acquainted with visual scripting in GH. The workflow is narrowed to examining UHI and other microclimate aspects as an iterative optimization process rather than an exploratory process that allows users to craft the modular components and address multiple issues. Such dual interface functionality can be seen in other building science tools, such as DIVA for Rhino and DIVA for GH developed by Solemma to run the same background engine and produce the same results through different workflows and interfaces for users with different capabilities within the Rhino platform (“Solemma LLC,” 2019).
3.2.2.1.
Geometric Parameter ExtractionBy adding Rhino 3D to UWG, the textual description component of the existing workflow can be eliminated (Figure 18). The workflow can therefore, not only be significantly reduced (Figure 19) but transformed into a cyclical and iterative process ( Figure
20
) that is more compatible with a design feedback loop.39
Figure 19. Rhino 3d reduced workflow
40
3.2.2.2.
Morphological Parameter ExtractionBy coupling UWG for Rhino, the workflow can reduce the error margins associated with morphological parameter input uncertainty. This involves a three-step method (Figure 21):
1. Read the average site building height, site-coverage ratio and façade-coverage ratio from UWG for Rhino (01 in Figure 21).
2. Classify the LCZ class based on the above site properties (02 in Figure 21).
3. Extract surface admittance, surface albedo and anthropogenic heat flux for UWG for Rhino simulation (03 in Figure 21).
41
4.
Design-Integrated Urban Analysis
The purpose of this analysis is to identify the impact of UHI effect on cooling and heating energy intensity for a set of proposed urban design iterations by comparing the carbon intensity and cost of electricity of each proposal. The urban design iterations were generated in collaboration with the architectural firm Kohn Pedersen Fox’s (KPF) Urban Interface and Environmental Performance groups. The idea is to provide UHI intensity as a useful metric for multi-dimensional urban performance analysis.
4.1.
OverviewOut of a pool of 1,000 models, eight are selected as candidates for simulation and are tested in the five cities in different ASHRAE climate zones indicated on Figure 22. The models have the same floor-area-ratio ((FAR) of 3.6) distributed over an area that is 1.75 by 0.72 kilometers. The mixed-use building typology ratio is consistent (60% commercial, 30% residential and 10% retail). The vegetation coverage ratio is varied (10% or 30%), therefore dividing the eight models into four sets. Each set (numbered 1 through 4) contains one iteration with 10% vegetation coverage (Group A) and a second with 30% vegetation coverage (Group B); the horizontal and vertical density distribution changes accordingly.
The methodology, tested model set and simulation parameters are described in Chapter 4.2. The results and findings are presented in Chapter 4.3.
42
Figure 22. ASHRAE Climate Zones
4.2.
MethodologyTo generate the modified EPW for each of the eight models, the three-step UWG for Rhino and LCZ workflow described in Chapter 3.2.2 is implemented (Figure 23). To determine neighborhood-wide cooling and heating energy use intensity (EUI), the original, rural EPW and the modified, urban EPW is applied to each of the eight models in the Urban Modeling Interface (umi) software. To determine carbon intensity, the grid emissions for each city is retrieved from the Emissions and Generation Resource Integrated database (US EPA, 2018). To determine cost, the average price of electricity to customers is retrieved from EIA (US EIA, 2019).
43
4.2.1.
Tested Model SetsFigure 24. Iteration 1
44
Figure 26. Iteration 3
Figure 27. Iteration 4
Expanded model information is attached in Appendix A, Tested Model Sets Expanded Information.
45
4.2.2.
Simulation ParametersTable 1. UWG Simulation Parameters
Parameter Unit Value
Urban Parameters
Vegetation Albedo Vegetation Start Month Vegetation End Month Tree Latent Fraction Grass Latent Fraction Road Albedo
Road Pavement Conductivity Road Volumetric Heat capacity Road Thickness - - - - - - - W/mK J/m3K m LCZ Input1 Climate Input2 Climate Input2 0.7 0.5 LCZ Input1 1 1600000 0.21 Traffic Parameters
Non-building Sensible Heat Weekday Schedule Saturday Schedule Sunday Schedule W/m2 - - - LCZ Input3 See Figure 28 See Figure 28 See Figure 28
Boundary Layer Parameters4
Daytime Boundary Layer Height Nighttime Boundary Layer Height Vertical Profile Inversion Height Circulation Coefficient Exchange Coefficient m m m - - 1000 80 150 1.2 1
Reference Site Parameters
Obstacle Height Vegetation Coverage Temperature Height Wind Height m - m m 0.1 Climate Input5 10 10 Simulation Parameters Start Month End Month Start Day End Day - - - - 1 12 1 31
1. Table 3. LCZ Properties for used typologies (I. D. Stewart & Oke, 2012) 2. Calculated by estimating 1st month which outdoor temperature is greater than 10°C
3. 45.2% of Anthropogenic heat from Table 3. LCZ Properties for used typologies (I. D. Stewart & Oke, 2012) according to (Sailor, 2011).
4. (Mao, 2018)
46
Table 2. UWG Building Typology Parameters
Parameter Unit Value
Commercial 60% Residential 30% Retail 10%
Age Floor Height1 Glazing Ratio1 SHGC1 Wall Albedo2 Roof Albedo2 Roof Vegetation Canyon Heat Fraction4
- m - - - - - - New Construction 4 0.36 Climate Input LCZ Input LCZ Input 0 0.5 New Construction 3 0.15 Climate Input LCZ Input LCZ Input 0 0.5 New Construction 6 0.1 Climate Input LCZ Input LCZ Input 0 0.5 1 Deru et al., 2011
2 Table 3. LCZ Properties for used typologies (I. D. Stewart & Oke, 2012) 3 U.S.DOE, 2012
4 Dragonfly
Table 3. LCZ Properties for used typologies (I. D. Stewart & Oke, 2012)
Parameter Unit Value
LCZ 02 Compact Midrise LCZ 04 Open High-Rise
Range Median Range Median
Sky View Factor Canyon Aspect Ratio Average Building Height Terrain Roughness Class Building Surface Fraction Impervious Surface Fraction Pervious Surface Fraction Surface Admittance Albedo
Anthropogenic Heat Flux
% - m - - - - - - 0.2 – 0.6 0.75 – 1.5 3 – 10 6 0.4 – 0.7 0.2 – 0.5 0.0 – 0.3 1500 – 2200 0.1 – 0.2 0 - 75 0.45 1.375 17.5 - 0.55 0.4 0.1 1850 0.15 37.5 0.5 – 0.7 0.75 – 1.25 25+ 7/8 0.2 – 0.4 0.3 – 0.4 0.3 – 0.4 1400 – 1800 0.12 – 0.25 0 - 50 0.6 1.0 25+ - 0.3 0.35 0.35 1600 0.185 25
47
Figure 28. Traffic Schedule
4.3.
Results and FindingsAn analysis of the UHI effect has been conducted for the eight models listed in Chapter 4.2.1 using UWG for Rhino and the workflow described in Chapter 3.2.2. The original rural EPW file and the modified urban EPW file generated from the simulation are used to determine the UHI effect’s impact on temperature observations and cooling and heating EUI. The impact of vegetation is assessed through a comparison of the cooling and heating EUIs generated from the urban EPW files. In a concluding comparative analysis, the performance of each model in each climate is evaluated by comparing calculated carbon intensity and electricity cost.
4.3.1.
Model ResultsFor each iteration, a result sheet is produced containing:
1. UHI intensity displayed by a plot of monthly average diurnal temperature and a plot of monthly average diurnal temperature difference between rural and urban locations. 2. Plots of monthly cooling and heating EUI and monthly cooling and heating EUI difference
between rural and urban locations displays EUI. The plots are displayed below.
0 0.2 0.4 0.6 0.8 1 1 2 3 4 5 6 7 8 9 10 11 12 13 14 15 16 17 18 19 20 21 22 23 24 Fra ct ion Hour
88
4.3.2.
Climate ImpactThe impact UHI intensity has on temperatures can be observed in section 1. UHI Intensity on the result sheets produced for each graph in Chapter 4.3.1.
4.3.2.1. Temperature
For warm climates, like Houston and Atlanta, the impact that UHI intensity has on temperatures is straightforward, resulting in consistently increased temperatures year-round. For the tested models, the highest intensities reach near 3°K. The reverse UCI effect in these warm climates is observed to reduce temperatures less than 0.5°K year-round. For Seattle and Chicago, the warmest months, experience near 2.5°K increase while cooler months experience less than 1°K increase. For Seattle, an UCI effect is observed at less than 0.5°K year-round, while in Chicago, the UCI intensity can be observed to near 1°K for some on the tested models. For New York, UHI intensity measures at an unexpectedly lower intensity than for the other climates considered in this study. On average, the year-round temperature increase remains less than 1°K, and the UCI intensity is observed at less than 0.5°K for only a few months of the year.
4.3.2.1. Rural Reference Location
For Houston, Atlanta, Seattle and Chicago, the temperature differences observed from the tested models are not surprising. For New York however, the anomaly of lower than anticipated UHI intensity can perhaps be explained by examining the rural reference measurement locations. The airport EPW files selected for the rural reference locations in Houston, Atlanta, Seattle and Chicago are located within different built contexts than the New York rural reference location. The former airport locations (Figure 29 - Figure 32) can be classified as LCZ 08 Large, Low-Rise and are predominantly surrounded by LCZ 06 Open Low-Rise and LCZ 09 Sparsely-Built. The airport location for New York (Figure 33) can also be classified as LCZ 08 Large, Low-Rise; however, the built surroundings are predominantly LCZ 03 Compact Low-Rise. It is speculated that because the rural reference file for New York is more “urban” than it is “rural”, the UHI intensity between the urban models tested (LCZ 02 Compact Midrise and LCZ 04 Open High-Rise) and the New York reference file (LCZ 08 and LCZ 03) is less significant. If the New York reference file was in the
89
same contextual environment (same LCZ surroundings) as the other four climates, the magnitude of UHI intensity could be of comparable significance. A list of abridged LCZ definitions is attached in Appendix B. Local Climate Zones Abridged Definitions.
Figure 29. William P. Hobby Airport, Houston
Figure 30. Hartsfield-Jackson Atlanta International Airport, Atlanta
Hobby, Houston
90
Figure 31. Seattle-Tacoma International Airport, Seattle
Figure 32. O'Hare International Airport, Chicago
Tacoma,
Seattle
91
Figure 33. LaGuardia Airport, New York
4.3.2.3. Wind and Water Observations
The presence and the effects of large bodies of water on the microclimate of the rural reference location cannot be ignored. An in-depth analysis of the impact is not considered in this study, however, a brief wind analysis is completed for the two sites affected by the presence of large bodies of water.
For Seattle, winds are prevalent from the southwesterly and northeasterly directions (Figure 34). These directions respectively point to the open corridors created by Lake Washington and the Puget Sound inlet from the Pacific Ocean, which border the city of Seattle. Since the Seattle-Tacoma airport is not isolated outside of the general city boundaries and since the city of Seattle is relatively small, wind conditions at the airport generally describe wind conditions within the city. Though not conclusive, it can be presumed that the effects of winds from the surrounding bodies of water is even throughout the city and not a special condition particular to the rural reference. This means that the rural reference file is suitable for UHI intensity studies for Seattle.
92
Figure 34. Seattle-Tacoma, Seattle Wind Wheel
New York has a more complex condition than Seattle does because of its relatively large size. There are three EPW files provided by the U.S. DOE for New York City: Central Park, John F. Kennedy International Airport and the LaGuardia file selected for this study. The Central Park file was eliminated due to its very specific siting and location within extremely “urban” conditions. Though the park’s LCZ classification would fall under more the “rural” LCZ typologies, it is hard to argue that its entire context is “traditionally rural” when compared to the other cities considered in this study. The John F. Kennedy International Airport file was eliminated due to its relatively far distance from the core of the city and the strong exposure to the conditions Jamaica Bay and the North Atlantic Ocean to the south.
In this study, LaGuardia Airport seems more suitable for UHI intensity observations due to its relative proximity to the core of New York City, which is the interest area of this study, and due to the almost evenly distributed wind influence from its contextual surroundings. Winds are prevalent from northeasterly directions and from south to northwesterly directions (Figure 35). These directions point to East River and Long Island Sound to the northeast, and to the densely built landmasses south, west and north of LaGuardia Airport. It can be presumed that there is a reasonable mixture of conditions from the contextual surroundings that are carried in by the wind conditions to this “rural” reference measurement station.