DEVELOPMENT OF A HIGH-PRECISION
ADS-B
BASED CONFLICT ALERTING SYSTEM FOR
OPERATIONS IN THE AIRPORT
MAMQ~w:S
-SAHU- SI.sflJENVIRONMENT
byFabrice Kunzi
MASSACHUSETS INSTTUTE. OF TECHNOLOGYMAR
2
0 2014
LIBRARIES
B. Sc. Mechanical Engineering, University of North Dakota, 2008
M. S. Aeronautics & Astronautics, Massachusetts Institute of Technology, 2011 Submitted to the Department of Aeronautics & Astronautics
in Partial Fulfillment of the Requirements for the Degree of
Doctor of Philosophy
at the
Massachusetts Institute of Technology
October 2013© 2013 Massachusetts Institute of T chnology. All rights reserved.
7-Author:
Certified by:
Certified by:
Fabrice Kunzi Department of Aeronautics & Astronautics October 4th, 2013 Pro .John Hansman Professor ol ferona ics,& Astronautics, MIT Prof. Hamsa Ralakrishnan Dw-rFcora-oAronauties1AstrpOtjtics, MIT Certified by:
Certified by:
~LDr.
JaniesKuchar
i Linq 1,Labo atory Xjr. Tom Reynolds LIITA*incoln Laboratory Accepted by:
Lytan H. iviodiano
DEVELOPMENT OF A HIGH-PRECISION
ADS-B
BASED CONFLICT ALERTING SYSTEM FOR OPERATIONS IN THE AIRPORT ENVIRONMENTby
Fabrice Kunzi ABSTRACT
The introduction of Automatic Dependent Surveillance - Broadcast (ADS-B) as the future source of aircraft surveillance worldwide provides an opportunity to introduce high-precision airborne conflict alerting systems for operations in high-density traffic environments. Current alerting systems have been very successful at preventing mid-air collisions in the en-route environment but have limited benefit in high-density environments such as near airports where most mid-air collisions occur (59%). Furthermore, introducing an ADS-B-enabled conflict alerting system generates an incentive for General Aviation users to voluntarily equip with ADS-B avionics.
The work presented in this thesis describes the process followed to develop an ADS-B-enabled, high-precision conflict alerting system. This system will be the basis for the international certification standard guiding future implementations of such systems. The work was conducted as part of the larger development effort of the Traffic Situation Awareness with Alerting (TSAA) ADS-B application.
As a first step, a set of 18 high-level system requirements was identified based on a stakeholder analysis and review of mid-air collisions that occurred over the last 10 years. An alerting algorithm was then developed based on the system requirements that builds on the precedent set by current alerting systems but takes advantage of the improved state information available via ADS-B. The distinguishing factors of the algorithm are its use of a constant turn rate trajectory prediction and its consideration of the current and predicted encounter geometry in the alerting decision.
Next, a method to tune the performance of the algorithm was developed and demonstrated. The method applies the Latin hypercube sampling approach to generate a large set of different algorithm implementations, which were then evaluated by simulating the alerting performance on a representative data set of airborne encounters. Lastly, the method introduced an approach to evaluate and "visualize" the five-dimensional performance space defined by the five performance metrics of interest for alerting
systems.
Using the tuned algorithm, a flight test program was conducted. The performance of the algorithm during the flight test was analyzed in-depth and compared to the expected performance. Given the insights from the tuning and the flight test, additional alerting logic was introduced to the basic algorithm, which
significantly improved overall alerting performance.
The performance of the final system implementation is significantly better or equal to that of the current industry standard for all five performance metrics. The nuisance and overall alert rate were each reduced
by a factor of more than 4 and the average time of alert before the closest point of approach increased by 6 seconds as compared to current systems. Enabled by this performance improvement, TSAA introduces
reliable collision alerting to the Airport Environment where most of today's mid-air collisions occur and where today's alerting systems are of limited benefit due to high rates of nuisance alerts.
ACKNOWLEDGMENTS
Many highly competent people that cannot go unmentioned supported the work presented in this thesis. It is in large part because of their efforts that the project was a success.
At MIT, the mentoring, guidance and support of John Hansman has been invaluable to the project as well as to me personally. I am very grateful for everything that he has done for me. Also at MIT, Sathya Silva and HongSeok Cho were a tremendous team for conducting the Human Factors evaluations for TSAA. During the initial phase of the project, Maxime Gariel provided great guidance for the algorithm development. Thanks are also in order for the members of my PhD thesis committee - Hamsa Balakrishnan, Jim Kuchar and Tom Reynolds - who brought very helpful perspectives to my work, significantly improving the final quality of this thesis.
At the FAA, the skillful management of the entire TSAA project by David Gray was the reason the project was able to achieve an aggressive schedule and deliver a usable product. Additionally, the input and support of Doug Arbuckle and Don Walker was always beneficial. It is great to know that the FAA has such highly capable individuals leading the upgrade of the national airspace system under NextGen.
At MITRE, Dave Elliott, Doug Havens and Kara MacWilliams were instrumental during the performance and safety analysis of TSAA. They helped share the load of all the analysis that was required for TSAA; a task that I could not have achieved by myself.
At Avidyne, the project received significant support from Ted Lester, Dean Ryan, Duane Ott, Mike Keirnan and Trevor Steffensen.
Additional help came from Mykel Kochenderfer who served as a reader and taught me the correct way to think about uncertainty, from Jim Duke who brought the commercial pilot's view to the table, and by the member of RTCA Special Committee SC-186's WG4, who represented the interest of the international community during the standards development. Lastly, but most importantly, my wife Alyssa is the reason that I didn't loose my mind over the last years. I feel very blessed and honored to have her by my side, ready and willing to help me think through tough engineering problems, edit papers and presentations and pick me up at the lab at ungodly hours of the night. You are incredible - thank you for everything you do for me.
TABLE OF CONTENTS
Chapter 1 Introduction and Motivation ... 23
1.1 The Systems Engineering Approach to the Development TSAA ... 25
1.2 Thesis O utline and Overview ... 26
Chapter 2 Background and Literature Review... 29
2.1 General Representation of the Alerting Problem and Alerting Systems ... 29
2.2 Uncertainty in Predictive Alerting Systems ... 31
2.2.1 Current State U ncertainty... 32
2.2.2 Future State U ncertainty ... 33
2.2.3 Approaches to Reducing Effects of Current and Future State Uncertainty.... 33
2.3 Airborne Collision Alerting Systems Currently in Use... 36
2.4 Introduction of ADS-B as Part of the Next Generation Air Transportation System (N e x tG e n ) ... 3 8 2.4.1 Co-Dependency of ADS-B User Benefits and ADS-B Mandate... 42
2.5 ADS-B and Conflict Alerting System s ... 45
2.5.1 Early Research Related to ADS-B based Collision Alerting Systems... 45
2.5.2 TSAA ADS-B Application in the Context of NextGen ... 46
2.5.3 Development of a Certification Standard for TSAA ... 46
Chapter 3 Definition of High-Level TSAA System Requirements ... 49
3.1 Identification of Stakeholder Requirements: General Aviation Users and A irw orth in ess A u th orities ... 4 9 3.1.1 General Aviation as a Group of Stakeholders ... 50
3.1.2 Airworthiness Authorities and Standards-Setting Bodies ... 53
3.2 Identification of Functional Requirements for TSAA: Analysis of 10 years of Mid-A ir C o llisio n D ata ... 5 4 3.2.1 Analysis Of NTSB Accident Reports Of Mid-Air Collisions ... 55
3.2.2 Analysis Of ASRS And NMACS Database Near Mid-Air Collision Reports... 55
3.2.3 Results From NTSB Report Analysis ... 56
3.2.4 Results From The ASRS And NMACS Database Analysis... 61
3.2.5 Derivation Of Functional Requirements... 64
3 .3.1 Interface D efin ition s ... 69
3.3.2 Conformity To Previous Standards and Interoperability With Pre-E x istin g Sy stem s...7 3 3.4 Identification of Performance Requirements for TSAA ... 75
3.4.2 Definition Of a Performance Standard For Alerting System Evaluation ... 77
3.4.3 Definition Of Technical Performance Metrics For TSAA... 79
3.5 Considerations on Potential Interactions between TSAA and Collision Avoidance S y ste m s ... 8 2 3.6 Summary of High-Level System Requirements Identified for TSAA ... 85
Chapter 4 Design of the Exemplar TSAA Algorithm... 89
4.1 Conceptual Introduction to the TSAA Exemplar Algorithm...90
4.2 Interface Definitions for the Exemplar TSAA Algorithm ... 93
4.3 Mathematical Description of the Exemplar TSAA Algorithm ... 96
4 .3.1 T SA A in U p date M od e ... 9 7 4 .3.2 T SA A in D etect M ode ... 9 8 4 .3.3 C onflict Search E ngin e...10 1 4.4 Summary of Internal Algorithm Parameters ... 105
4.4.1 H ard-coded Param eter Settings...107
Chapter 5 Development of Algorithm Tuning And Performance Evaluation M eth o d ... 1 0 9 5.1 Trading Multiple Competing Performance Metrics ... 110
5.2 General Set-Up of the Parameter Tuning Problem...110
5.3 Conceptual Description of the TSAA Algorithm Tuning Method ... 112
5.4 Step 1: Parameter Space Sampling Method...113
5.4.1 The Latin Hypercube Method to Efficiently Sample the TSAA Parameter H y p e rcu b e ... 1 1 4 5.5 Step 2: Suite of Tools for Algorithm Performance Simulation ... 116
5.5.1 E n cou nter D ata Sets ... 1 16 5.5.2 ADS-B Source Emulator and Performance Degrader...122
5.5.3 Model Parameters Used for ADS-B, ADS-R and TIS-B Targets ... 134
5.6 Step 3: Analysis of Algorithm Behavior and Visualization of Performance in the P erfo rm an ce Sp ace...14 1
5.6.1 Visualization Tools to Visualize the Performance Space...141
5.6.2 Generation of High Order Model Representation Based On Multivariate P erfo rm an ce D ata ... 14 5 Chapter 6 Application of Performance Evaluation and Tuning Method to Sample T SA A A lgorithm ... 149
6.1 Simulation of Encounters and Generation of Performance Data ... 150
6.1.1 Generating Parameter Combinations using the Latin Hypercube Method.. 150
6.1.2 Configuring the Simulation Tool: Data Sets and Nominal Targets...151
6.1.3 Size of Scoring Zones used for Performance Evaluation ... 152
6.2 Final Selection of TSAA Algorithm Parameters ... 152
6.2.1 Data Generation and HDMR Model Fitting ... 152
6.2.2 Identification of High Impact Algorithm Parameters ... 155
6.2.3 Evaluating Parameter Trade-Offs for High-Impact Parameters ... 157
6.2.4 TSAA vS Parameter Selection ... 165
6.3 Analysis of TSAA Algorithm Performance with Tuned Parameters ... 167
6.3.1 Comparison of TSAA Performance to TCAS I (TAS) Performance ... 167
6.3.2 Nuisance Alerts Due To Noise in The Estimated Turn Rate ("Trajectory W a g g in g ") ... 1 7 0 6.3.3 Identification of Causes for Missed and Late Alerts ... 171
6.4 Limitations of TSAA Performance Simulation...173
Chapter 7 System Evaluation And Flight Test... 175
7.1 Overview of the Flight Test Program ... 176
7.1.1 Checkout of Prototype Avionics with the TSAA algorithm...176
7.1.2 Human Factors Evaluations - Scripted Encounters and Targets of O p p o rtu n ity ... 1 7 8 7.1.3 High Performance and Helicopter Tests at the FAA's William
J.
Hughes T e ch n ical C en ter...1 7 9 7.1.4 Flight Test Implementation of TSAA...1817.1.5 Logging of TSAA Flight Test Data ... 181
7 .2.1 A n alysis A p p roach ... 18 2
7.2.2 Overall Prototype Alerting Statistics ... 182
7.2.3 Nuisance Alert Performance during Flight Test ("Wrap Around" Alerts) .... 183
7.2.4 Average Alert Time for Alerts Issued during Flight Test ... 185
7.3 Comparison of Flight Test Performance to the Performance Expected from S im u la tio n ... 1 8 6 7.3.1 Note on Differences Between Implementations ... 187
7.3.2 Overall Comparison of Alerting Performance...188
7.3.3 Analysis of Encounters with First Alert Time Difference > 5.5 sec ("Re-A cq u isitio n Sn ap s")...18 9 7.3.4 Analysis of Encounter where only one System Alerted...191
7.3.5 Summary Performance Comparison...191
Chapter 8 Addressing Undesirable TSAA Algorithm Behavior Identified During Fligh t T est ... 19 3 8.1 Enhanced TSAA Avionics Architecture To Prevent Trajectory Wagging and Re-A cq u isitio n Sn ap s...1 9 4 8.2 Improved Alerting Logic To Prevent Wrap-Around Alerts And Alerts Due To T rajecto ry W agging ... 19 6 8.2.1 Derivation of Additional TSAA Logic ... 197
8.3 Re-Evaluating TSAA Sample Algorithm Parameter Combination with New Logic.. 199
Chapter 9 Summary and Conclusions ... 205
9.1 Summary of the Development of TSAA ... 205
9.2 Major Components of the Development Effort ... 208
9.2.1 TSAA Exemplar Algorithm As A Future Certification Standard...208
9.2.2 Development of a Method To Tune Alerting Systems ... 208
9.2.3 Comprehensive Characterization of ADS-B Surveillance Uncertainty...210
9.2.4 Approach to Score Alerting System Performance...211
9.2.5 Expansion of Kuchar's Visualization of the Performance Space...212
9 .3 C o n clu sio n ... 2 1 3 9 .3 .1 F u tu re W o rk ... 2 1 5 Appendix A Overview of the US ADS-B System Architecture ... 227
Appendix B Identifying Historical Interactions Between Collision Alerting
Systems and Collisions Avoidance Systems... 241 Appendix C MATLAB Code of Sample TSAA Algorithm ... 245
LIST OF FIGURES
Number Page
Figure 1-1: Required Traffic Alerting and Avoidance Systems... 23
Figure 1-2: The V-Model Systems Engineering Framework Adapted for TSAA... 25
Figure 1-3: Major Thesis Components and Their Relationship... 26
Figure 2-1: State-Space Representation of the Alerting Problem... 30
Figure 2-2: Schematic Representation of a Reactive Alerting System (left) and Predictive A lertin g Sy stem (righ t)... 3 0 Figure 2-3: Schematic Representation of Functions and Information Flow in a Conflict A le rtin g Sy stem ... 3 1 Figure 2-4: State Space Representation of Current State Error (left) and Future State E rro r (rig h t) ... 3 2 Figure 2-5: Schematic Representation of Combined Current and Future State U n c e rta in ty ... 3 4 Figure 2-6: Variants of the Traffic Alert and Collision Avoidance System (TCAS)... 36
Figure 2-7: Schematic Representation of ADS-B... 40
Figure 2-8: Cockpit Display of Traffic Information (CDTI)... 39
Figure 2-9: Summary Schematic of ADS-B System... 42
Figure 2-10: Schematic Representation of 95% Position Accuracy of 1m (left) and 0.25m (r ig h t) ... 4 3 Figure 3-1: Comparison of General Aviation to Air Carrier Active Fleet. General Aviation In clu d es A ir T axi (B T S) ... 5 0 Figure 3-2: Average Yearly Hours Flown by General Aviation Aircraft compared to Air C arrier A ircraft (B T S)... 5 1 Figure 3-3: Percentage of General Aviation Aircraft By Primary Use and Age ... 52
Figure 3-4: Percentage of NTSB Mid-Air Collisions by Location... 57
Figure 3-5: Track Intersect Angle Summarized for All NTSB Mid-Air Collision Reports... 57
Figure 3-6: Location Distribution and Geometry of All NTSB Mid-Air Collisions in the A irp o rt P attern ... 5 8 Figure 3-7: Geometry Distribution for Encounters in the Vicinity of the Airport ... 59
Figure 3-8: Flight Phases of Mid-Air Collisions Away From the Airport ... 60
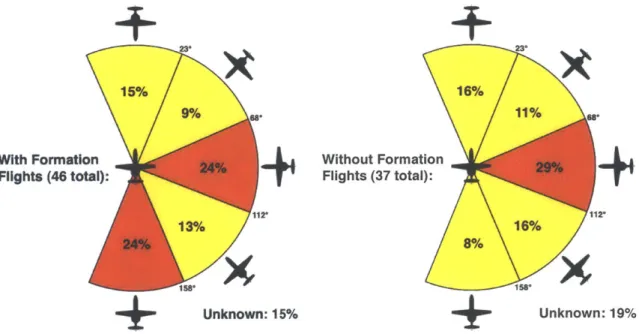
Figure 3-9: Track Intersect Angle for Mid-Air Collisions Away From the Airport With and W ithout Form ation Flights ... 60
Figure 3-10: Near Mid-Air Collisions Reported in the ASRS Database by Respective Flight Phase. Encounters Along the Diagonal Are Between Aircraft in the Sam e F ligh t P h ase...6 1 Figure 3-11: Near Mid-Air Collisions Reported in the NMACs Database by Respective
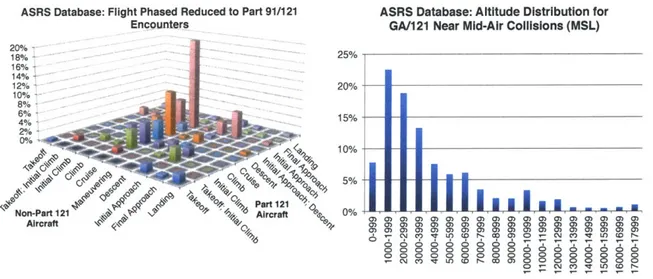
Flight Phase. Encounters Along the Diagonal Are Between Aircraft in the Sam e F ligh t P h ase...6 2 Figure 3-12: Flight Phase and Altitude Distribution of GA/Part 121 Encounters in the
A S R S D atab ase ... 6 3 Figure 3-13: Flight Phase And Altitude Distribution of GA/Part 121 Encounters in the
N M A C S D atab ase ... 6 4 Figure 3-14: Definitions of Track Intersect Angle (IA), Relative Horizontal Velocity
(RHV) and Relative Vertical Velocity (RVV)... 65
Figure 3-15: Narrative, Location and Geometry of Encounter Category Al and A2...66
Figure 3-16: Narrative, Location and Geometry of Encounter Category A3 and A4...66
Figure 3-17: Narrative, Location and Geometry of Encounter Category A5 and A6...67
Figure 3-18: Narrative, Location and Geometry of Encounter Category A7 and A8...67
Figure 3-19: Narrative, Location and Geometry of Encounter Category El, E2 and E3...68
Figure 3-20: Narrative, Location and Geometry of Encounter Category E4, E5 and E6...68
Figure 3-21: Notional Avionics Architecture with DO-317A ASSAP Processor...69
Figure 3-22: Visualization of the Stand-Alone TSAA Implementation (no DO-317A T ra ck e r) ... 7 1 Figure 3-23:TSAA Implementation With A DO-317A Tracker ... 72
Figure 3-24: Traffic Symbols Defined in DO-317A for ATSA-AIRB... 73
Figure 3-25: Proximate Traffic and Alerted Traffic Symbols Defined by DO-317A...74
Figure 3-26: State Space Representation of Alerting Problem ... 75
Figure 3-27: Zones Used in Alert Evaluation ... 78
Figure 3-28: Nuisance Alert Rate vs. Average Time of Alert Before Closest Point of A p p roa ch ... 8 4 Figure 4-1: Schematic Representation of PAZ and CAZ Calculated by the Exemplar TSAA A lg o rith m ... 9 1 Figure 4-2: Constant Turn Rate Trajectory Projection... 92
Figure 4-3: Schematic Representation of Alerting Logic Combining Protected Airspace Zones and Constant Turn Rate Trajectory Prediction ... 92
Figure 4-5: Notional DO-317A Avionics Architecture adapted for Implementation with T S A A ... 9 5 Figure 4-6: Functional Block Diagram of TSAA Conflict Detector ... 99 Figure 4-7: Functional Block Diagram of TSAA Conflict Search Engine...101 Figure 4-8: Visualization of PAZ Size for a Sample Encounter...103 Figure 5-1: Schematic Representation of Optimization Approach Applied to a Conflict
A le rtin g Sy stem ... 1 1 1 Figure 5-2: The Tuning Method is Used for the Evaluation and Optimization of the TSAA
A lg o rith m ... 1 1 2 Figure 5-3: A lgorithm Tuning M ethod ... 113 Figure 5-4: Sample Higher Order Parameter Interaction ... 114 Figure 5-5: Simulation Tool Suite Used for TSAA Performance Evaluations...116 Figure 5-6: Relationship Between Encounter Data Sets and Algorithm Development
P ro c e ss ... 1 1 7 Figure 5-7: Sample Uncorrelated Encounter From the LLEM Master Encounter Set...118 Figure 5-8: Sample Own-Ship Trip in the Low Altitude and Airport Operations Master
E n co u n ter D ata Set...12 0 Figure 5-9: Sample Scripted Encounter of Scenario A4...121 Figure 5-10: Schematic Representation of Degradation Process ... 122 Figure 5-11: Schematic Representation of Functions and Information Flow of ADS-B
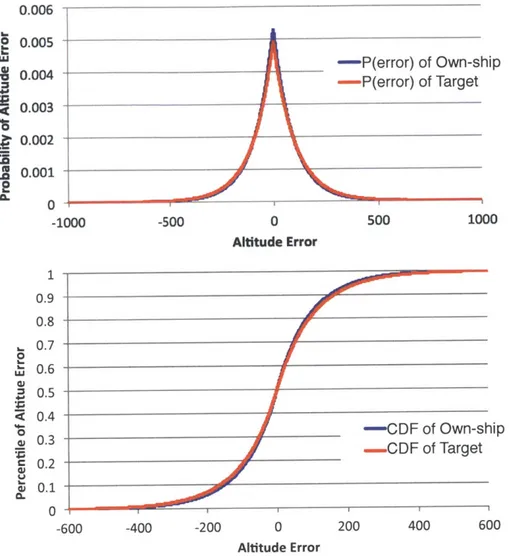
B ased A lerting System s...12 3 Figure 5-12: Weakly and Strongly Correlated Position Error, NACp of 8 (0.05NM)...125 Figure 5-13: GNSS Error (blue) Compare to Radar Error (red) for NACp of 8 ... 126 Figure 5-14: Sample Encounter With Position Error ... 127 Figure 5-15: Laplace Distribution Used to Simulate Own-Ship and Target Altimetry
Errors at Altitudes in Excess of 41,000 ft...129 Figure 5-16: Schematic Representation of Error Sources Introduced by Latency
C o m p en satio n ... 1 3 0 Figure 5-17: Error Due to Latency Compensation as a Function of Growing Latency...131 Figure 5-18: Sample Latency Error Ellipses for 6-second Latency Compensation...131 Figure 5-19: Sample Latency Error Separated into Cross Track (red) and Along Track
(p in k) C o m p on en ts ... 13 2 Figure 5-20: Probability Density Function and Cumulative Probability for 95%, 6
Figure 5-21: System Components, Data Flow and Latency Sources for ADS-B Targets ... 135 Figure 5-22: System Components, Data Flow, and Latency Sources for ADS-R Targets ... 136 Figure 5-23: System Components, Data Flow and Latency Sources for TIS-B Targets...137 Figure 5-24: System Components, Data Flow and Latency Sources for the TSAA
Own-s h ip ... 1 3 8 Figure 5-25: Sample Prolonged Proximity Encounter...140 Figure 5-26: Sample Radar Chart Visualization for Two Algorithm Parameter Com binations (sm aller is better)...142 Figure 5-27: Sample Receiver Operating Curve Adapted for Conflict Alerting System
Performance Evaluation (Reproduced from [11])...143 Figure 5-28: PCD vs. Nuisance Rate visualization for 100 different algorithm parameter
co m b in a tio n s ... 14 4 Figure 6-1: TSAA Parameter Version Evolution...149 Figure 6-2: TSAA Sample Algorithm Performance of 100 Hypercube Points for the
ADS-B N om in al T arget ... 15 3 Figure 6-3: TSAA Sample Algorithm Performance of 100 Hypercube Points for the
ADS-R N o m in al T arg et...1 5 3 Figure 6-4: TSAA Sample Algorithm Performance of 100 Hypercube Points for the
TIS-B1 N o m in al T arget ... 1 5 4 Figure 6-5: TSAA Sample Algorithm Performance of 100 Hypercube Points for the
TIS-B 2 N om in al T arget ... 154 Figure 6-6: High Impact Parameters for Nuisance Rate and Average Alert Time...156 Figure 6-7: High Impact Parameters for Missed and Late Alert Percentage ... 156 Figure 6-8: Missed Alert Percentage and Nuisance Alert Rate vs. Minimum PAZ Height
(ft) ... 1 5 8 Figure 6-9: Nuisance Alert Rate vs. Average Alert Time Trade-Off for Look-Ahead Time ... 159 Figure 6-10: Look-Ahead Time Trade-Off Between Nuisance Alert Rate and Average
Alert Time For the ADS-B Nominal Target ... 160 Figure 6-11: Nuisance Alert Rate vs. Average Alert Time Trade-Off for PAZ Scaling
F a cto r ... 1 6 1 Figure 6-12: Horizontal PAZ Scaling Trade-Off Between Nuisance Alert Rate and
Average Alert Time For the ADS-B Nominal Target ... 162 Figure 6-13: Percent Correct Detection vs. Nuisance Alert Rate Trade-Off via Horizontal
Figure 6-14: Percent Correct Detection and Nuisance Alert Rate vs. Horizontal PAZ
Scaling for the TIS-B2 Nom inal Target ... 164
Figure 6-15: Polar Plot of TSAA Performance for all Four Nominal Targets, No Error and a Basic TCAS I Algorithm Implementation (smaller is better)...168
Figure 6-16: Location of TSAA Performance with Tuned Parameters in Relation to 100 Hypercube Points (ADS-B Nom inal Target)...169
Figure 6-17: Histogram of the Duration of All Alerts (Blue) and Nuisance Alerts (Green) .. 170
Figure 6-18: Position and Altitude Error Distribution of Missed Alerts for the ADS-B N o m in al T arg et ... 1 7 1 Figure 6-19: Encounters Most Frequently Missed by TSAA with Tuned Algorithm P a ra m ete rs...1 7 2 Figure 6-20: Position and Altitude Error for Missed Alerts of the TIS-B2 Nominal Target.173 Figure 7-1: Steps Follow ed During the Design of TSAA...175
Figure 7-2: Sample Engineering Checkout Flight During Initial Flight Test Phase...177
Figure 7-3: Sample Flight During Human Factors Flight Tests...178
Figure 7-4: Flight Track of S76 Flight to Philadelphia International Airport...180
Figure 7-5: TSAA Implementation Used During Flight Test...181
Figure 7-6: Closest Point of Approach for 34 Nuisances Issued by TSAA Prototype D u rin g Fligh t T est ... 18 4 Figure 7-7: Visualization of a "W rap-Around" Alert...185
Figure 7-8: Histogram of Alert Time before CPA for all 365 Flight Test Encounters...186
Figure 7-9: No-Tracker, Stand-Alone TSAA Implementation Used by the Simulation Tool. 187 Figure 7-10: Histogram of the Difference in Tim e of First Alert ... 189
Figure 7-11: Visualization of the Re-Acquisition Snap Due to ADS-B Message Dropouts .... 190
Figure 8-1: Approaches Used to Address Undesirable Behaviors of TSAA Sample A lg o rith m ... 1 9 4 Figure 8-2: Proposed TSAA Architecture with Modified DO-317A Tracker ... 195
Figure 8-3: Sample Analysis of State Space Variables for A Wrap-Around Nuisance Alert .196 Figure 8-4: Secondary TSAA Logic Used To Identify Wrap-Around Alerts...198
Figure 8-5: Secondary TSAA Logic Used to Prevent Re-Alerts Due To Trajectory Wagging198 Figure 8-6: 100 Parameter Hypercube Points for TSAA WITHOUT the Additional Logic .... 199
Figure 8-8: Histogram of Alert Duration of Alert Issued WITHOUT New Logic (Nominal A D S-B T a rg et)...2 0 1 Figure 8-9: Histogram of Alert Duration of Alert Issued WITH New Logic (Nominal
ADS-B T a rg e t) ... 2 0 1 Figure 8-10: Zoomed Histogram of Alert Duration of Alert Issued WITH New Logic
(N om inal A D S-B T arget)...20 2 Figure 8-11: Polar Plot Visualization of TSAA Before and After Addition of New Logic
(sm aller is b etter) ... 2 0 3 Figure 9-1: Steps Followed During the Design of TSAA...205 Figure 9-2: Schematic Representation of Alerting Logic Combining Protected Airspace
Zones and Constant Turn Rate Trajectory Prediction ... 208 Figure 9-3: Algorithm Tuning Method...209 Figure 9-4: Schematic Representation of Error Sources Introduced by Latency
C o m p en satio n ... 2 1 0 Figure 9-5: Zones used in Alert Evaluation ... 212 Figure 9-6: Extension of Kuchar's ROC Curve Approach for the Visualization of all Five
Performance Metrics Used During the Development of TSAA...213 Figure 9-7: Radar Plot Comparison of Performance Between TCAS I and The TSAA
A lg o rith m ... 2 1 4 Figure A-1: Schematic Representation of ADS-B ... 228 Figure A-2: Cockpit Display of Traffic Information (CDTI)...228 Figure A-3: Predicted ADS-B Coverage at Full Implementation...232 Figure A-4: Temporary Installation of an ADS-B Antenna on a Terminal Area Radar
Tower in Brisbane, Australia (credit: Greg Dunstone)...233 Figure A-5: FIS-B Information Displayed on MFD ... 238 Figure B-1: Accidents Evaluated by the Navy Study...244
LIST OF TABLES
Number Page
Table 2-1: Differences in How Alerts Are Annunciated to the Pilot for TAS and TCAS I S y ste m s ... 3 7
Table 2-2: Differences Between 1090-ES and UAT ADS-B Link ... 41
Table 2-3: Subset of ADS-B Message Elements Required by the Mandate and Their Minimum Performance Requirements ... 42
Table 2-4: Mapping Between Horizontal Figure of Merit (HFOM) and ADS-B NACp V a lu e s ... 4 3 Table 2-5: Mapping Between Horizontal Figure of Merit (HFOM) and ADS-B NACp V a lu e s ... 4 4 Table 3-1: Format of Heading Information in NTSB Mid-Air Collision Reports... 55
Table 3-2: Near Mid-Air Collisions Reported in the Airport Environment... 62
Table 3-3: NMAC Encounters by FAR, Ranked by Percentage ... 63
Table 3-4: State Data Available to TSAA from DO-317A Tracker (According to Table H-2 in [2 6 ]) ... 7 0 Table 3-5: Size of Zones used for Alert Evaluation... 79
Table 3-6: Acceptable Performance Levels as Defined by the Pilot Focus Group ... 80
Table 3-7: Required Time of Alert Before CPA to Ensure Alerts are Issued Before TCAS II R A s ... 8 4 Table 3-8: Summary of Stakeholder Requirements... 86
Table 3-9: Summary of Functional Requirements... 86
Table 3-10: Summary of Architectural Requirements... 86
Table 3-11: Summary of Performance Requirements ... 87
Table 4-1: State Data Available to TSAA from DO-317A Tracker (According to Table H-2 in [2 6 ]) ... 9 5 Table 4-2: Data Fields Maintained in the TSAA Threat Database ... 97
Table 4-3: Algorithm Internal Parameters That Define Algorithm Behavior...106
Table 4-4: Algorithm Parameters with Hard-Coded Settings...107
Table 5-1: Adjustable Parameter Internal to the Prototype TSAA Algorithm...109
Table 5-2: Update Intervals for ADS-B, ADS-R and TIS-B ... 133
Table 5-4: Simulation Model Settings for ADS-R Targets...136
Table 5-5: Simulation Model Settings for TIS-B Targets...137
Table 5-6: Simulation Model Settings for TSAA Own-ship ... 138
Table 5-7: Mapping of what Encounters in the Low Altitude and Airport Ops Data Set Were Used to Calculate Performance Metrics...139
Table 5-8: Normalization Values used for Polar Chart Visualization...142
Table 6-1: Adjustable Parameter Internal to the Prototype TSAA Algorithm...150
Table 6-2: Error Parameters for Nominal Targets...152
Table 6-3: Terminal Area Hazard and Non-Hazard Zones used for TSAA Algorithm Tuning With The Low Altitude and Airport Operations Master Encounter Set 152 Table 6-4: R2 Values for the TSAA Performance Metrics...155
Table 6-5: Percent Variability in Performance Metrics vs. High Impact Algorithm Parameters (Averaged Across All Nominal Targets) ... 157
Table 6-6: Percent Variability in Performance Metric vs. Horizontal PAZ Scaling for the T IS-B 2 n om in al T arget ... 16 2 Table 6-7: Final TSAA v5 Parameters and Reasoning for Selection ... 165
Table 6-8: Performance of Tuned TSAA Algorithm Nominal Targets with Comparison to T C A S I ... 1 6 8 Table 7-1: Overall Prototype Perform ance...182
Table 7-2: Summary of Missed, Late and May-Alerts with < 12.5 seconds alert time...186
Table 7-3: Summary of Prototype To Simulation Alert Comparison ... 188
Table 7-4: Comparison between Flight Test Performance And Expected Airport Environm ent Perform ance ... 192
Table 8-1: Performance Comparison Between TSAA With and Without the Improved L o g ic...2 0 2 Table 9-1: Summary of Stakeholder Requirements...206
Table 9-2: Summary of Functional Requirements ... 206
Table 9-3: Summary of Architectural Requirements ... 206
Table 9-4: Summary of Performance Requirements...207
Table 9-5: Size of Zones used for Alert Evaluation ... 212
Table 9-6: Numerical Comparison of Performance Between TCAS I and The TSAA A lg o rith m ... 2 1 4 Table A-1: Differences Between 1090-ES and UAT ADS-B Link...229
Table A-2: Minimum Required ADS-B Message Elements and Their Minimum
Perform ance R equirem ents ... 231
Table A-3: List of Proposed ADS-B Out Applications ... 235
T able A -4 : List D ata Link A pplications ... 237
Table A-5: List of ADS-B In Applications Proposed in the AIWP...239
Table B-1: Summary of NTSB Reports in Which at Least One Aircraft Had a Traffic Alerting System (* These accidents did not mention traffic alerting systems in the reports but m ay have had one)...241
Chapter 1
INTRODUCTION AND MOTIVATION
M
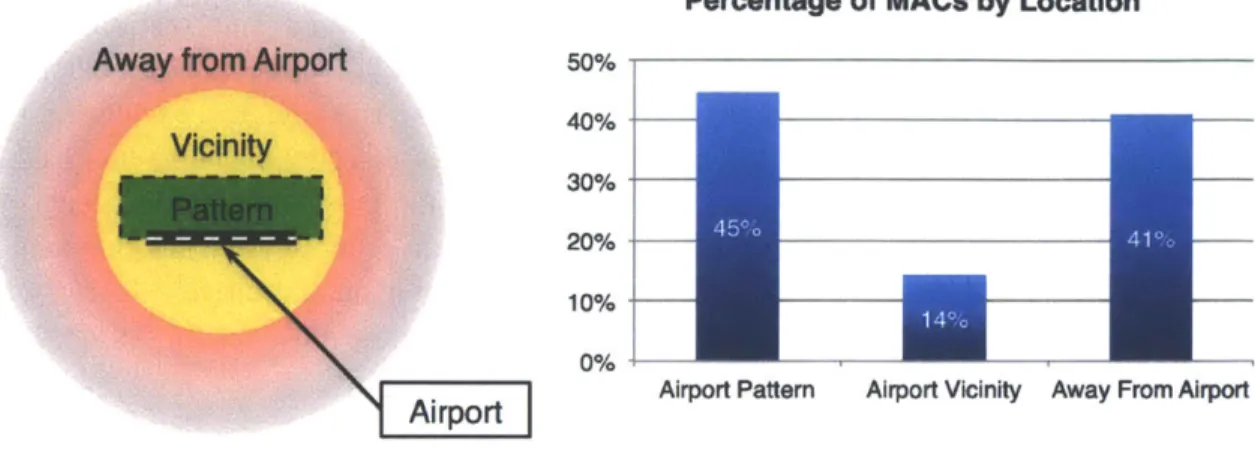
id-air collisions must be prevented during flight operations. Between2000 and 2010, 112 mid-air collisions occurred in the United States, 66 (59%) of which occurred in the airport pattern or the immediate vicinity of an airport [1]. Current airborne traffic alerting systems such as the Traffic Alert and Collision Avoidance System (TCAS), originally developed in the 1980s for commercial aviation, have been very successful in preventing mid-air collisions in the en-route environment.
As shown Figure 1-1, TCAS systems are required on all aircraft carrying more than 10 passengers or that have a maximum takeoff weight (MTOW) of 15,000 kg or more. TCAS I systems only alert the flight crew to potential threats, while TCAS II systems also issue executive commands on how to avoid the threat. The Traffic Advisor System (TAS) is a TCAS I implementation specific to General Aviation (GA).
Number of Passengers Collision Avoidance System Required (TCAS II) 301---10 Collision Alerting System Required (TCAS I) Percentage of US Fleet: 05%
Voluntary Equipage with Collision Alerting or Avoidance System
(TAS and TCAS I & 1I)
Percentage of US Fleet: 96%: Percentage of US Fleet: 3.5%
15,000 kg Maximum Takeoff Weight
Due in part to sensor limitations, TCAS I and II systems tend to over-alert when operating in high-density environments such as in the vicinity of an airport [2]. Additionally, in part due to their high cost, voluntary equipage with such alerting systems among aircraft with less than 10 passengers and an MTOW of less than 15,000kg in the United States was at only 14.5% in 2010 [3]. If equipage costs were lower, the increased frequency congestion caused by the systems' active surveillance sensors make high levels of fleet-wide equipage undesirable [4].
In recent years, Automatic Dependent Surveillance-Broadcast (ADS-B) has been introduced worldwide as a new source of aircraft surveillance information. Aircraft equipped with ADS-B transmit more frequent and more comprehensive aircraft surveillance information than what current ground based radar can determine. For ADS-B to function, however, aircraft first must be equipped with ADS-B avionics. To achieve a high level of fleet-wide equipage, airworthiness authorities worldwide have introduced equipage mandates that require aircraft to transmit ADS-B in busy airspace. This mandate takes effect by 2020 in the US and by 2017 in Europe.
Airworthiness authorities and industry are interested in stimulating voluntary equipage of ADS-B avionics across all stakeholders ahead of the mandate, including in airspace where the transmission of ADS-B messages will not required by law [4-7]. One way to stimulate this voluntary equipage is to provide the involved stakeholders with benefits that result from use of the technology ("user benefit"). The more user benefit a stakeholder perceives from a given technology, the more likely that stakeholder is to equip with that technology. The information transmitted via ADS-B is more comprehensive and has the potential to contain significantly less error than the information available from radars or the collision alerting system sensors mentioned above. With this improved information, ADS-B represents an opportunity to introduce new, high-precision alerting systems that can operate in high-density environments without generating high rates of undesirable alerts. Previous work has identified that introducing ADS-B-enabled conflict alerting to the National Airspace System (NAS) has the potential to generate significant user benefit; thus creating an incentive for stakeholders to equip ADS-B avionics voluntarily [8], [9].
In light of this, MIT has developed a prototype of an ADS-B-enabled airborne conflict alerting system ("exemplar system"). Known as the Traffic Situation Awareness with Alerting (TSAA) ADS-B Application, this exemplar system is to serve as the basis for the international certification standard that will be used to certify such systems in the future. This thesis describes the development of this system.
1.1
The Systems Engineering Approach to the Development
TSAA
The development of TSAA followed a standard systems engineering approach. Commonly represented by the V-Model, the process is shown in Figure 1-2. The two components of the V -model are the system or program definition (the downward arrow in Figure 1-2) and the
system integration, testing, and operation (the upward arrow in Figure 1-2).
Developing TSAA started with identifying ADS-B as a technological opportunity and combining this with a National Airspace System (NAS) stakeholder assessment in order to outline a high-level system concept for an ADS-B-enabled conflict alerting system. Next, system requirements were defined for the alerting system; and based on those requirements, a prototype alerting system was designed. This alerting system then was evaluated in depth and tuned to the desired performance.
Technological Opportunity/ Stakeholder Assessment
High Level Concept for
ADS-B
Enabled Conflict Alerting
Standards Development and System Validation
I
Prototype Implementationand Flight Test
Detailed System Requirements Definition
Alerting System Design
Verification of System Requirements
System Integration Interface Management
[
Algorithm Tuning and Performance EvaluationFigure 1-2: The V-Model Systems Engineering Framework Adapted for TSAA
One the upward arrow of Figure 1-2, building a physical system and conducting a set of human factors evaluations and technical studies solidified the physical implementation and architecture of the TSAA system. Once implemented, the system was verified to meet the system requirements set out during the design process through an extensive flight test program. Lastly, the standard for future implementations of TSAA was written.
-g I k*1 0 4 -F 0 OR 4$ t>
One important observation about the Systems Engineering V-Model is that each step on the downward arrow of Figure 1-2 maps to a corresponding step on the upward arrow. For example, the stakeholder needs identified during the stakeholder assessment maps to the validation step that assesses whether the system actually meets those needs.
1.2
Thesis Outline and Overview
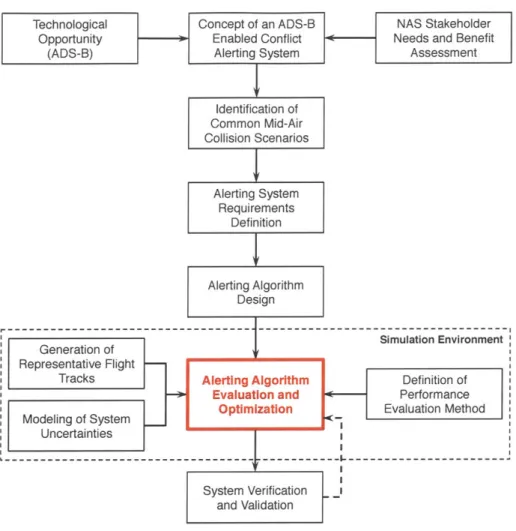
Figure 1-3 shows the process used to develop TSAA and how it relates to the organization of this thesis. The individual steps loosely map to the systems engineering approach described in section 1.1. An overview of each chapter is provided below.
Chapter 2
Chapter 3
Chapter 4
Chapter 5&6
Chapter 7&8
{
Technological Concept of an ADS-B NAS Stakeholder
Opportunity Enabled Conflict Needs and Benefit
(ADS-B) Alerting System Assessment
"I'
Identification of Common Mid-Air Collision ScenariosI"
Alerting System Requirements Definition Alerting Algorithm Design --- I Simulation Environment Generation of Representative FlightTracks Alerting Algorithm Definition of Evaluation and Performance Modeling of System Optimization Evaluation Method
Uncertainties
--- --- B---
---System Verification and Validation
Figure 1-3: Major Thesis Components and Their Relationship
As mentioned above, the surveillance infrastructure upgrade to ADS-B presents an opportunity to introduce high-performance alerting systems as avionics to the NAS. In turn, ADS-B-based alerting systems both incentivize airspace users to equip ADS-B avionics and also introduce a system-wide safety benefit. Chapter 2 reviews current alerting systems and
their advantages and disadvantages in order to evaluate whether existing systems or elements of them can be repurposed for TSAA. Chapter 2 also reviews other research in the field of conflict alerting systems and algorithms.
Chapter 3 defines the system's requirements for the TSAA prototype alerting system. The requirements are based on stakeholder expectations, the literature review conducted in Chapter 2, and an analysis of 10 years' worth of NTSB mid-air collision data. In order to meet the identified system requirements, the decision to design a new algorithm for TSAA was made. Chapter 4 describes this new algorithm and provides a detailed description of its
components and implementation.
Chapter 5 introduces a method for the tuning and evaluation of the new TSAA algorithm. Chapter 6 demonstrates the use of this method to obtain the desired algorithm performance to meet the system requirements.
Chapter 7 summarizes the verification and validation efforts that were performed on the overall TSAA system. Specifically, TSAA was evaluated over 3 months of flight tests: the alerting behavior observed during the flight test was compared to the alerting behavior that would be expected from the simulation. Based on the data and insights from the flight tests, additional improvements could be introduced in Chapter 8 to the basic algorithm (signified by the dashed feedback path in Figure 1-3), significantly improving its performance.
Chapter 9 summarizes the major points and components of this thesis and identifies areas of further work.
Chapter 2
BACKGROUND AND LITERATURE REVIEW
T
he fundamental task of a collision alerting system is to decidewhether an alert must be issued to the flight crew, given some information about the environment surrounding its own aircraft ("own-ship"). This chapter provides a general description and representation of this task, reviews how it is implemented in current airborne alerting systems, and summarizes other approaches that have been proposed in literature.
2.1
General Representation of the Alerting Problem and
Alerting Systems
Collision alerting systems have been studied in depth as part of a larger research effort on hazard alerting systems. In the larger context of hazard alerting systems, two types of alerting systems can be identified. The first is a reactive alerting system, which alerts to the observed presence of a hazard. An example of a reactive alerting system would be a system that alerts to the presence of an engine fire. The second is a predictive alerting system, which alerts when a hazard is predicted to be present in the future. An example of a predictive alerting system would be a conflict alerting system that alerts to the possibility of a mid-air collision in the future.
Kuchar provides an in-depth discussion on alerting systems and generalizes the alerting task in a state-space representation. This state-space representation allows for the analysis of specific issues affecting alerting systems while retaining generality across many applications; it is shown in Figure 2-1 [10]. Notional states x, and x2 are the input states and
together define the Alerting State Space X. The time evolution of those states define the state trajectory vector x(t). The alert region represents the ranges of the states x, and X2
that are considered to indicate that the hazard against which the system protects is present in the system. It should be noted that the alert region is not synonymous with the hazard itself, but rather defines the state-space region that would be considered hazardous.
X2
Future State Trajectory
Historical
State Trajectory Alert Region
x(o -Position at time t
Alerting State Space X
X
Figure 2-1: State-Space Representation of the Alerting Problem
Using the state space representation of a hazard alerting system, the two alerting system categories can be described more precisely, as shown in Figure 2-2.
Reactive Alerting System Predictive Alerting System
X2 X2
Observed Exceedance Predicted Exceedance
of Alerting Threshold of Alerting Threshold
Measured State - - - Predicted State
Trajectory x(t) Trajectory Segment
Alerting State Space X Alerting State Space X
X1 X1
Figure 2-2: Schematic Representation of a Reactive Alerting System (left) and Predictive Alerting System (right)
For a reactive alerting system, shown on the left in Figure 2-2, an alert is issued if the current states are within the alert region. In a predictive alerting system, as shown on the right, the system projects a state trajectory segment into the future and an alert is issued if this segment penetrates the alert region.
Most commonly, airborne alerting systems are predictive alerting systems and predict how the states currently known will evolve along a trajectory segment. If a set of conditions are met along this predicted trajectory segment, an alert is issued. Most of the time, however, neither the current states nor their evolution over time is known with absolute certainty. The next section discusses how this limitation of knowledge affects predictive alerting systems.
2.2
Uncertainty in Predictive Alerting Systems
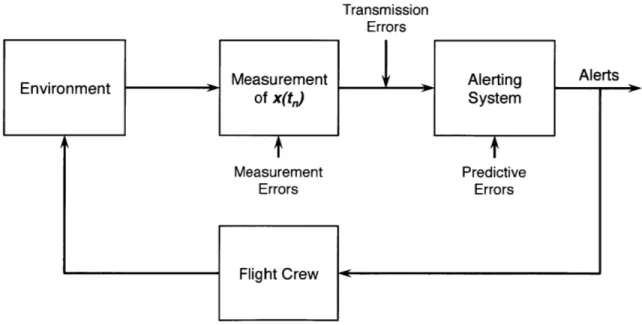
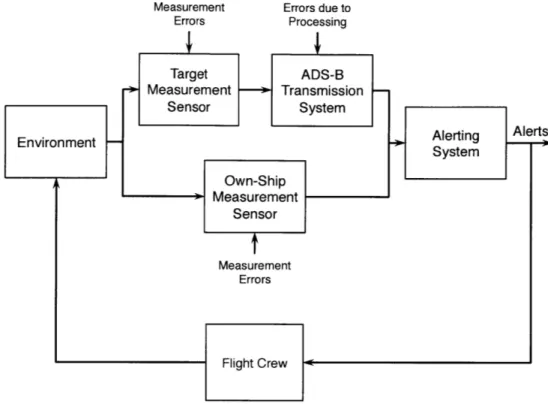
A schematic representation of the functions and information flow for predictive alerting systems is shown in Figure 2-3. As the operations of interest occur in the surrounding environment, a sensor measures the states required by the alerting system. Based on those states, the alerting system decides whether a hazard is present and whether an alert to the operator is necessary. If an alert is issued, the flight crew then decides how to respond to the alert, which in turn affects the operations in the original environment.
Transmission Errors
Environment Measurement Alerting Alerts
of x(t,) System
Measurement Predictive
Errors Errors
Flight Crew
During the process of measuring the states, sensor limitations introduce state errors to the measured information. Additional errors are introduced during the transmission of the measured states, such as errors due to latency compensation. Together, measurement and transmission errors introduce uncertainty about the system's current state. This uncertainty is referred to as "current state uncertainty". Additionally, since future operations are unknown, the state predictions made by alerting systems are inherently uncertain, which introduces predictive errors. This type of uncertainty is referred to as "future state uncertainty". The presence of current and future state uncertainty significantly affects the design of alerting systems and composes much of the literature on alerting system design [11]. Figure 2-4 shows conceptual representations of the errors that generate the future and current state uncertainty.
Current State Error Future State Error
X2 - Actual State X2
Trajectory -
-IXAMt .0
Predicted State
Error in Trajectory
Current State Atept Region iAlertRegion
XM(O ) - Future State
... -Error
Received State Actual State
Information Trajectory
X, X,
Figure 2-4: State Space Representation of Current State Error (left) and Future State Error (right)
2.2.1
CURRENT STATE UNCERTAINTYCurrent state uncertainty-that is, uncertainty associated with the currently known states-is the statistical distribution of the errors between the true state and the measured state, as sampled over repeated measurements. Rowe refers to this type of uncertainty as metrical uncertainty [12]. Beyer and Sendhoff describe state uncertainties as "objective uncertainties" that are of an "intrinsically irreducible stochastic nature" [13].
The stochastic behavior of current state errors (i.e., sporadic, non-deterministic) is frequently complex but often can be described as a combination of a slow moving bias with a superimposed Gaussian jitter [14]. Therefore, the measurement error at any given time
depends on past error on one hand and on random, unpredictable elements on the other. The proportions with which those two components affect the total state error
fundamentally depend on the sensor generating the state measurement xm(t).
In Figure 2-5, the current state uncertainty is illustrated by an oval around xm(t). It should be noted that the dashed line does not imply that the state uncertainty is a discrete ellipse; rather, due to the stochastic nature of state uncertainty, it is generally defined with a probability distribution. As such, the edge of the ellipse can be viewed as a percentage bound of the uncertainty that gives the probability of the measured state falling into that ellipse.
2.2.2 FUTURE STATE UNCERTAINTY
In order to alert to the future presence of a hazard, predictive alerting systems project a future state trajectory segment (represented as a dashed line in Figure 2-2 [right] and Figure 2-5) and evaluate whether the hazard will be present along that trajectory. However, since operator intent is generally unknown, such predictions are inherently uncertain, which introduces future state uncertainty. Formally, future state uncertainty is the distribution of the differences between the predicted and the actual future trajectory, as sampled over repeated predictions [15]. As stands to reason, the more accurately the prediction matches the true future trajectory, the lower the future state uncertainty will be and thus the more likely the system will issue accurate alerts. In Figure 2-4 (right), the alert region would be avoided if the alerting algorithm predicted the actual trajectory more accurately. As is shown in Figure 2-5, the further into the future a system predicts, the greater its future state uncertainty becomes; this relationship defines an "uncertainty cone". It is important to note that some of the errors that may be present in the current state information have the potential to affect the future state uncertainty significantly. One such error is the velocity error: if velocity is used to predict future states, errors in its direction (i.e., heading or track angle) or magnitude will result in errors about the future states as well. Section 5.5.2 discusses this phenomenon in more detail.
2.2.3 APPROACHES To REDUCING EFFECTS OF CURRENT AND FUTURE STATE
UNCERTAINTY
Various approaches to reduce the effects of uncertainty on alerting systems across transportation methods have been proposed [16] .Generally, the proposals can be grouped into three categories. The first category includes approaches that attempt to reduce the effects of the current state uncertainty, effectively reducing the size of the ellipse around Xm(t) in Figure 2-5. The literature on stochastic estimation largely overlaps with this category of proposed approaches, and will be discussed in later sections. The second
category comprises attempts to improve the predicted states and thus to reduce future state uncertainty, effectively reducing the width of the cone at xM(t+At) in Figure 2-5. Lastly, approaches in the third category combine knowledge about the current state uncertainty with knowledge about potential future maneuvers and approach the alerting decision from a decision theoretic view, recognizing the fact that uncertainty is present in the alerting decision itself instead of minimizing it ahead of the alerting decision. Thus, the alerting decision is optimized while directly taking that uncertainty into account.
Future State Uncertainty Bound Measured State Trajectory Current State Uncertainty Bound Predicted State Trajectory Segment
Figure 2-5: Schematic Representation of Combined Current and Future State Uncertainty The first category focuses on reducing the uncertainty associated with the current state
estimate. Across transportation methods, Kalman filters commonly are used to account for and reduce the effects of the current state uncertainty [17], [18]. Certain algorithms of automotive alerting systems attempt to model road conditions directly as well as modeling engine and brake performance in the ambient conditions to predict and therefore avoid collisions [19]. Alterovitz et al. propose using a Markov decision process to take possible future states into account and thus optimize the current alerting decision [20]. More recently, Jansson and Gustafsson proposed a framework for collision-avoidance algorithms that use online Monte Carlo techniques to convert state measurements with stochastic errors to Bayesian risk to evaluate whether an alert should be issued [21]. For the naval industry, a conflict avoidance system based on a genetic algorithm as a means to reduce the threat of environmental pollution due to oil tanker collisions has been developed [22]. Similar advances to address current state uncertainty in airborne alerting systems have also been proposed. However, as observed by Hwang et al., a single filter may not be sufficient to
estimate states in systems with various operational modes (e.g., airport vs. en-route) [23]. In order to detect mode changes, multi-modal Kalman filters or the use of intent information have been proposed [23], [24]. Only recently has the first performance standard using three independent, two-state Kalman filters to account for state uncertainty in airborne target tracking been published; section 3.3 discusses this standard in depth [25]. Of the approaches to reduce the effects of uncertainty that focus on reducing the uncertainty associated with the predicted future states, three types of trajectory predictions are commonly used: discrete, probabilistic, and worst case [16]. Kuchar and Yang proposed a conflict alerting system that uses probabilistic models for state and predictive uncertainties, and estimates the probability of a conflict using Monte Carlo sampling methods [26]. Eby and Kelly proposed an algorithm derived from potential-field models [27] and Chiang and Klosowski proposed using a geometric algorithm for conflict detection and resolution [28]. Building on the probabilistic approach used in the Kuchar and Eby papers, Jones proposed a real-time probabilistic collision avoidance algorithm for autonomous vehicles [29]. Prandini et al. also used a probabilistic framework for trajectory prediction to detect potential future aircraft conflicts [30-32]. At NASA Langley, Munoz et al. developed multiple algorithms that use probabilistically derived buffer zones around the own-ship and the target aircraft [33-39]. Yet another approach, by Christodoulou and Kodaxakis, solved the alerting problem using a mixed-integer problem formulation [40]. In Europe, Eurocontrol standards for trajectory prediction for short-term conflict detection have been published [41-43]. A comprehensive survey of 68 conflict detection and resolution methods up to 2000 is presented by Kuchar and Yang [16]. Erzberger and Paielli propose a model for the error due to trajectory prediction[44].
The last category takes a more holistic view of alerting in the presence of uncertainty and approaches the alerting problem from the perspective of decision theory. As opposed to using thresholds, the alerting decision is made based on the expected utility or value of the alert [45]. If that utility is high enough, the decision to alert is made. The strength of this approach is that alerts are delayed in situations where the current or future state uncertainty is high until the expected utility is high enough, which reduces the number of unnecessary alerts. One approach in this category is proposed by Yang and builds on the probabilistic conflict alerting system proposed by Kuchar and Yang above. The approach uses the expected performance of the alerting system as a decision metric for when to issue an alert [46], [47]. More recently, a significant body of work has been generated on this type of alerting system as part of the development of the Airborne Collision Avoidance System (ACAS) at Lincoln Laboratory, and is addressed in a later section.
2.3
Airborne Collision Alerting Systems Currently in Use
Most current airborne collision alerting systems are designed to meet one of two standards:
" RTCA/DO-197, "Minimum Operational Performance Standards for An Active Traffic Alert and Collision Avoidance System I (ACTIVE TCAS I)"
- RTCA/DO-185, "Minimum Operational Performance Standards for Traffic Alert and Collision Avoidance System II (TCAS II)"
In the 1980s, in response to a series of mid-air collisions involving commercial aircraft, the US Congress tasked the Federal Aviation Administration (FAA) to develop and mandate the Traffic Alert and Collision Avoidance System (TCAS; public law 100-223). TCAS uses an active sensor on-board the own-ship to interrogate transponder-equipped aircraft in the vicinity to evaluate if they pose a threat. In addition to determining whether an aircraft poses a threat, TCAS II systems have the capability to calculate a maneuver, coordinate it with the other aircraft if it is also equipped with TCAS II, and issue commands directing the flight crew how to execute that maneuver. The conflict alerting and avoidance algorithm developed for TCAS that performs this evaluation is the basis for both standards listed above.
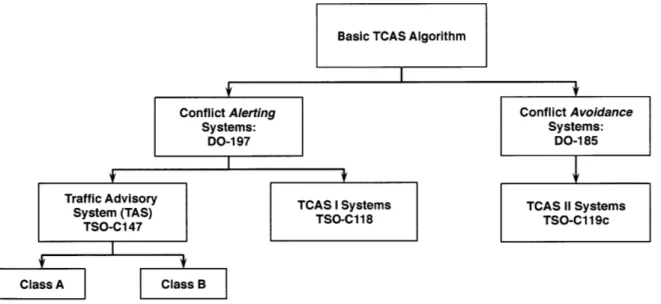
Basic TCA
S
AlgorithmConflict Alerting Conflict Avoidance
Systems: Systems:
DO-1 97 DO-1 85
Traffic Advisory TCAS I Systems TCAS 11 Systems
System (TAS) TSO-C118 TSO-C1 1 9c
Class A Class B
Figure 2-6: Variants of the Traffic Alert and Collision Avoidance System (TCAS)
The standards differ in which components of the algorithm are required to be implemented. Systems certified under DO-197 are intended to improve the flight crew's situation awareness by alerting them to possible future conflicts ("Conflict Alerting") in the form of Traffic Advisories (TAs). Systems certified under DO-185, in addition to alerting to conflicts,
provide executive commands to the flight crew as to how to avoid the threat aircraft ("Collision Avoidance"). Such avoidance commands are called Resolution Advisories (RAs). In the US, a particular airborne conflict alerting or avoidance system is certified to one of three Technical Standard Orders (TSOs). All three TSOs reference the standards mentioned above and they are broken down as shown in Figure 2-6. Two TSOs exist for traffic alerting systems. Traffic Advisory Systems (TAS) systems, which are certified under TSO-C147, are intended to introduce conflict alerting to General Aviation at a lower cost than TCAS I and TCAS II systems. TSO-C147 also introduces two classes of TAS:
Class A: Equipment incorporating a horizontal situation display that indicates
the presence and relative location of intruder aircraft, and an aural alert informing the crew of a Traffic Advisory (TA).
Class B. Equipment incorporating an aural alert and a visual [cue] informing
the crew of a TA.
In summary, the main differences between the two TAS classes and a TCAS I system is in how alerts are presented to the flight crew visually and aurally. Table 2-1 summarizes these differences.
Table 2-1: Differences in How Alerts Are Annunciated to the Pilot for TAS and TCAS I Systems
TCAS Technical
Variant Visual Presentation Requirement Standard
_ ariant_ _Order (TSO)
TAS Class A Traffic Display C147
TAS Class B "Visual Cue" for duration of alert C147 TCAS I Visual presentation of Bearing to traffic C118
TCAS II Traffic Display C119c
According to Federal Aviation Regulation (FAR) §121.356, any aircraft with between 10 and 30 passenger seats must be equipped with a TCAS I system. TCAS II systems are mandated on aircraft with more than 30 seats or with a maximum takeoff weight of more than 15,000kg [48-53]. In the case of an encounter between two TCAS II-equipped aircraft, the two TCAS systems coordinate the avoidance commands they issue to the flight crew to ensure that the commands effectively resolve the situation. However, as TCAS II systems provide executive guidance to the crew, their certification costs are higher and thus the systems are generally much more expensive.