HAL Id: hal-01688396
https://hal.archives-ouvertes.fr/hal-01688396
Submitted on 18 Nov 2020
HAL is a multi-disciplinary open access
archive for the deposit and dissemination of
sci-entific research documents, whether they are
pub-lished or not. The documents may come from
teaching and research institutions in France or
abroad, or from public or private research centers.
L’archive ouverte pluridisciplinaire HAL, est
destinée au dépôt et à la diffusion de documents
scientifiques de niveau recherche, publiés ou non,
émanant des établissements d’enseignement et de
recherche français ou étrangers, des laboratoires
publics ou privés.
emissions, photochemical aging, and secondary organic
aerosol formation
Z. Fang, W. Deng, Y. Zhang, X. Ding, M. Tang, T. Liu, Q. Hu, M. Zhu, Z.
Wang, W. Yang, et al.
To cite this version:
Z. Fang, W. Deng, Y. Zhang, X. Ding, M. Tang, et al.. Open burning of rice, corn and wheat straws:
primary emissions, photochemical aging, and secondary organic aerosol formation. Atmospheric
Chem-istry and Physics, European Geosciences Union, 2017, 17 (24), pp.14821-14839.
�10.5194/acp-17-14821-2017�. �hal-01688396�
https://doi.org/10.5194/acp-17-14821-2017 © Author(s) 2017. This work is distributed under the Creative Commons Attribution 4.0 License.
Open burning of rice, corn and wheat straws: primary emissions,
photochemical aging, and secondary organic aerosol formation
Zheng Fang1,3, Wei Deng1,3, Yanli Zhang1,2, Xiang Ding1, Mingjin Tang1, Tengyu Liu1, Qihou Hu1, Ming Zhu1,3, Zhaoyi Wang1,3, Weiqiang Yang1,3, Zhonghui Huang1,3, Wei Song1,2, Xinhui Bi1, Jianmin Chen4, Yele Sun5, Christian George6, and Xinming Wang1,21State Key Laboratory of Organic Geochemistry and Guangdong Key Laboratory of Environment Protection and Resources
Utilization, Guangzhou Institute of Geochemistry, Chinese Academy of Sciences, Guangzhou 510640, China
2Center for Excellence in Regional Atmospheric Environment, Institute of Urban Environment,
Chinese Academy of Sciences, Xiamen 361021, China
3University of Chinese Academy of Sciences, Beijing 100049, China
4Shanghai Key Laboratory of Atmospheric Particle Pollution and Prevention, Department of Environmental Science &
Engineering, Fudan University, Shanghai 200433, China
5Institute of Atmospheric Physics, Chinese Academy of Sciences, Beijing 100029, China
6Institut de Recherches sur la Catalyse et l’Environment de Lyon (IRCELYON), CNRS, UMR5256,
Villeurbanne 69626, France
Correspondence: Xinming Wang (wangxm@gig.ac.cn) Received: 4 July 2017 – Discussion started: 23 August 2017
Revised: 3 November 2017 – Accepted: 8 November 2017 – Published: 14 December 2017
Abstract. Agricultural residues are among the most abun-dant biomass burned globally, especially in China. However, there is little information on primary emissions and photo-chemical evolution of agricultural residue burning. In this study, indoor chamber experiments were conducted to in-vestigate primary emissions from open burning of rice, corn and wheat straws and their photochemical aging as well. Emission factors of NOx, NH3, SO2, 67 non-methane
hydro-carbons (NMHCs), particulate matter (PM), organic aerosol (OA) and black carbon (BC) under ambient dilution condi-tions were determined. Olefins accounted for > 50 % of the total speciated NMHCs emission (2.47 to 5.04 g kg−1), indi-cating high ozone formation potential of straw burning emis-sions. Emission factors of PM (3.73 to 6.36 g kg−1)and pri-mary organic carbon (POC, 2.05 to 4.11 gC kg−1), measured at dilution ratios of 1300 to 4000, were lower than those re-ported in previous studies at low dilution ratios, probably due to the evaporation of semi-volatile organic compounds under high dilution conditions. After photochemical aging with an OH exposure range of (1.97–4.97) × 1010molecule cm−3s in the chamber, large amounts of secondary organic aerosol (SOA) were produced with OA mass enhancement ratios (the
mass ratio of total OA to primary OA) of 2.4–7.6. The 20 known precursors could only explain 5.0–27.3 % of the ob-served SOA mass, suggesting that the major precursors of SOA formed from open straw burning remain unidentified. Aerosol mass spectrometry (AMS) signaled that the aged OA contained less hydrocarbons but more oxygen- and nitrogen-containing compounds than primary OA, and carbon oxida-tion state (OSc) calculated with AMS resolved O / C and
H / C ratios increased linearly (p < 0.001) with OH exposure with quite similar slopes.
1 Introduction
On the global scale, biomass burning (BB) is the main source of primary organic carbon (OC) (Bond et al., 2004; Huang et al., 2015), black carbon (BC) (Bond et al., 2013; Cheng et al., 2016), and brown carbon (BrC) (Laskin et al., 2015). It is also the second largest source of non-methane organic gases (NMOGs) in the atmosphere (Yokelson et al., 2008; Stock-well et al., 2014). In addition, atmospheric aging of biomass burning plumes produces substantial secondary pollutants.
The increase in tropospheric ozone (O3)in aged biomass
burning plumes could last for days and even months (Thomp-son et al., 2001; Duncan et al., 2003; Real et al., 2007) with complex atmospheric chemistry (Arnold et al., 2015; Müller et al., 2016). Moreover, biomass and biofuel burning could contribute up to 70 % of the global secondary organic aerosol (SOA) burden (Shrivastava et al., 2015) and hence influence the seasonal variation of global SOA (Tsigaridis et al., 2014). Since it produces large amounts of primary and secondary pollutants, it is essential to characterize primary emissions and photochemical evolution of biomass burning in order to better understand its impacts on air quality (Huang et al., 2014), human health (Alves et al., 2015) and climate change (Andreae et al., 2004; Koren et al., 2004; Laskin et al., 2015; X. Huang et al., 2016).
Open burning of agricultural residues, a convenient and inexpensive way to prepare for the next crop planting, could induce severe regional haze events (Cheng et al., 2013; Tariq et al., 2016). Among all the biomass burning types, agri-cultural residue burning in the field is estimated to con-tribute ∼ 10 % of the total mass burned globally (Andreae and Merlet, 2001), and its relative contribution is even larger in Asia (∼ 34 %), and especially in China (> 60 %) (Streets et al., 2003), where > 600 million people live in the country-side (NBSPRC, 2015). Agricultural residues burned in China were estimated to be up to 160 million ton in 2012, account-ing for ∼ 40 % of the global agricultural residues burned (J. Li et al., 2016). As estimated by Tian et al. (2011), agricul-tural residue burning contributed 70–80 % of non-methane hydrocarbons (NMHCs) and particulate matter (PM) emit-ted by biomass burning in China during 2000–2007. A better understanding of the role agricultural residual burning plays in air pollution in China and elsewhere requires better char-acterization of primary emission and atmospheric aging of emitted trace gases and particles for different types of agri-cultural residues under different burning conditions.
In the past 2 decades, there have been increasing numbers of characterizations of biomass burning emissions. Andreae and Merlet (2001) summarized emission factors (EFs) for both gaseous and particulate compounds from seven types of biomass burning. Akagi et al. (2011) updated the emis-sion data for 14 types of biomass burning, and newly iden-tified species were included. Since biomass types and com-bustion conditions may differ in different studies, reported emission factors are highly variable, especially for agricul-tural residue burning (Li et al., 2007, 2009, 2017; Cao et al., 2008; Zhang et al., 2008; Yokelson et al., 2011; Bras-sard et al., 2014; Sanchis et al., 2014; Wang et al., 2014; Ni et al., 2015; Kim Oanh et al., 2015; Stockwell et al., 2016; Bruns et al., 2017; Tkacik et al., 2017). Moreover, previ-ous studies on agricultural residue burning were mostly car-ried out near fire spots or in chambers with low dilution ra-tios. Since biomass burning organic aerosols (BBOAs) are typically semi-volatile (Grieshop et al., 2009b; May et al., 2013), it is expected that measured BBOA emission factors
would be affected by dilution processes (Lipsky and Robin-son, 2006), and BBOA emission factors under ambient di-lution conditions are still unclear. Furthermore, knowledge on NMOGs emitted from agricultural residue burning is very limited. As reported by Stockwell et al. (2015), ∼ 21 % (in weight) of NMOGs in biomass burning plumes have not been identified yet. Therefore, comprehensive measurement and characterization of gaseous and particulate species emitted by agricultural residue burning under ambient dilution con-ditions are urgently needed.
Great attention has been drawn to SOA formation and transformation in biomass burning plumes recently, since a significant increase in mass and apparent change in physico-chemical characteristics of aerosols have been observed dur-ing atmospheric agdur-ing of biomass burndur-ing plumes in both field and laboratory studies (Grieshop et al., 2009a, b; Hen-nigan et al., 2011; Heringa et al., 2011; Lambe et al., 2011; Jolleys et al., 2012; Giordano et al., 2013; Martin et al., 2013; Ortega et al., 2013; Ding et al., 2016a, b, 2017). For agricul-tural residue burning, evolution processes have not been well characterized yet. To our knowledge, up to now there has only been a chamber study (Li et al., 2015) which has inves-tigated the evolution of aerosol particles emitted by wheat straw burning under dark conditions. Although field stud-ies (Adler et al., 2011; X. X. Liu et al., 2016) witnessed the evolution in mass concentrations, size distribution, oxi-dation state and optical properties of aerosol particles emit-ted by agricultural residue burning, these changes could be also influenced by other emission sources and meteorologi-cal conditions as well. Since NMOGs emitted by agricultural residue burning are not fully quantified, it is still challenging to predict the concentration and physicochemical properties of SOA that resulted from biomass burning (Spracklen et al., 2011; Jathar et al., 2014; Shrivastava et al., 2015; Hatch et al., 2017). Bruns et al. (2016) suggested that the 22 major NMOGs identified in residential wood combustion could ex-plain the majority of observed SOA, but it remains unclear whether identified NMOGs emitted by agricultural residue burning could fully (or at least largely) explain the SOA formed. In addition, aerosol mass spectrometry (AMS) has been widely used to characterize sources and evolution of ambient OA (Q. Zhang et al., 2011). Although agricultural residue burning is an important type of biomass burning in Asia and especially in China, the lack of AMS spectra for pri-mary and aged OA from agricultural residue burning signifi-cantly limits further application of AMS in BBOA research. In this study, plumes from agricultural residue open burn-ing were directly introduced into a large indoor chamber to firstly characterize primary emissions and then investigate their photochemical evolution under ∼ 25◦C and ∼ 50 % rel-ative humidity. Corn, rice and wheat straws, which account for more than 90 % of the crop residues burned in China (FAO, 2017), were chosen. A suite of advanced online and offline techniques were utilized to measure gaseous and par-ticulate species, enabling comprehensive measurements of
emission factors of gaseous and particulate compounds for burning of each type of straw under ambient dilution con-ditions. In addition, the corresponding formation and trans-formation of SOA during photochemical aging were investi-gated using a large indoor smog chamber. This work would help improve our understanding of primary emission, SOA formation and thus environmental impacts of agricultural residue burning.
2 Materials and methods 2.1 Experimental setup
Photochemical aging was investigated in a smog chamber at the Guangzhou Institute of Geochemistry, Chinese Academy of Sciences (GIG-CAS). The GIG-CAS smog chamber is a ∼30 m3fluorinated ethylene propylene (FEP) reactor housed in a temperature-controlled room. Details of the chamber setup and associated facilities are provided elsewhere (Wang et al., 2014; Liu et al., 2015; Deng et al., 2017). Briefly, 135 black lamps (1.2 m long, 60 W Philips, Royal Dutch Philips Electronics Ltd, the Netherlands) are used as light sources, giving a NO2photolysis rate of approximately 0.25 min−1.
Two Teflon-coated fans are installed inside the reactor to ensure introduced gaseous and particulate species mixed well within 2 min. Prior to each experiment, the reactor was flushed with the purified dry air at a rate of 100 L min−1for at least 48 h. The compressed indoor air is forced through an air dryer (FXe1; Atlas Copco; Sweden) and a series of gas scrubbers containing activated carbon, Purafil, Hopcalite and allochroic silica gel, followed by a PTFE filter to provide the source of the purified air. The purified dry air contains <1 ppb NOx, O3and carbonyl compounds, < 5 ppb NMHCs
and no detectable particles with relative humidity < 5 %. Corn, rice and wheat straws were collected from Henan, Hunan and Guangdong provinces, respectively. Since mois-ture content in straws would affect emission factors of atmo-spheric pollutants (Sanchis et al., 2014; Ni et al., 2015), all the agricultural residues used in this study were dried in a stove at 80◦C for 24 h before being burned. After baking, the water content in the crop residues was less than 1 %. The water content of crop residues was measured by us-ing the method recommended by Liao et al. (2004). Straws were weighed before and after baking in a stove at 105◦for 24 h, and the difference in weights was calculated to be the weight of the water in the crop residues. Water content was the quotient of the water weight and the whole weight of the straws. In each experiment, ∼ 300 g straws were burned and the burning typically lasted for 3–5 min. Straws were ignited by a butane-fueled lighter and burned under open field burn-ing conditions. The resultburn-ing smoke was collected by an in-verted funnel and introduced into the chamber using an oil-free pump (Gast Manufacturing, Inc, USA) at a flow rate of ∼15 L min−1 through a 5.5 m long copper tube (inner
di-ameter: 3/8 inch), and the residence time in the tube was estimated to be < 2 s. Before each experiment, the transfer tube was pre-flushed for 15 min with ambient air and 2 min with smokes (not introduced into the chamber reactor). Dur-ing the whole process, the tube was heated at 80◦C to re-duce the losses of organic vapors. Based on the volumes of the smoke introduced and the chamber reactor, the dilution ratios were estimated to be 1300–4000, falling into the typ-ical range (1000–10000) under ambient dilution conditions (Robinson et al., 2007). After being characterized in the dark for > 20 min, black lamps were turned on and the diluted smokes were photochemically aged for 5 h. At the end, the black lamps were switched off and the aged aerosols were characterized in the next 1 h to determine the particle wall loss. The particle size evolved through the course of photo-oxidation, and the differences in particle wall-loss rates dur-ing photoreaction and after the lamps were off brought about by the size evolving are estimated to be within ±9 % (Fig. S1 in the Supplement).
In total 20 experiments were conducted (9 for rice straw, 6 for corn straw and 5 for wheat straw), among which 14 exper-iments were conducted only in the dark to measure primary emissions and 6 experiments were carried out both in the dark and under irradiation to investigate photochemical evo-lution of open straw burning emissions. Tables 1 and 2 sum-marize important experimental conditions and key results for all the experiments.
2.2 Instrumentation
Commercial instruments were used for online monitoring of NOx(EC9841T, Ecotech, Australia), NH3(Model 911-0016,
Los Gatos Research, USA) and SO2 (Model 43i, Thermo
Scientific, USA). CH4 and CO were analyzed offline using
gas chromatography (Agilent 6980GC, USA) coupled with a flame ionization detector and a packed column (5A molecu-lar sieve 60/80 mesh, 3 m × 1/8 inch) (Zhang et al., 2012), and CO2 was analyzed using a HP 4890D gas
chromato-graph (Yi et al., 2007). The detection limits were all less than 30 ppbv for CH4, CO and CO2. The relative standard
devia-tions (RSDs) of CO and CO2 measurements were both less
than 3 % based on seven duplicate injection of 1.0 ppmv stan-dards (Spectra Gases Inc, USA). Volatile organic compounds (VOCs) were continuously measured using a proton-transfer-reaction time-of-flight mass spectrometer (PTR-TOF-MS; Model 2000, Ionicon Analytik GmbH, Austria). Calibration of the PTR-TOF-MS was performed every few weeks using a certified custom-made standard mixture of VOCs (Ionicon Analytik Gmbh, Austria) that were dynamically diluted to six levels (2, 5, 10, 20, 50 and 100 ppbv). Methanol, acetoni-trile, acetaldehyde, acrolein, acetone, isoprene, crotonalde-hyde, 2-butanone, benzene, toluene, o-xylene, chloroben-zene and α-pinene were included in the calibration mixture. Their sensitivities, indicated by the ratio of the normalized counts per second to the concentration levels of the VOCs
in ppbv, were used to convert the raw PTR-TOF-MS signal to concentration (Z. Huang et al., 2016). Quantification of the compounds that were not included in the mixture was performed by using calculated mass-dependent sensitivities based on the measured sensitivities (Stockwell et al., 2015). Mass-dependent sensitivities were linearly fitted for oxygen-containing compounds and the remaining compounds sepa-rately. The decay of toluene measured by PTR-TOF-MS was used to derive the OH radical concentrations for every 2 min during each experiment, and the OH exposure was calcu-lated as the product of the OH concentration and the time interval. Continuous monitoring of 20 SOA precursors (in-cluding 9 NMHCs and 11 oxygen-containing VOCs) from PTR-TOF-MS provided us with data to do the SOA predic-tion discussed in the Sects. 2.3.5 and 3.3.2. Air samples were also collected from the chamber reactor using 2 L electro-polished stainless-steel canisters before and after smoke in-jection. In total 67 C2–C12NMHCs were measured (Table S1
in the Supplement) using an Agilent 5973N gas chromatog-raphy mass-selective detector/flame ionization detector (GC-MSD/FID; Agilent Technologies, USA) coupled to a Precon-centrator (Model 7100, Entech Instruments Inc., USA), and analytical procedures have been detailed elsewhere (Wang and Wu, 2008; Zhang et al., 2010, 2012). Results from GC-MSD/FID were used to quantify the emission factors of 67 NMHCs discussed in the Sect. 3.1.
Particle number/volume concentrations and size distribu-tion were measured with a scanning mobility particle sizer (SMPS; Classifier model 3080, CPC model 3775, TSI In-corporated, USA). The SMPS was operated with a sheath flow of 3.0 L min−1and a sampling flow of 0.3 L min−1, al-lowing for a size scanning range of 14 to 760 nm within 255 s. A high-resolution time-of-flight aerosol mass spec-trometer (HR-TOF-AMS; Aerodyne Research Incorporated, USA) was used to measure chemical compositions of non-refractory aerosols (DeCarlo et al., 2006). The HR-ToF-AMS was operated by alternating every other minute between the high sensitivity V mode and the high-resolution W mode. Toolkit Squirrel 1.57I was used to obtain real-time concen-tration variations of sulfate, nitrate, ammonium, chloride and organics, and toolkit Pika 1.16I was used to determine the de-tailed compositions of OA (Aiken et al., 2007, 2008; Cana-garatna et al., 2015). The AMS signal at m/z 44 was cor-rected for the contribution from gaseous CO2. The ionization
efficiency of the AMS was calibrated routinely by measuring 300 nm monodisperse ammonium nitrate aerosols. Consider-ing the underestimation of particulate matter by the AMS, aerosol mass measured by AMS was corrected with the data from the SMPS and the aethalometer. Conductive silicon tubes were used for aerosol sampling to reduce electrostatic losses of particles.
BC was measured with a seven-channel aethalometer (Model AE-31, Magee Scientific, USA). Cheng et al. (2016) measured the mass absorption efficiency (MAE) of BC from biomass burning at wavelengths of 532 and 1047 nm,
respec-tively, and the absorption Ängström exponents (AAEs) were estimated to be in the range of 0.9–1.1. Based on the re-lationship between MAE and wavelength, a MAE value of 4.7 m2g−1was calculated for 880 nm by assuming the AAE to be 1.0. The MAE value was then applied to convert absorp-tion data in 880 nm to BC mass concentraabsorp-tions. Aethalometer attenuation measurements were corrected for particle loading effects and the scattering of filter fibers using the method de-veloped by Kirchstetter and Novakov (2007) and Schmid et al. (2006).
2.3 Data analysis
2.3.1 Particle effective density
Assuming that particles are spherical and non-porous, the ef-fective density (ρeff)can be estimated by Eq. (1) (DeCarlo et
al., 2004; Schmid et al., 2007): ρeff=ρ0·
dva
dm
, (1)
where ρ0is the standard density (1.0 g cm−3), and dvaand dm
are the AMS-measured vacuum aerodynamic diameter and SMPS-measured mobility diameter. The input diameters to this equation were determined by comparing distributions of vacuum aerodynamic and electric mobility diameters, using the AMS and SMPS, respectively. Derived ρeff was used to
convert volume concentrations of aerosol particles measured by the SMPS to mass concentrations.
2.3.2 Emission factors and modified combustion efficiency
The carbon mass balance approach (Ward et al., 1992; An-dreae and Merlet, 2001) was used to calculate fuel-based emission factors (EFs) for each compound (g kg−1dry fuel). The emission factor for the ith species, EFi, is calculated by
Eq. (2): EFi=
mi·EFC
1[CO2] +1[CO] + 1[PMC] +1[HC]
, (2)
where mi is the concentration (g m−3) of the ith species;
1[CO2], 1[CO], and 1[HC] are the background-corrected
carbon mass concentration (g C m−3) of the CO2, CO,
and speciated hydrocarbons, respectively; 1[PMC] is
the background-corrected carbon in the particle phase (g C m−3); and EFCis the emission factor of carbon into the
air determined by elemental and gravitational analyses, given by Eq. (3):
EFC=
mfuel·ωfuel−mash·ωash
mfuel
, (3)
where ωfueland ωashare mass fractions of carbon in the dry
Table 1. Primary emission factors measured for agricultural residue burning. All the units are g kg−1, except that the unit for particle number (PN) is 1015particle kg−1. MCE: modified combustion efficiency; NMHCs: non-methane hydrocarbons; POA: primary organic aerosol; POC primary organic carbon; BC: black carbon.
Rice Corn Wheat
Species This study (n = 9) Others This study (n = 6) Others This study (n = 5) Others MCE 0.926 ± 0.049 0.953 ± 0.019 0.949 ± 0.035 CO2 1262 ± 81 1477 ± 28 1423 ± 60 CO 63.5 ± 41.4 46.1 ± 19.2 48.6 ± 33.0 NOx 1.47 ± 0.61 3.51 ± 0.38a 5.00 ± 3.94 4.3 ± 1.8b 3.08 ± 0.93 3.3 ± 1.7b; 2.27 ± 0.04a NH3 0.45 ± 0.15 0.95 ± 0.65a; 0.63 ± 0.30 0.68 ± 0.52b 0.22 ± 0.19 0.37 ± 0.14b; 4.10 ± 1.24c 0.21 ± 0.14a SO2 0.07 ± 0.07 0.18 ± 0.31d; 0.99 ± 1.53 0.04 ± 0.04d 0.72 ± 0.34 0.04 ± 0.04d; 0.37 ± 0.27e; 0.73 ± 0.15a 1.27 ± 0.35a NMHCs 5.04 ± 2.04 1.25f 2.47 ± 2.11 1.59 ± 0.43g 3.08 ± 2.43 1.69 ± 0.58g; 0.90f PM 3.73 ± 3.28 8.5 ± 6.7h; 5.44 ± 3.43 12.2 ± 5.4h; 6.36 ± 2.98 11.4 ± 4.9h; 8.3 ± 2.2e; 11.7 ± 1.0b; 7.6 ± 4.1b; 13.2 ± 1.44i; 5.36 ± 0.55i 5.30 ± 0.30i 4.2c PN 2.94 ± 0.91 0.018 ± 0.001j 7.29 ± 4.17 0.017 ± 0.001j 5.87 ± 2.89 0.010 ± 0.001j POA 2.99 ± 1.00 3.99 ± 2.68 5.96 ± 0.19 POC 2.05 ± 0.72 3.3 ± 2.8h; 2.52 ± 1.66 6.3 ± 3.6h; 4.11 ± 0.29 5.1 ± 3.0h; 6.02 ± 0.60i 3.9 ± 1.7b; 2.7 ± 1.0b; 2.06 ± 0.34i 2.42 ± 0.13i BC 0.22 ± 0.11 0.21 ± 0.13h 0.24 ± 0.09 0.28 ± 0.09h; 0.27 ± 0.07 0.24 ± 0.12h; 0.35 ± 0.10b 0.49 ± 0.12b
aStockwell et al. (2015);bLi et al. (2007), PM corresponds to PM
2.5;cChristian et al. (2010);dCao et al. (2008);eKim Oanh et al. (2015), PM corresponds to PM2.5; fWang et al. (2014), 56 NMHCs species summarized;gLi et al. (2009), 52 NMHCs species summarized;hNi et al. (2015), PM corresponds to PM
2.5;iLi et al. (2017),
PM corresponds to PM1;jZhang et al. (2008).
and its ash. The modified combustion efficiency (MCE) is de-fined by Eq. (4) (Heringa et al., 2011; Hennigan et al., 2011; Ni et al., 2015):
MCE = 1[CO2] 1[CO2] +1[CO]
. (4)
2.3.3 Ozone formation potential
The ozone formation potential (OFP) of the speciated NMHCs was calculated from the emission factor and maximum incremental reactivity (MIR) of each individual NMHC, using Eq. (5): OFP = n X i=1 (EFi·MIRi), (5)
where OFP is the ozone formation potential of NMHCs emit-ted per unit of biomass (unit: g kg−1), and MIRi is the MIR
of the ith NMHC (unit: g O3g NHMC−1) (Carter, 2008).
2.3.4 Wall-loss corrections
Due to the loss of particles and vapors to chamber walls, measured data in chamber studies need to be corrected for wall loss. For this purpose, in our study 1 h dark decay of aged aerosols was undertaken after photochemical aging was terminated. The loss of particles on the chamber wall is a first-order process (McMurry and Grosjean, 1985). The wall-loss rates of AMS-measured organics, sulfate, nitrate, chlo-ride and ammonium were determined using the dark decay data and were applied to wall-loss correction for the entire experiment. By assuming that the condensed materials on the wall remain completely in equilibrium with the gas phase, we used the ω = 1 case to correct the OA mass, where ω is a pro-portionality factor of organic vapor partitioning to chamber walls and suspended particles (Weitkamp et al., 2007; Henry et al., 2012). For SMPS measurements, the number concen-tration in each size channel (110 channels in total) was cor-rected for wall loss separately, since wall-loss rates of aerosol particles are size-dependent (Takekawa et al., 2003).
Figure 1. (a–c) Non-methane hydrocarbon (NMHC) compositions and (d–f) their relative contribution to ozone formation potential (OFP) for open burning of rice, corn and wheat straw.
2.3.5 OA production prediction
In this study, 20 NMOGs which have been used to estimate SOA yields by previous work (Ng et al., 2007; Chan et al., 2009, 2010; Hildebrandt et al., 2009; Gómez Alvarez et al., 2009; Shakya and Griffin, 2010; Chhabra et al., 2011; Nakao et al., 2011; Borras and Tortajada-Genaro, 2012; Yee et al., 2013; Lim et al., 2013) were quantified using PTR-TOF-MS, and the applied SOA yields are summarized in Table S2. The mass concentration of SOA ([SOA]predicted, µg m−3)formed
from these 20 precursors can be estimated using Eq. (6):
[SOA]predicted=
X
i
(1[Xi] ·Yi), (6)
where 1[Xi] (µg m−3)is the reacted amount of the ith
gas-phase precursor and Yi is the corresponding SOA yield.
Assuming that primary OA (POA) levels stayed con-stant during aging processes, the mass concentration of SOA formed could be estimated as the difference in OA mass con-centrations before and after photochemical aging. It should be noted that POA would decrease during aging processes (Tiitta et al., 2016), probably leading to the underestimation of the formed SOA. In papers where those SOA yields were borrowed from, no organic vapor wall loss was accounted for when calculating the mass concentration of the formed SOA, so the same wall-loss correction method was used when com-paring the predicted SOA and the formed SOA.
3 Results and discussion
3.1 Emissions of gaseous pollutants
Table 1 compares emission factors of gaseous and particulate species measured in our and previous studies. In our study, the emission factors of NOx were 1.47 ± 0.61, 5.00 ± 3.94,
and 3.08 ± 0.93 g kg−1for rice, corn, and wheat straw, and NO accounted for 84 ± 11 % of NOx primary emission for
all experiments. Emission factors of NH3 were measured
to be 0.45 ± 0.15, 0.63 ± 0.30 and 0.22 ± 0.19 g kg−1 for rice, corn and wheat straw. Our measured emission factors of reactive nitrogen species were comparable to those re-ported by previous studies (Li et al., 2007; Tian et al., 2011). Emission factors of SO2 were 0.07 ± 0.07, 0.99 ± 1.53 and
0.72 ± 0.34 g kg−1for rice, corn and wheat straw. Our mea-sured emission factors of SO2were lower than those reported
by Cao et al. (2008) and Kim Oanh et al. (2015) for rice straw, but higher than those reported by Cao et al. (2008) for corn and wheat straw. Due to low sulfur contents in crop straws, the SO2 emission factors for open burning of crop
residues were much lower than those for domestic coal com-bustion, which were determined to be 2.43–5.36 g kg−1 for raw bituminous coal (Du et al., 2016).
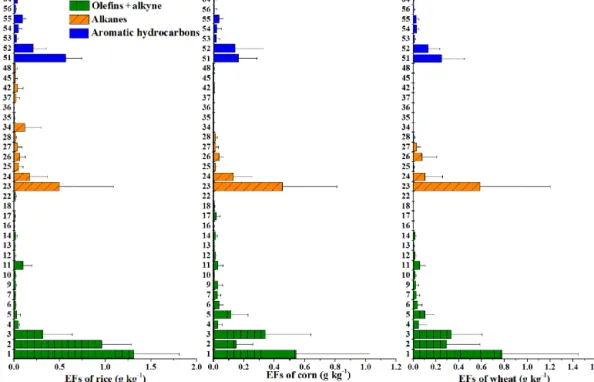
Figure 2. Emission factors (EFs) of NMHCs for straw burning of rice, corn and wheat. Only species with emission factors > 0.01 g kg−1are shown. The order of NMHC species is the same as Table S1, in which a comprehensive dataset of emission factors measured in this work is included.
Emission factors of the total speciated NMHCs analyzed by the GC-MSD/FID system were 5.04 ± 2.04, 2.47 ± 2.11 and 3.08 ± 2.43 g kg−1 for rice, corn and wheat straw, spectively (Table 1). Our results were higher than those re-ported by previous studies (Li et al., 2009; Wang et al., 2014), partly due to the fact that more NMHCs were analyzed in our study (67 species in total). As shown in Fig. 1a–c, olefins and acetylene accounted for 56–58 % of the total speciated NMHCs, followed by alkanes (22–28 %) and aromatic hy-drocarbons (16–21 %). Table S1 and Fig. 2 show the emis-sion factors of each NMHC for open burning of different straws. Emission factors of unsaturated hydrocarbons ranged from 1.37 (corn) to 2.91 g kg−1(rice), with the majority be-ing ethene, acetylene and propene. Emission factors of alka-nes ranged from 0.69 (corn) to 1.09 g kg−1(rice), with ethane and propane being the two most abundant compounds. The emission factors of aromatic hydrocarbons were in the range of 0.42 (corn) to 1.04 (rice), and benzene and toluene are dominant species. It is worth noting that major compounds in the three groups (alkanes, alkenes and aromatic hydrocar-bons) were all negatively correlated with the modified com-bustion efficiency (Fig. S2), suggesting that more efficient combustion would reduce their emissions.
Based on their emission factors, we calculated the ozone formation potential for each NMHC. The summed ozone formation potentials were 22.5 ± 10.1, 13.7 ± 12.4 and 16.3 ± 13.5 g kg−1for open burning of rice, corn and wheat straw, respectively. As shown in Fig. 1d–e, the relative
contri-butions of olefins to the total ozone formation potential could reach > 80 %. Ethene was the largest ozone precursor (35– 42 %), followed by propene (16–28 %), and these two com-pounds contributed 58–64 % of the total ozone formation po-tential. Although the emission factors of aromatic hydrocar-bons were lower than those of alkanes, their ozone formation potential was dominant over those of alkanes, with toluene being the largest contributor among all the aromatic hydro-carbons. The contribution of alkanes to the total ozone for-mation potential was minor (2–3 %). It is noted that oxygen-containing organic vapors in agricultural residue burning plumes could also have large ozone formation potentials. For example, the OFPs of formaldehyde and acetaldehyde for all experiments were 0.57–2.46 times those of the 67 speciated NMHCs.
3.2 Emission of particulate matter
The emission factors of particulate matter were 3.73 ± 3.28, 5.44 ± 3.43 and 6.36 ± 2.98 g kg−1for rice, corn and wheat straw, lower than those reported in the previous studies (Ta-ble 1). As suggested by Robinson et al. (2007), the POA emission factors would decrease with increasing dilution ra-tios, due to evaporation of semi-volatile organic compounds. In this study, the dilution ratios ranged from 1300 to 4000, which were within the typical range of ambient dilution ra-tios (1000–10 000) (Robinson et al., 2007). Therefore, it can be expected that emission factors of primary organic
car-bon (POC) measured in our study (2.05–4.11 gC kg−1)were lower than those measured by previous work with dilution ra-tios of 5–20 (Li et al., 2007; Ni et al., 2015). Moreover, it has been shown that the modified combustion efficiency could af-fect emission factors (Heringa et al., 2011; Stockwell et al., 2015). Figure S3 shows negative correlations of the modi-fied combustion efficiency with emission factors of PM and POC (p < 0.05 for both cases), indicating that enhancement of combustion efficiency could reduce the emissions of PM and POC. In our study, all straws were pre-baked to reduce the moisture content to < 1 %, and this treatment could in-crease the modified combustion efficiency and thus reduce emission factors of particulate matters (Ni et al., 2015). In addition, the amount of straw burned each time in our periments was much less than that in the fields, which is ex-pected to avoid oxygen deficit during burning to some extent and thus increase the modified combustion efficiency as well. While POA emission factors showed large variability for different types of straw, BC emission factors were rela-tively constant (0.22–0.27 gC kg−1). Since BC is a mixture of non-volatile compounds in particulate matters, as expected, its emission factors measured in our work were compara-ble to those reported under lower dilution conditions (Li et al., 2007; Ni et al., 2015). The 1[POA] / 1[CO] ratios ranged from 0.022 to 0.133 in our study, larger than those (0.001–0.067) measured in chamber studies for hard- and soft-wood fires (Grieshop et al., 2009b) and vegetation com-monly burned in North American wildfires (Heringa et al., 2011), but lower than those (0.051–0.329) obtained in field campaigns (Jolleys et al., 2012).
For particle numbers, the emission factors were (2.94 ± 0.91) × 1015, (7.29 ± 4.17) × 1015, and (5.87 ± 2.89) × 1015particle kg−1 for rice, corn, and wheat straw, respectively (Table 1). Our results were com-parable to that (1 × 10¹⁵particle kg−1) for crop residue burning (Andreae and Merlet, 2001) and those (3.2 × 10¹⁵– 10.9 × 10¹⁵particle kg−1) for wood burning (Hosseini et al., 2013), but 2 magnitudes larger than those for crop residue burning in a sealed stove (Zhang et al., 2008).
3.3 Evolution of particles 3.3.1 Growth of particle size
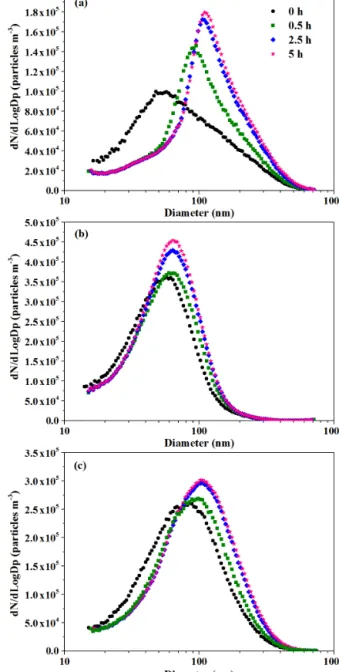
Figure 3 shows the evolution of particle size distribution af-ter photochemical aging of 0, 0.5, 2.5 and 5 h. Aerosol par-ticles emitted from open straw burning peaked at 50–90 nm under ambient dilution conditions. The geometric mean di-ameters for primarily emitted particles in this study were smaller than those (100–150 nm) reported for crop residual burning under low dilution conditions (H. Zhang et al., 2011; Li et al., 2015), probably due to evaporation of organic va-pors under the high dilution conditions (Lipsky et al., 2006) and coagulation of fine particles under the low dilution con-ditions (Hossain et al., 2012).
Figure 3. Particle size distributions in different burnings. (a) Burn 2: rice straw; (b) Burn 3: corn straw; (c) Burn 5: wheat straw.
After switching on black lamps, apparent growth of parti-cle size was observed. In all the aging experiments, growth rates of particle diameters in the first 0.5 h were 10 times larger than those afterwards, and after 5 h aging the geomet-ric mean diameters peaked at 60–120 nm. For instance, in the photochemical aging experiment for wheat straw burn-ing (Fig. 3c), the growth rate of particles was 18 nm h−1in the first 0.5 h and decreased to ∼ 1 nm h−1during the follow-ing 4.5 h. The size distribution of aged aerosol particles in our study is similar to those of ambient particles under the
Figure 4. (a) The evolution of particulate matter components (Burn 2). (b) OA mass growth as a function of OH exposure (Burn 5).
severe biomass burning impact during haze events (Betha et al., 2014; Niu et al., 2016).
3.3.2 Particle mass enhancement
Figure 4 shows the chemical evolution of aerosol particles during the 5 h photochemical aging of wheat straw burn-ing. During the whole process, OA kept increasing and was dominant over inorganic species. After 3 h of photochemical aging, the levels of all the inorganic species were constant, and nitrate was the second most abundant component, with a mass fraction of 7 %, followed by chloride (2 %), ammonium (1 %) and sulfate (< 1 %). Figure 4b depicts [OA] evolution as a function of OH exposure. OA increased slowly in the first ∼ 0.2 h, and then increased rapidly with OH exposure.
The OA enhancement ratio, defined as the mass ra-tio of aged OA at the end of each aging experiment to POA, was calculated. In the six aging experiments, the OH exposure and OA enhancement ratios ranged from (1.87–4.97) × 1010molecule cm−3s to 2.4–7.6, re-spectively. Assuming an average OH concentration of 1.5 × 10⁶molecule cm−3 in the ambient air (Hayes et al., 2013), this means that rapid SOA formation would occur
in 3.5–9.2 h during the daytime after straw burning. The OA enhancement ratios determined in our study were higher than those (0.7–2.9) for the combustion of vegetation com-monly burned in North American wildfires (Hennigan et al., 2011), and comparable to those (0.7–6.9) for wood burning (Grieshop et al., 2009b; Heringa et al., 2011).
Recently, Bruns et al. (2016) found that 22 NMOGs emit-ted from residential wood burning could explain the major-ity of the formed SOA. In our study, 20 of the 22 NMOGs were detected and quantified with the PTR-TOF-MS. Con-centration differences of each compound before and after photo-oxidation were calculated to estimate the SOA formed from these precursors. Since SOA formation highly depends on oxidation conditions, SOA yields for a certain precur-sor vary with VOC / NOx ratios. In our work, we chose a
set of SOA yields for these NMOGs based on the observed VOC / NOx ratio in the chamber experiments. More
specif-ically, if the observed VOC / NOx ratio for a certain
pre-cursor in the chamber was within the VOC / NOx range
re-ported in the literature, the mean value of the highest and lowest yields within the VOC / NOx range in the literature
was used to estimate the SOA formed from the precursor in the chamber; if the observed VOC / NOx ratio for a certain
precursor was higher than the maximum VOC / NOx ratio
reported in the literature, we chose the yield reported at the maximum VOC / NOxratio; if the observed VOC / NOx
ra-tio was lower than the minimum VOC / NOx ratio reported
in the literature, we chose the yield reported at the minimum VOC / NOxratio.
Figure 5a shows the time series of POA, SOApredicted and
unexplained SOA in a typical aging experiment. The con-tribution of SOApredicted by the 20 NMOGs was minor, and
large fractions of observed SOA could not be explained. In all the experiments, only 5.0–27.3 % of the observed SOA mass could be explained by the 20 NMOGs (Fig. 5b). Even if the highest SOA yield for each precursor reported in the lit-erature were used, 60–90 % of the observed SOA mass could still not be explained. It has been suggested that aqueous-phase oxidation of alkenes could produce substantial SOA (Ervens et al., 2011). Considering large emissions of olefins from straw burning (Fig. 1a–c), we also estimated the SOA formed from the three most abundant alkenes (ethene, acety-lene, and propene) with their newly developed SOA yields (Ge et al., 2016, 2017; Jia and Xu, 2016), and their total contribution to the observed SOA was found to be negligi-ble (< 0.5 %). It is noted that although over 80 VOCs species were quantified by the GC-MSD/FID and the PTR-TOF-MS in this study, only 20 species among them were taken into the SOA prediction because of the lack of published data for SOA yields. The unaccounted VOC species might be a reason for the discrepancy. On the other hand, as indicated by Deng et al. (2017), SOA yields obtained from chamber studies in purified air matrix might be lower than that in a real ambient air matrix. Consequently, using SOA yields from studies in a purified air matrix might also underpredict
Figure 5. (a) Time series plots of concentrations of POA, sec-ondary organic aerosol that can be explained by the reacted pre-cursors (SOApredicted), the difference between the formed SOA and the predicted SOA (unexplained SOA) in Burn 6. (b) Contribution of 20 NMOGs to the formed SOA at the end of photoreactions. Error bars correspond to the range of contributions when the low-est/highest SOA yields in references were used for all precursors.
SOA yields in the complex biomass burning plume matrix. Moreover, oxidation of particulate organic matter (POM), like semi-volatile organic compounds (SVOCs) and interme-diate volatility organic compounds (IVOCs), would also con-tribute substantially to SOA formation (Presto et al., 2009; Zhao et al., 2014), yet this is not accounted for in our pre-diction. Above all, there are still unknown precursors and/or physicochemical processes contributing the majority of SOA formed from open straw burning.
3.3.3 OA mass spectrum evolution
In the high-resolution W mode of AMS, ions generated from particles could be identified by their exact mass–charge ratio (m/z) and then grouped into the CHON, CHO, CHN and CH families. Figure 6 presents the evolution of OA mass
spec-Figure 6. (a) Mass spectrum of POA; (b) mass spectrum of aged OA; (c) difference in mass spectra between aged OA and POA. The data were all taken from Burn 5.
tra. For POA (Fig. 6a), the CH-family was the major compo-nent, with a mass fraction of 68 %, followed by CHO (23 %), CHN (6 %), and CHON (2 %). The ions at m/z 43, 41 and 55 were the dominant peaks in the POA mass spectrum. The major ions at m/z 27, 39, 41, 55, 57, 67 and 69 belonged to the CH-family and could be the fragments of hydrocarbons (Weimer et al., 2008). The peaks at m/z 28, 29, 43, 44 and 55 contained considerable CHO ions, and the corresponding ions (CO+, CHO+, C2H3O+, CO+2 and C3H3O+)could be
the fragments of aldehydes, ketones and carboxylic acid (Ng et al., 2011a). The peak at m/z 91 was mainly attributed to C7H+7, possibly originating from aromatic compounds.
The mass spectra of aged OA were quite different from those of POA (Fig. 6b–c). The mass fraction of the CH-family decreased to 46 % and was comparable to that of the CHO-family, while the contribution of N-containing OA (CHN and CHON) increased to ∼ 11 %. The ions at m/z 44 and 43, mainly coming from the CHO-family, became the dominant peaks for the aged OA. The fractions of two ma-jor masses at m/z 44 (f44)and m/z 43 (f43)in OA can be
used to generate an f44 vs. f43 triangular space, in which
Figure 7. (a) Comparison of f44 vs. f43 determined in our work with those for the ambient BBOA data sets (Ng et al., 2011b) and the ambient OOA range (Ng et al., 2010). The typical f44 ranges of ambient SV-OOA and LV-OOA are indicated with the vertical arrows. (b) Comparison of f44vs. f60for straw burning OA with those for other types of biomass burning OA (Alfarra et al., 2007; Hennigan et al., 2011; Cubison et al., 2011; Brito et al., 2014; May et al., 2015).
during the aging process (Ng et al., 2010). In addition, f44
in the ambient air was suggested to be 0.07 ± 0.04 for semi-volatile OOA (SV-OOA) and 0.17 ± 0.04 for low-volatility OOA (LV-OOA), respectively (Ng et al., 2010). Figure 7a plots f44and f43of the POA and the aged OA in all six
ex-periments. Most of the data are within the f44 vs. f43
trian-gular space and close to the left margin. Photochemical aging led to an increase in f44 for all the experiments, suggesting
transformation of OA from SV-OOA to LV-OOA. For com-parison, the f43did not change significantly in all the
exper-iments. The main ions at m/z 43 were C2H3O+and C3H+7.
It can be observed in Fig. 6c that the increased contribution of C2H3O+ and the decreased contribution of C3H+7 were
comparable during photoreaction.
The ion at m/z 60, mainly consisting of C2H4O+2, is
re-garded as a BBOA marker, and the mass fraction of this ion
in OA, f60, is widely used to probe the evolution of BBOA
(Brito et al., 2014; May et al., 2015). Figure 7b plots the evo-lution of f44and f60in all the experiments conducted in this
study, in order to compare them with measurements in aging biomass burning plumes (Cubison et al., 2011) and those in the POA from different types of biomass burning (Alfarra et al., 2007; Brito et al., 2014; May et al., 2015). Photo-oxidation caused an increase in f44and a decrease in f60, and
this is consistent with the general evolution of OA in ambi-ent biomass burning plumes (Cubison et al., 2011). However, our measured f60, 0.003–0.006 in the POA from open straw
burning and 0.002–0004 in aged OA, were all lower than those from other field campaigns and quite near the back-ground f60 level of 0.003 for ambient OA (Cubison et al.,
2011; Fig. 7b). Low values of f60(0.005–0.02) were also
re-ported by Hennigan et al. (2011) in a chamber study for fuels commonly burned in wildfires. In their study, biomass burn-ing took place in a 3000 m3 combustion chamber, and the smokes were then injected into another chamber for aging experiments with a dilution ratio of ∼ 25. Previous studies have demonstrated that levoglucosan is a semi-volatile com-pound with a saturation concentration of ∼ 8 µg m−3at 293 K (Grieshop et al., 2009b; Huffman et al., 2009; Hennigan et al., 2011). As a result, the high dilution conditions used in our study would cause levoglucosan to evaporate, and this may at least partly explain the low f60observed in the POA from
straw burning. From previous studies, the levoglucosan / OC ratios of straw burning ranging from 4.92 to 16.8 % (4 types of vegetation summarized; Dhammapala et al., 2007; Kim Oanh et al., 2011; Hall et al., 2012) were not significantly (two-sample t -test, p > 0.05) lower than those of prescribed fuel burning, wildfire and wood burning ranging from 1.46 to 13.5 % (20 types of vegetation summarized; Hosseini et al., 2013; Shahid et al., 2015). So the difference in fuel type cannot explain the lower f60observed in our study.
3.3.4 Elemental ratio and oxidation state of OA In this study, the O / C and H / C ratios in the POA from dif-ferent straws burning were in the ranges of 0.20–0.38 and 1.58–1.74, respectively. After 5 h aging, O / C increased and H/C decreased (Table 2). Kroll et al. (2011) proposed a met-ric, the average carbon oxidation state (OSc), to describe
the degree of oxidation of atmospheric organic species. OSc
could be calculated from the elemental composition of OA measured by AMS, given by Eq. (7):
OSc=2 × O / C − H / C. (7)
In this study, the OSc values for the fresh POA from open
straw burning ranged from −1.25 to −0.89, consistent with those suggested for BBOA (−1 to −0.7) (Kroll et al., 2011). During photochemical aging, the OSc values increased
lin-early (p < 0.001) with OH exposure (Fig. 8), and the slopes were quite near each other even for different types of straws,
Table 2. Overview of important experimental conditions and key results in the photochemical oxidation experiments. The unit for OH exposure is 1010molecule cm−3s. NA: data were not available because no data were recorded in the W-mode.
NO. Straw type Temp (◦C) RH (%) OH POA Aged OA OA exposure O / C H / C OSc O / C H / C OSc ER Burn 1 Rice 25.0 ± 0.4 48.9 ± 1.4 3.80 NA NA NA NA NA NA 2.7 Burn 2 Rice 25.1 ± 0.4 55.0 ± 2.3 4.97 0.25 1.74 −1.25 0.50 1.65 −0.65 7.6 Burn 3 Corn 25.5 ± 0.4 53.0 ± 2.9 4.16 0.38 1.66 −0.89 0.60 1.66 −0.46 3.6 Burn 4 Corn 26.1 ± 0.4 48.4 ± 2.2 4.16 0.30 1.58 −0.97 0.65 1.57 −0.26 4.6 Burn 5 Wheat 25.3 ± 0.5 52.8 ± 2.2 3.20 0.20 1.66 −1.25 0.50 1.56 −0.55 2.4 Burn 6 Wheat 25.2 ± 0.4 55.1 ± 2.7 1.87 0.26 1.71 −1.20 0.53 1.66 −0.61 6.6
Figure 8. The growth of the OA carbon oxidation state with OH exposure for burning corn (Burns 3 and 4) and wheat (Burns 5 and 6) straws. Data for burning rice straws were not included since in Burn 1 AMS was then not run in W-mode.
implying AMS measured OSc might be a good indicator of
OH exposure and thereby of photochemical aging.
Figure 9 shows the Van Krevelen diagram of OA. In this study, the slopes of linear correlations between H / C and O / C range from −0.49 to −0.24 for the five experiments. Slopes of −1, 0.5 and 0 in the Van Krevelen diagrams in-dicate addition of carboxylic acids without fragmentation, addition of carboxylic acids with fragmentation, and addi-tion of alcohols/peroxides, respectively (Heald et al., 2010; Ng et al., 2011a). Therefore, the slopes determined in our study suggest that open straw burning OA aging resulted in net changes in chemical composition equivalent to addition of carboxylic acid groups with C–C bond breakage and addi-tion of alcohol/peroxide funcaddi-tional groups.
4 Conclusion
In this study, primary emissions of open burning of rice, corn and wheat straw and their photochemistry were inves-tigated using a large indoor chamber. Emission factors of NOx, NH3, SO2, 67 NMHCs, PM and particle number were
Figure 9. Van Krevelen diagram for the OA. Each slope corre-sponds to the addition of a specific functional group to an aliphatic carbon.
measured under dilution ratios ranging from 1300 to 4000. Emission factors of PM (3.73–6.36 g kg−1)and POC (2.05– 4.11 gC kg−1) were lower than those reported in previous studies conducted at lower dilution ratios, probably due to the evaporation of semi-volatile organic compounds. Emis-sion factors of POC, PM and major NMHC compounds were all negatively correlated with the modified combustion ef-ficiency, suggesting that incomplete burning of agricultural residues could lead to larger primary emission.
Both agricultural residue burning and domestic coal com-bustion have been recognized as contributing substantially to the deteriorating regional air quality, especially in rural ar-eas of China (Pan et al., 2015; J. Liu et al., 2016; Zhu et al., 2016). The emission factors of the speciated NMHCs, PM, NOx, CO and SO2from combustion of raw bituminous coal,
which is currently prevalent for cooking and heating in ru-ral areas, have been reported to be 0.56–5.40, 25.49 ± 2.30, 0.97 ± 0.03, 208 ± 5 and 2.43–5.36 g kg−1, respectively (Du et al., 2016; Li et al., 2016; Liu et al., 2017). Annually burned crop residues and domestic coals were estimated to be 160 Tg (Q. Li et al., 2016) and 99.6 Tg (NBSPRC, 2014) in China. Therefore, with the emission factors of the speciated
NMHCs (2.47–5.04 g kg−1), PM (3.73–6.36 g kg−1), NOx
(1.47–5.00 g kg−1), CO (46.1–63.5 g kg−1)and SO2(0.07–
0.99 g kg−1)measured for agricultural residue burning in this study, agricultural residue burning might emit more NMHCs and NOx but less primary PM, CO and SO2than domestic
coal burning on a national scale.
Photochemical aging of primary emissions was investi-gated with OH exposure equal to 3.2–9.2 h under typical am-bient conditions, and at the end of experiments the OA mass concentrations increased by a factor of 2.4–7.6, suggesting that SOA could be rapidly produced within several hours. Our estimation suggests that phenols are the most important identified SOA precursors, and more than 70 % of the formed OA still cannot be explained by the oxidation of known pre-cursors. Measurements using HR-TOF-AMS reveal that af-ter photochemical aging, signals for oxygen- and nitrogen-containing compounds were largely increased, with OSc
in-creased in a highly significant linear way with OH exposure.
Data availability. The data used in this publication are available to the community and can be accessed by request to the corresponding author.
The Supplement related to this article is available online at https://doi.org/10.5194/acp-17-14821-2017-supplement.
Competing interests. The authors declare that they have no conflict of interest.
Acknowledgements. This study was supported by the Strategic Pri-ority Research Program of the Chinese Academy of Sciences (grant no. XDB05010200), the National Natural Science Foundation of China (grant no. 41530641/41571130031/41673116/41503105), the National Key Research and Development Program (2016YFC0202204) and the Guangzhou Science Technology and Innovation Commission (201505231532347).
Edited by: Aijun Ding
Reviewed by: two anonymous referees
References
Adler, G., Flores, J. M., Abo Riziq, A., Borrmann, S., and Rudich, Y.: Chemical, physical, and optical evolution of biomass burn-ing aerosols: a case study, Atmos. Chem. Phys., 11, 1491–1503, https://doi.org/10.5194/acp-11-1491-2011, 2011.
Aiken, A. C., DeCarlo, P. F., and Jimenez, J. L.: Elemen-tal analysis of organic species with electron ionization high-resolution mass spectrometry, Anal. Chem., 79, 8350–8358, https://doi.org/10.1021/ac071150w, 2007.
Aiken, A. C., Decarlo, P. F., Kroll, J. H., Worsnop, D. R., Huff-man, J. A., Docherty, K. S., Ulbrich, I. M., Mohr, C., Kim-mel, J. R., Sueper, D., Sun, Y., Zhang, Q., Trimborn, A., Northway, M., Ziemann, P. J., Canagaratna, M. R., Onasch, T. B., Alfarra, M. R., Prevot, A. S. H., Dommen, J., Du-plissy, J., Metzger, A., Baltensperger, U., and Jimenez, J. L.: O / C and OM / OC ratios of primary, secondary, and ambi-ent organic aerosols with high-resolution time-of-flight aerosol mass spectrometry, Environ. Sci. Technol., 42, 4478–4485, https://doi.org/10.1021/es703009q, 2008.
Akagi, S. K., Yokelson, R. J., Wiedinmyer, C., Alvarado, M. J., Reid, J. S., Karl, T., Crounse, J. D., and Wennberg, P. O.: Emis-sion factors for open and domestic biomass burning for use in atmospheric models, Atmos. Chem. Phys., 11, 4039–4072, https://doi.org/10.5194/acp-11-4039-2011, 2011.
Alfarra, M. R., Prevot, A. S. H., Szidat, S., Sandradewi, J., Weimer, S., Lanz, V. A., Schreiber, D., Mohr, M., and Baltensperger, U.: Identification of the mass spectral signature of organic aerosols from wood burning emissions, Environ. Sci. Technol., 41, 5770– 5777, https://doi.org/10.1021/es062289b, 2007.
Alves, N. d. O., Brito, J., Caumo, S., Arana, A., Hacon, S. d. S., Artaxo, P., Hillamo, R., Teinila, K., Batistuzzo de Medeiros, S. R., and Vasconcellos, P. d. C.: Biomass burning in the Amazon region: Aerosol source apportionment and associ-ated health risk assessment, Atmos. Environ., 120, 277–285, https://doi.org/10.1016/j.atmosenv.2015.08.059, 2015.
Andreae, M. O. and Merlet, P.: Emission of trace gases and aerosols from biomass burning, Global Biogeochem. Cy., 15, 955–966, https://doi.org/10.1029/2000GB001382, 2001.
Andreae, M. O., Rosenfeld, D., Artaxo, P., Costa, A. A., Frank, G. P., Longo, K. M., and Silva-Dias, M. A. F.: Smoking Rain Clouds over the Amazon, Science, 303, 1337–1342, https://doi.org/10.1126/science.1092779, 2004.
Arnold, S. R., Emmons, L. K., Monks, S. A., Law, K. S., Rid-ley, D. A., Turquety, S., Tilmes, S., Thomas, J. L., Bouarar, I., Flemming, J., Huijnen, V., Mao, J., Duncan, B. N., Steen-rod, S., Yoshida, Y., Langner, J., and Long, Y.: Biomass burn-ing influence on high-latitude tropospheric ozone and reac-tive nitrogen in summer 2008: a multi-model analysis based on POLMIP simulations, Atmos. Chem. Phys., 15, 6047–6068, https://doi.org/10.5194/acp-15-6047-2015, 2015.
Betha, R., Zhang, Z., and Balasubramanian, R.: Influ-ence of trans-boundary biomass burning impacted air masses on submicron particle number concentra-tions and size distribuconcentra-tions, Atmos. Environ., 92, 9–18, https://doi.org/10.1016/j.atmosenv.2014.04.002, 2014.
Bond, T. C., Streets, D. G., Yarber, K. F., Nelson, S. M., Woo, J. H., and Klimont, Z.: A technology-based global inventory of black and organic carbon emissions from combustion, J. Geophys. Res.-Atmos., 109, D14203, https://doi.org/10.1029/2003jd003697, 2004.
Bond, T. C., Doherty, S. J., Fahey, D. W., Forster, P. M., Berntsen, T., DeAngelo, B. J., Flanner, M. G., Ghan, S., Kaercher, B., Koch, D., Kinne, S., Kondo, Y., Quinn, P. K., Sarofim, M. C., Schultz, M. G., Schulz, M., Venkataraman, C., Zhang, H., Zhang, S., Bellouin, N., Guttikunda, S. K., Hopke, P. K., Jacobson, M. Z., Kaiser, J. W., Klimont, Z., Lohmann, U., Schwarz, J. P., Shindell, D., Storelvmo, T., Warren, S. G., and Zender, C. S.: Bounding the role of black carbon in the climate system: A
sci-entific assessment, J. Geophys. Res.-Atmos., 118, 5380–5552, https://doi.org/10.1002/jgrd.50171, 2013.
Borras, E. and Tortajada-Genaro, L. A.: Secondary or-ganic aerosol formation from the photo-oxidation of benzene, Atmos. Environ., 47, 154–163, https://doi.org/10.1016/j.atmosenv.2011.11.020, 2012.
Brassard, P., Palacios, J. H., Godbout, S., Bussieres, D., Lagace, R., Larouche, J. P., and Pelletier, F.: Comparison of the gaseous and particulate matter emissions from the combustion of agricul-tural and forest biomasses, Bioresour. Technol., 155, 300–306, https://doi.org/10.1016/j.biortech.2013.12.027, 2014.
Brito, J., Rizzo, L. V., Morgan, W. T., Coe, H., Johnson, B., Haywood, J., Longo, K., Freitas, S., Andreae, M. O., and Artaxo, P.: Ground-based aerosol characterization during the South American Biomass Burning Analysis (SAMBBA) field experiment, Atmos. Chem. Phys., 14, 12069–12083, https://doi.org/10.5194/acp-14-12069-2014, 2014.
Bruns, E. A., El Haddad, I., Slowik, J. G., Kilic, D., Klein, F., Baltensperger, U., and Prevot, A. S. H.: Identification of significant precursor gases of secondary organic aerosols from residential wood combustion, Sci. Rep., 6, 27881, https://doi.org/10.1038/srep27881, 2016.
Bruns, E. A., Slowik, J. G., El Haddad, I., Kilic, D., Klein, F., Dommen, J., Temime-Roussel, B., Marchand, N., Baltensperger, U., and Prévôt, A. S. H.: Characterization of gas-phase organics using proton transfer reaction time-of-flight mass spectrometry: fresh and aged residential wood combustion emissions, Atmos. Chem. Phys., 17, 705–720, https://doi.org/10.5194/acp-17-705-2017, 2017.
Canagaratna, M. R., Jimenez, J. L., Kroll, J. H., Chen, Q., Kessler, S. H., Massoli, P., Hildebrandt Ruiz, L., Fortner, E., Williams, L. R., Wilson, K. R., Surratt, J. D., Donahue, N. M., Jayne, J. T., and Worsnop, D. R.: Elemental ratio measurements of organic compounds using aerosol mass spectrometry: characterization, improved calibration, and implications, Atmos. Chem. Phys., 15, 253–272, https://doi.org/10.5194/acp-15-253-2015, 2015. Cao, G., Zhang, X., Gong, S., and Zheng, F.: Investigation
on emission factors of particulate matter and gaseous pollu-tants from crop residue burning, J. Environ. Sci., 20, 50–55, https://doi.org/10.1016/S1001-0742(08)60007-8, 2008. Carter, W. P. L.: Reactivity estimates for selected consumer product
compounds, Air resources Board, California, Contract No. 06-408, 72–99, 2008.
Chan, A. W. H., Kautzman, K. E., Chhabra, P. S., Surratt, J. D., Chan, M. N., Crounse, J. D., Kürten, A., Wennberg, P. O., Flagan, R. C., and Seinfeld, J. H.: Secondary organic aerosol formation from photooxidation of naphthalene and alkylnaph-thalenes: implications for oxidation of intermediate volatility or-ganic compounds (IVOCs), Atmos. Chem. Phys., 9, 3049–3060, https://doi.org/10.5194/acp-9-3049-2009, 2009.
Chan, A. W. H., Chan, M. N., Surratt, J. D., Chhabra, P. S., Loza, C. L., Crounse, J. D., Yee, L. D., Flagan, R. C., Wennberg, P. O., and Seinfeld, J. H.: Role of aldehyde chemistry and NOxconcentrations in secondary organic aerosol formation, At-mos. Chem. Phys., 10, 7169–7188, https://doi.org/10.5194/acp-10-7169-2010, 2010.
Cheng, Y., Engling, G., He, K.-B., Duan, F.-K., Ma, Y.-L., Du, Z.-Y., Liu, J.-M., Zheng, M., and Weber, R. J.: Biomass burning
contribution to Beijing aerosol, Atmos. Chem. Phys., 13, 7765– 7781, https://doi.org/10.5194/acp-13-7765-2013, 2013. Cheng, Y., Engling, G., Moosmaller, H., Arnott, W. P., Chen, L. W.
A., Wold, C. E., Hao, W. M., and He, K. B.: Light absorption by biomass burning source emissions, Atmos. Environ., 127, 347– 354, https://doi.org/10.1016/j.atmosenv.2015.12.045, 2016. Chhabra, P. S., Ng, N. L., Canagaratna, M. R., Corrigan, A.
L., Russell, L. M., Worsnop, D. R., Flagan, R. C., and Se-infeld, J. H.: Elemental composition and oxidation of cham-ber organic aerosol, Atmos. Chem. Phys., 11, 8827–8845, https://doi.org/10.5194/acp-11-8827-2011, 2011.
Christian, T. J., Yokelson, R. J., Cárdenas, B., Molina, L. T., En-gling, G., and Hsu, S.-C.: Trace gas and particle emissions from domestic and industrial biofuel use and garbage burn-ing in central Mexico, Atmos. Chem. Phys., 10, 565–584, https://doi.org/10.5194/acp-10-565-2010, 2010.
Cubison, M. J., Ortega, A. M., Hayes, P. L., Farmer, D. K., Day, D., Lechner, M. J., Brune, W. H., Apel, E., Diskin, G. S., Fisher, J. A., Fuelberg, H. E., Hecobian, A., Knapp, D. J., Mikoviny, T., Riemer, D., Sachse, G. W., Sessions, W., Weber, R. J., Wein-heimer, A. J., Wisthaler, A., and Jimenez, J. L.: Effects of aging on organic aerosol from open biomass burning smoke in aircraft and laboratory studies, Atmos. Chem. Phys., 11, 12049–12064, https://doi.org/10.5194/acp-11-12049-2011, 2011.
DeCarlo, P. F., Slowik, J. G., Worsnop, D. R., Davidovits, P., and Jimenez, J. L.: Particle morphology and density character-ization by combined mobility and aerodynamic diameter mea-surements. Part 1: Theory, Aerosol Sci. Tech., 38, 1185–1205, https://doi.org/10.1080/027868290903907, 2004.
DeCarlo, P. F., Kimmel, J. R., Trimborn, A., Northway, M. J., Jayne, J. T., Aiken, A. C., Gonin, M., Fuhrer, K., Horvath, T., Docherty, K. S., Worsnop, D. R., and Jimenez, J. L.: Field-deployable, high-resolution, time-of-flight aerosol mass spectrometer, Anal. Chem., 78, 8281–8289, https://doi.org/10.1021/ac061249n, 2006.
Deng, W., Liu, T., Zhang, Y., Situ, S., Hu, Q., He, Q., Zhang, Z., Lü, S., Bi, X., Wang, X., Boreave, A., George, C., Ding, X., and Wang, X.: Secondary organic aerosol formation from photo-oxidation of toluene with NOx and SO2: Chamber simulation with purified air versus ur-ban ambient air as matrix, Atmos. Environ., 150, 67–76, https://doi.org/10.1016/j.atmosenv.2016.11.047, 2017.
Dhammapala, R., Claiborn, C., Jimenez, J., Corkill, J., Gul-lett, B., Simpson, C., and Paulsen, M.: Emission factors of PAHs, methoxyphenols, levoglucosan, elemental carbon and organic carbon from simulated wheat and Kentucky bluegrass stubble burns, Atmos. Environ., 41, 2660–2669, https://doi.org/10.1016/j.atmosenv.2006.11.023, 2007.
Ding, X., He, Q.-F., Shen, R.-Q., Yu, Q.-Q., Zhang, Y.-Q., Xin, J.-Y., Wen, T.-X., and Wang, X.-M.: Spatial and seasonal varia-tions of isoprene secondary organic aerosol in China: Significant impact of biomass burning during winter, Sci. Rep., 6, 20411, https://doi.org/10.1038/srep20411, 2016a.
Ding, X., Zhang, Y.-Q., He, Q.-F., Yu, Q.-Q., Shen, R.-Q., Zhang, Y., Zhang, Z., Lyu, S.-J., Hu, Q.-H., Wang, Y.-S., Li, L.-F., Song, W., and Wang, X.-M.: Spatial and sea-sonal variations of secondary organic aerosol from terpenoids over China, J. Geophys. Res.-Atmos., 121, 14661–14678, https://doi.org/10.1002/2016JD025467, 2016b.
Ding, X., Zhang, Y.-Q., He, Q.-F., Yu, Q.-Q., Wang, J.-Q., Shen, R.-Q., Song, W., Wang, Y.-S., and Wang, X.-M.: Significant in-crease of aromatics-derived secondary organic aerosol during fall to winter in China, Environ. Sci. Technol., 51, 7432–7441, https://doi.org/10.1021/acs.est.6b06408, 2017.
Du, Q., Zhang, C., Mu, Y., Cheng, Y., Zhang, Y., Liu, C., Song, M., Tian, D., Liu, P., Liu, J., Xue, C., and Ye, C.: An im-portant missing source of atmospheric carbonyl sulfide: Do-mestic coal combustion, Geophys. Res. Lett., 43, 8720–8727, https://doi.org/10.1002/2016gl070075, 2016.
Duncan, B. N., Bey, I., Chin, M., Mickley, L. J., Fairlie, T. D., Mar-tin, R. V., and Matsueda, H.: Indonesian wildfires of 1997: Im-pact on tropospheric chemistry, J. Geophys. Res.-Atmos., 108, 4458, https://doi.org/10.1029/2002jd003195, 2003.
Ervens, B., Turpin, B. J., and Weber, R. J.: Secondary organic aerosol formation in cloud droplets and aqueous particles (aq-SOA): a review of laboratory, field and model studies, Atmos. Chem. Phys., 11, 11069–11102, https://doi.org/10.5194/acp-11-11069-2011, 2011.
FAO (Food and Agriculture Organization of the United Nation): Emissions of methane and nitrous oxide from the on-site com-bustion of crop residues, available at: http://faostat3.fao.org/ browse/G1/GB/E, last access: 6 April 2017.
Ge, S., Xu, Y., and Jia, L.: Secondary organic aerosol formation from ethyne in the presence of NaCl in a smog chamber, Environ. Chem., 13, 699–710, https://doi.org/10.1071/en15155, 2016. Ge, S., Xu, Y., and Jia, L.: Secondary organic aerosol formation
from propylene irradiations in a chamber study, Atmos. Environ., 157, 146–155, https://doi.org/10.1016/j.atmosenv.2017.03.019, 2017.
Giordano, M. R., Short, D. Z., Hosseini, S., Lichtenberg, W., and Asa-Awuku, A. A.: Changes in droplet surface tension affect the observed hygroscopicity of photochemically aged biomass burning aerosol, Environ. Sci. Technol., 47, 10980– 10986, https://doi.org/10.1021/es401867j, 2013.
Gómez Alvarez, E., Borras, E., Viidanoja, J., and Hjorth, J.: Unsatu-rated dicarbonyl products from the OH-initiated photo-oxidation of furan, 2-methylfuran and 3-methylfuran, Atmos. Environ., 43, 1603–1612, https://doi.org/10.1016/j.atmosenv.2008.12.019, 2009.
Grieshop, A. P., Donahue, N. M., and Robinson, A. L.: Laboratory investigation of photochemical oxidation of organic aerosol from wood fires 2: analysis of aerosol mass spectrometer data, Atmos. Chem. Phys., 9, 2227–2240, https://doi.org/10.5194/acp-9-2227-2009, 2009a.
Grieshop, A. P., Logue, J. M., Donahue, N. M., and Robinson, A. L.: Laboratory investigation of photochemical oxidation of or-ganic aerosol from wood fires 1: measurement and simulation of organic aerosol evolution, Atmos. Chem. Phys., 9, 1263–1277, https://doi.org/10.5194/acp-9-1263-2009, 2009b.
Hall, D., Wu, C. Y., Hsu, Y. M., Stormer, J., Engling, G., Capeto, K., Wang, J., Brown, S., Li, H. W., and Yu, K. M.: PAHs, carbonyls, VOCs and PM2.5 emission factors for pre-harvest burning of Florida sugarcane, Atmos. Environ., 55, 164–172, https://doi.org/10.1016/j.atmosenv.2012.03.034, 2012.
Hatch, L. E., Yokelson, R. J., Stockwell, C. E., Veres, P. R., Simp-son, I. J., Blake, D. R., Orlando, J. J., and Barsanti, K. C.: Multi-instrument comparison and compilation of non-methane organic gas emissions from biomass burning and implications
for smoke-derived secondary organic aerosol precursors, At-mos. Chem. Phys., 17, 1471–1489, https://doi.org/10.5194/acp-17-1471-2017, 2017.
Hayes, P. L., Ortega, A. M., Cubison, M. J., Froyd, K. D., Zhao, Y., Cliff, S. S., Hu, W. W., Toohey, D. W., Flynn, J. H., Lefer, B. L., Grossberg, N., Alvarez, S., Rappenglueck, B., Taylor, J. W., Allan, J. D., Holloway, J. S., Gilman, J. B., Kuster, W. C., De Gouw, J. A., Massoli, P., Zhang, X., Liu, J., Weber, R. J., Corrigan, A. L., Russell, L. M., Isaacman, G., Worton, D. R., Kreisberg, N. M., Goldstein, A. H., Thalman, R., Waxman, E. M., Volkamer, R., Lin, Y. H., Surratt, J. D., Kleindienst, T. E., Of-fenberg, J. H., Dusanter, S., Griffith, S., Stevens, P. S., Brioude, J., Angevine, W. M., and Jimenez, J. L.: Organic aerosol com-position and sources in Pasadena, California, during the 2010 CalNex campaign, J. Geophys. Res.-Atmos., 118, 9233–9257, https://doi.org/10.1002/jgrd.50530, 2013.
Heald, C. L., Kroll, J. H., Jimenez, J. L., Docherty, K. S., DeCarlo, P. F., Aiken, A. C., Chen, Q., Martin, S. T., Farmer, D. K., and Artaxo, P.: A simplified description of the evolution of organic aerosol composition in the atmosphere, Geophys. Res. Lett., 37, L08803, https://doi.org/10.1029/2010gl042737, 2010.
Hennigan, C. J., Miracolo, M. A., Engelhart, G. J., May, A. A., Presto, A. A., Lee, T., Sullivan, A. P., McMeeking, G. R., Coe, H., Wold, C. E., Hao, W.-M., Gilman, J. B., Kuster, W. C., de Gouw, J., Schichtel, B. A., Collett Jr., J. L., Kreidenweis, S. M., and Robinson, A. L.: Chemical and physical transfor-mations of organic aerosol from the photo-oxidation of open biomass burning emissions in an environmental chamber, At-mos. Chem. Phys., 11, 7669–7686, https://doi.org/10.5194/acp-11-7669-2011, 2011.
Henry, K. M., Lohaus, T., and Donahue, N. M.: Organic aerosol yields from α-pinene oxidation: bridging the gap between first-generation yields and aging chemistry, Environ. Sci. Technol., 46, 12347–12354, https://doi.org/10.1021/es302060y, 2012. Heringa, M. F., DeCarlo, P. F., Chirico, R., Tritscher, T., Dommen,
J., Weingartner, E., Richter, R., Wehrle, G., Prévôt, A. S. H., and Baltensperger, U.: Investigations of primary and secondary particulate matter of different wood combustion appliances with a high-resolution time-of-flight aerosol mass spectrometer, At-mos. Chem. Phys., 11, 5945–5957, https://doi.org/10.5194/acp-11-5945-2011, 2011.
Hildebrandt, L., Donahue, N. M., and Pandis, S. N.: High formation of secondary organic aerosol from the photo-oxidation of toluene, Atmos. Chem. Phys., 9, 2973–2986, https://doi.org/10.5194/acp-9-2973-2009, 2009.
Hossain, A., Park, S., Kim, J. S., and Park, K.: Volatil-ity and mixing states of ultrafine particles from biomass burning, J. Hazard. Mater., 205, 189–197, https://doi.org/10.1016/j.jhazmat.2011.12.061, 2012.
Hosseini, S., Urbanski, S. P., Dixit, P., Qi, L., Burling, I. R., Yokelson, R. J., Johnson, T. J., Shrivastava, M., Jung, H. S., Weise, D. R., Miller, J. W., and Cocker, D. R.: Laboratory characterization of PM emissions from combustion of wild-land biomass fuels, J. Geophys. Res.-Atmos., 118, 9914–9929, https://doi.org/10.1002/jgrd.50481, 2013.
Huang, R. J., Zhang, Y. L., Bozzetti, C., Ho, K. F., Cao, J. J., Han, Y. M., Daellenbach, K. R., Slowik, J. G., Platt, S. M., Canonaco, F., Zotter, P., Wolf, R., Pieber, S. M., Bruns, E. A., Crippa, M., Ciarelli, G., Piazzalunga, A., Schwikowski,