THE EFFECT OF AGING ON THE MECHANICAL BEHAVIOR OF Fe-Ni-C MARTENSITES
by
Susan E. Hartfield
B.S. Metallurgical Engineering and Material Science Carnegie-Mellon University
(1985)
Submitted in Partial Fulfillment of the Requirements for the Degree of
MASTER OF SCIENCE at the
MASSACHUSETTS INSTITUTE OF TECHNOLOGY February, 1988
©
Massachusetts Institute of TechnologySignature of Author _
-Department of Materials Science anA Engineering January 15, 1988
Certified by , r
Professor Morris Cohen Thesis Supervisor
Certified by
Dr. Gregory B. Olson Thesis Supervisor
Accepted by
Professor John B. Vander Sande Chairman, Departmen al Committee on Graduate Students
.Archives
OF nmiw .OBY
THE EFFECT OF AGING ON THE MECHANICAL BEHAVIOR OF Fe-Ni-C MARTENSITES
by
Susan E. Hartfield
Submitted to the Department of Materials Science and Engineering on January 15, 1988 in partial
fulfillment of the requirements for the Degree of Master of Science in Metallurgy
ABSTRACT
The mechanical behavior of two Fe-Ni-C martensites, having nominal compositions of Fe-15Ni-lC and Fe-25Ni-0.4C, was examined as a function of aging time and temperature. These alloys have subambient Ms temperatures and so autotempering can be avoided, thus permitting the mechanical behavior of virgin martensites to be investigated. Microhardness was measured as a function of aging time and temperature, and fracture toughness was measured as a function of time at room temperature. Atom probe/field-ion microscopy
(AP/FIM) was carried out on the Fe-25Ni-0.4C alloy.
Three distinct stages of aging were observed. The zeroth stage (AO) corresponds to a hardness peak as well as a resistivity peak at short aging times. The first stage (Al) comprises a subsequent increase in hardness to a second peak which can be attributed to spinodal decomposition of the martensite. The Fe-15Ni-lC martensite is known to undergo spinodal decomposition during aging at room temperature, and the Al stage of aging coincides with increasing amplitude of the carbon modulations at relatively constant modulation wavelength. The second stage (A2) is identified with the subsequent decrease in hardness from the second peak. This softening can be attributed to a coarsening of the spinodal structure, as evidenced by an increase in the carbon modulation wavelength. Information concerning the modulation amplitude and wavelength for the Fe-15Ni-lC steel was taken from AP/FIM data in the literature.
Atom probe/field-ion microscopy was carried out concurrently on the Fe-25Ni-0.4C alloy to verify the occurrence of spinodal decomposition of the martensite in this alloy. A modulated structure was seen to evolve during aging at room temperature. Striations were observed by field-ion microscopy corresponding to the modulations in carbon composition. The atom probe showed that the maximum carbon modulation amplitude reached during the spinodal decomposition was the same as that for the Fe-15Ni-lC, roughly 10 atomic percent.
The effect of temperature on the aging kinetics was studied over the range of -3 to 60 C. Raising the aging temperature increases the kinetics of the spinodal decomposition. The AO stage of aging is accompanied by a resistivity peak at all three temperatures. The effect of carbon composition was examined by comparing the C and 0.4C alloys. Faster aging kinetics were observed in the 0.4C alloy.
Three-point bend plane-strain fracture toughness was measured as a function of aging time at room temperature, and found not to vary. This was due to premature intergranular cracking. Spontaneous microcracking of some martensitic plates was observed to take place with time. Also, during the Al stage of aging, many cracks formed at the microhardness indentations. These cracks were counted as a function of time, and were found to occur with highest freqency during the Al stage of aging.
Thus, three distinct stages of aging were observed in Fe-Ni-C martensites. Embrittlement occurred in the spinodal hardening region. It appears that virgin martensite is not inherently brittle, but rather becomes embrittled as it hardens during aging.
Thesis Supervisors: Morris Cohen
Institute Professor, Emeritus Gregory B. Olson
Table of Contents
Abstract ... Table of Contents ... List of Figures ... List of Tables ... Acknowledgements .... Chapter 1 Introduction ... 9 Chapter 2 Literature Review ...2.1 Aging of Carbon Containing 2.2 Strengthening During Aging 2.3 Spinodal Strengthening
... 10 Ferrous MartensiteslO ... 15 ... 18 2.4 Fracture Toughness of Ferrous Martensites ... Chapter 3 Purpose of Research ... Chapter 4 Experimental Procedures ... 4.1 Material Selection ... 4.2 Heat Treatment... 4.3 Metallographic Sample Preparation... 4.4 Aging Procedure ... 4.5 Microhardness Measurements ... 4.6 Fracture Toughness Measurements ... 4.7 Atom Probe/Field-Ion Microscopy ... Chapter 5 Experimental Results and Discussion ... 5.1 Microstructure ... 5.2 Microhardness .
5.3 Fracture Toughness .
5.4 Atom Probe/Field-Ion Microscopy . Chapter 6 Summary/Conclusions .
Chapter 7 Suggestions for future work .
References ... 20 22 23 23 25 26 27 27 33 35 37 37 40 66 68 77 79 80 2 4 5 7 8
...
...
...
...
...
...
...
...
. . . .List of Figures
Figure Page
2.1 Schematic of variation of carbon modulation 13 amplitude with time (a), and variation of
carbon modulation wavelength with time ().
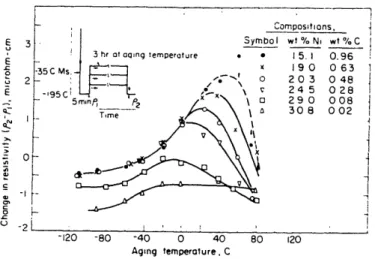
2.2 Change in electrical resistivity as a function 16 of aging temperature for Fe-Ni-C alloys.
(Winchell and Cohen [22]).
4.1 Photomicrograph of conventionally processed 28 Fe-15Ni-0.9C, aged at room temperature for
5000 hours, showing the microhardness indentation within a martensitic plate.
4.2 Variation of microhardness with load, using 30 a calibration block as the test sample.
4.3 Variation of microhardness with load, using 31 a RSP Fe-15Ni-1C sample for measurement.
4.4 Difference between light load and Vickers 32 microhardness taken on the same specimens.
(Marder, [24]).
4.5 Three-point bend fracture toughness specimen. 34 5.1 Photomicrograph of conventionally processed 38
Fe-25Ni-0.4C, aged at room temperature for 2200 hours.
5.2 Photomicrograph of RSP Fe-13Ni-lC, aged at 39 room temperature for 7500 hours.
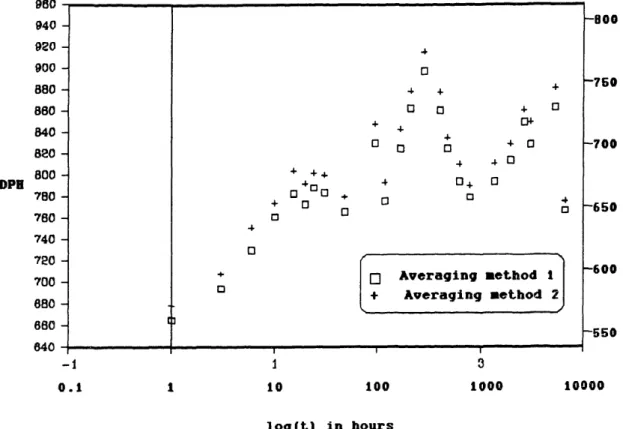
5.3 Plot of microhardness vs.time for RSP Fe-15Ni-lC, 41 aged at room temperature, comparing averaging
method 1 with averaging method 2.
5.4 Plot of resistivity vs. time for conventionally 43 processed Fe-15Ni-0.9C, at various temperatures
(Taylor [9]).
5.5 Plot of critical resolved shear stress vs. time 47 based on Cahn's model [261].
5.6 Plot of critical resolved shear stress vs. time 48 based on the model of Kato, et al. [27].
5.7 Plot of critical resolved shear stress vs. time 49 based on the model of Kato [28].
5.8 Plot of critical resolved shear stress vs. time 50 based on Ardell's model [29].
5.9 Summary of resistivity, amplitude, wavelength, 52 and microhardness vs. time.
5.10 Plot of microhardness vs. time for RSP 54 Fe-13Ni-1C, aged at 60 C.
5.11 Plot of microhardness vs. time for RSP 55 Fe-13Ni-1C, aged at -3 C.
5.12 Plot of microhardness vs. ime for RSP 57 Fe-25Ni-0.4C, aged at room temperature.
5.13 Plot of microhardness vs. time for Fe-1.8C-1.8Mn, 59 aged at room temperature.
5.14 Plot of microhardness as a function of carbon 61 content. (Marder, [24])
5.15 Plot of microhardness vs. time for Fe-C, 62 aged at room temperature. (Marder [24])
5.16 Plot of microhardness vs. time for Fe-C, 63 aged at room temperature. (Marder [24])
5.17 Plot of microhardness vs. time comparing 64 conventionally processed Fe-15Ni-0.9C with RSP
Fe-13Ni-lC, aged at room temperature.
5.18 Plot of microhardness vs. time comparing 65 conventionally processed Fe-25Ni-0.4C with RSP
Fe-25Ni-0.4C, aged at room temperature.
5.19 Example of intergranular cracking during 67 3-point bend KIC fracture toughness testing
of conventionally processed Fe-15Ni-0.9C steel.
5.20 Plot of percent cracked microhardness 69 indentations vs. time for conventionally
processed Fe-15Ni-0.9C.
5.21 Example of spontaneous cracking of martensitic 70 plates in an aged, conventionally processed
Fe-15Ni-0.9C steel.
5.22 Field-ion microscopy of Fe-25Ni-0.4C, 71 as quenched (a), and aged at room temperature
5.23 Field-ion microscopy of Fe-25Ni-0.4C, 72 aged at room temperature for 550 hours (a),
and for 1000 hours (b).
5.24 Atom-probe composition profiles for Fe-25Ni-0.4C, 74 as quenched (a), aged at room temperature for
3 hours (b), and for 144 hours (c).
5.25 Atom-probe auto-correlation analyses for 75 Fe-25Ni-0.4C, as quenched (a), aged at room
temperature for 3 hours (b), and for 144 hours (c). 5.26 Atom-probe sample distributions for Fe-25Ni-0.4C, 76
as quenched (a), aged at room temperature for 3 hours (b), and for 144 hours (c).
List of Tables
Table Page
Acknowledgements
There are many people that I would like to thank for their encouragement and support during the completion of this thesis. These include:
Thesis advisors, Professor Morris Cohen and Dr. Gregory B. Olson, for their helpful suggestions and gifted, brilliant
insights;
Many other people at MIT such as C.C. Young, my personal fracture toughness consultant, who has helped me in more ways than I can count; Mark Hetherington, for his endless patience in showing me how to use the atom probe, and more importantly in how to interpret the results; and Yin Lin Xie for providing lots of friendly assistance;
Many people at GM, for personal as well as financial support, especially Anil Sachdev, for providing material and guidance; and Mark Hall, for helpful ideas for polishing at liquid nitrogen temperatures;
My parents and sister for always being there to boost my confidence when I most needed it;
My office-mates Susan, Tom, and Katy for helping me keep my sanity, as well as many other good friends that I have made here at MIT, who always took time out of their busy schedules for coffee and ice cream breaks;
And most of all I would like to thank Chris for having patience with me through these two incredibly long years of
Chapter 1
Introduction
The hardening of steel has been of considerable interest for a long time. The ability of steel to become significantly harder during quenching is a reason that it has been such an important structural material throughout history. Yet, it seems that we are still on the learning curve for understanding this hardening phenomenon.
When steel is quenched from the austenitic range to form martensite, the strength is greatly increased, but the toughness is concurrently decreased. This decrease in toughness is the reason that steel is commonly tempered before use as a structural material. During tempering, the structure changes to a more stable one which has higher toughness while retaining much of the strength.
Aging refers to the structural changes that occur in the martensite prior to tempering, usually at lower temperatures than for tempering. There is no precipitation of carbides during aging. However, the martensite does undergo structural changes that lead to an increase in strength and a decrease in ductility as aging progresses. It is believed that a significant portion of the strength and brittleness of martensite is a result of the carbon redistribution that occurs during aging. In fact, there is considerable evidence [1, 2] that virgin martensite is not inherently brittle. This thesis will deal with the changes in mechanical properties that occur during aging.
Chapter 2
Literature Review
There are several extensive literature reviews of ferrous martensites, covering many different aspects. The reader is referred to a book by Nishiyama [3] and an excellent paper by Cohen and Wayman [4] for more information. Since the main thrust of this thesis is aging of Fe-Ni-C martensites, and the changes in mechanical behavior that occur during aging, this literature review will be limited to four areas: (1) aging of ferrous martensites, (2) strengthening during aging, (3) spinodal strengthening, and (4) fracture toughness of ferrous
2. 1 Aging of Carbon-Containing Ferrous Martensites
Aging refers to the structural changes that occur after the formation of martensite before any distinct carbide phases are formed [5,6]. This is sometimes referred to as the "zeroth" stage of tempering. The most notable structural change that occurs during aging is a redistribution of carbon atoms.
In the austenitic phase, before martensite is formed, there is a repulsive carbon-carbon interaction that disperses the carbon atoms into an quasi-ordered solid solution with the carbon atoms as far from one another as possible. This was shown by Choo and Kaplow [7] with Mossbauer spectroscopy. The carbon atoms prefer the octahedral interstitial sites in the face-centered cubic austenite. The "ordered" distribution of carbon atoms is inherited by the martensite as it forms from the austenite. Carbon-containing virgin martensites are
body-centered tetragonal, and the carbon atoms preferentially occupy octahedral sites along the z-axis (Oz sites).
During aging of Fe-Ni-C martensites, there is a redistribution of carbon atoms, with two competing processes in this redistribution: (1) short-range diffusion to lattice defects, such as dislocations [8], and (2) formation of a fine modulated or tweed structure, consisting of carbon-rich and carbon-poor bands [9]. As Mittenmeijer and Van Doorn point out [10], papers dealing with the first process ususally ignore the second, and those discussing the second process usually ignore the first.
Prioul and Hyspecka [11] looked at the interactions between carbon atoms and dislocations in Fe-Ni-C martensites and found that for aging temperatures above 170 K, short range diffusion of carbon atoms occurs, and there is an "irreversible Snoek pinning of dislocations" by carbon atoms. At longer aging times, long-range diffusion occurs, resulting
in Cottrell pinning of dislocations.
However, at the same time, the modulated or tweed structure is forming. Evidence of carbon clustering has been found by resistivity measurements [13], Mossbauer spectroscopy [7,14], dilatometry [14], transmission electron microscopy (TEM) [9,15], and atom probe field-ion microscopy (AP/FIM) [9,15,16]. During this decomposition into a modulated structure, the carbon atoms remain in the Oz sites [17,18].
Using TEM, Taylor found that the modulated structure was produced by a spinodal decomposition [9]. This was supported by AP/FIM work by Chang, et al. [15] and Chang, Smith, and Olson [16]. AP/FIM provides direct compositional analysis and shows that upon aging at room temperature, carbon-rich and carbon-poor bands form. This is a spinodal decomposition since the amplitude and wavelength of the modulation in carbon
composition increase with time, with the amplitude eventually saturating, after which coarsening occurs. The resulting high- and low- carbon bands are coherent [9]. Taylor further suggested that the decomposition is a "conditional" spinodal decomposition due to the Zener-ordered nature of the virgin martensite [9]. A conditional spinodal decomposition occurs when ordering leads to a compositional instability.
Olson and Cohen [5] have divided aging into two stages. The first stage of aging involves the clustering of carbon atoms. They remain in the z-octahedral sites during this clustering. The second stage of aging involves the development of a fine modulated tweed structure. According to Prioul and Hyspecka [11], the first stage of aging is when the Snoek pinning of dislocations occurs (requiring only local rearrangement of carbon atoms), while the second stage of aging is when Cottrell pinning occurs (requiring long-range diffusion of carbon atoms). In light of more recent work by Taylor [9], the two stages of aging should be redefined as (1) spinodal decomposition and (2) coarsening of the spinodal structure, with segregation of some of the carbon atoms to dislocations occurring simultaneously.
Chang, Smith, and Olson [16] further refine the idea of two-stage aging. For their alloy of Fe-15wt%Ni-lwt%C, the first stage of aging occurs at times less than 200 hours at room temperature. Here the amplitude of the carbon modulations increases steadily with time, while the wavelength increases very slowly. During the second stage of aging, at times greater than 200 hours, the compositional amplitude saturates, reaching a composition of Fe8C in the high-carbon
bands, and the wavelength then increases steadily with time. This second stage could be considered a coarsening of the spinodal structure. A schematic representation of this type of behavior is seen in Figure 2.1.
time
2.1 (a)
2.1 (b)
time
Figure 2.1 Schematic of variation of carbon modulation amplitude with time (a), and variation of carbon modulation wavelength with time (b). The dashed line divides the first stage of
aging from the second stage of aging.
-13-I I I I I I I I
All the AP/FIM results [9,15,16] showed that the carbon-rich bands contained approximately 11 a/o C, corresponding to Fe8C stoichiometry. This is in disagreement with a previous Mossbauer spectroscopy interpretation which indicated a Fe4C stoichiometry [7,141. Taylor [9] and Chang, et al. [15] propose the formation of a coherent phase of Fe1 6C2, analogous
to the Fe1 6N2 phase found in the low temperature aging of Fe-N martensites. Chang, et al. [15] suggest that the Fe1 6C2 phase may not be fully ordered which would explain why the Mossbauer results point to Fe4C stoichiometry instead. They also
present a hypothetical spinodal region of the phase diagram [15]. This diagram is based on the Fe8C stoichiometry found in their own work, the work of Miller, et al. [19] and that of Choo and Kaplow [7].
All of the results mentioned so far involved an alloy of nominal composition Fe-15wt%Ni-lwt%C. Miller, et al. [19] performed an AP/FIM study on an Fe-23wt%Ni-0.42wt%C alloy. They found a maximum carbon concentration in the carbon-rich bands of 10 a/o, agreeing closely with the above findings for Fe-15Ni-lC.
Using AP/FIM, Chang, Miller, and Olson [15] found that, as the aging temperature is raised above room temperature, the carbon-rich region concentration increases above 11 a/o. Further decomposition is occurring and eventually epsilon carbides precipitate out. It was observed that there is a range of temperatures and times where the Fe8C regions coexist (unstably) with the epsilon carbides.
Taylor found that during later tempering, carbide nucleation occurred heterogeneously at the interface between carbon-rich and carbon-poor bands [9]. This is because the net transformation strain energy is lower if nucleation occurs there instead of in the adjacent regions.
It is interesting to note that similar results were found for aging Fe-N martensites. Kaplow, Ron, and DeCristofaro compared Fe-C and Fe-N martensite aging using Mossbauer spectroscopy [20]. As in the previously mentioned Mossbauer spectroscopy, they found that the carbon clustering resulted in the formation of Fe4C. However, they found that nitrogen clustering led to the formation of ordered Fe1 6N2. Garwood and Thomas suggest that the formation of Fe1 6N2 is a homogeneous reaction displaying spinodal characteristics [21]. This is analagous to Taylor's suggestion that Fe1 6C2 forms via
spinodal decomposition [9].
2.2 Strengthening During Aging
It has been known for some time that the structural changes during aging lead to changes in mechanical properties. Most of the emphasis has been on the variation in mechanical properties with aging temperature, keeping the aging time constant [22,23]. There has also been some isothermal aging studies of the variation in mechanical properties with aging time [24, 25].
Winchell and Cohen [22] looked at several different iron-nickel-carbon alloys, all aged for 3 hours at various temperatures (Figure 2.2). They found an increase in hardness, measured at the liquid nitrogen temperature, with aging temperature above -60 C. Peak hardness occurred between 40 C and 80 C. Resistivity measurements indicated that this increase in hardness correlated with the formation of carbon clusters. Below -60 C, only solid solution strengthening applies since there is not enough carbon diffusion for carbon clustering to occur.
Eldis and Cohen [23] measured the compressive strength at liquid nitrogen temperatures for Fe-Ni-C and Fe-Ni-Mo-C alloys. They found that significant strengthening occurs during aging between 0 C - 100 C (samples all aged for 1
! 3 hr t oqng temperature -EfM Compositions, ! Symbol wt % N wt % C * * 15.1 0.96 ! x 190 063 203 048 245 028 29 0 008 30 8 002 1 1 1 i I _ .i I I -120 -80 -40 0 40 80 120 Aging temperature, C
Figure 2.2 Change in electrical resistivity at -195 C as a function of aging temperature for Fe-Ni-C
alloys. (Winchel].l and Cohen [22] )
-16-3 2 -195C E E .-12 _o u E Q:' 3 LI S "I CD c r 0 -I I I I I -l
hour). They attributed this increase in strength to carbon atom clustering. They also found that maximum strength is obtained after aging at 100 C (for 1 hour). This is prior to any detectable carbide precipitation.
The above mentioned experiments involved measuring the hardness and strength of bulk specimens, i.e. retained austenite had to be corrected for. Marder [24] investigated the variation in microhardness with aging time at room temperature for Fe-C martensites, ranging in composition from 0.2 w/o C to 1.39 w/o C. He used a light load hardness indentation so that the indentation was completely inside the martensitic plates. Thus, he did not have to correct for retained austenite. He found an increase in hardness during the first 5 hours, followed by a decrease for all compositions tested. However, since Marder used Fe-C steels, it is expected that auto-tempering occurred during martensite formation, and thus the results are difficult to interpret. He attributed the increase in strength to carbon clustering. Gregoire, et al. [25] also studied the variation in microhardness with aging time by using a light load and putting the indentation entirely within the larger martensitic plates. They saw a decrease in microhardness with time, (not starting with virgin martensite), and attributed this decrease to the second stage of aging. They also observed appreciable variation in microhardness readings and suggested that the evolution of clustering in the martensitic plates may not be homogeneous.
The basic result of all of the research mentioned here is that there is an increase in strength due to the clustering of carbon atoms. This has been shown to be true in the Fe-C, Fe-Ni-C, and Fe-Ni-Mo-C systems.
2.3 Spinodal Strengthening
Several spinodal hardening models exist [26,27,28,29]. In the light of recent work showing that a modulated strLture forms via spinodal decomposition during aging, it is appropriate to test whether any of these models can be applied to the Fe-Ni-C system. This system is different from most of those that are modelled in that the spinodal decomposition involves carbon, which is an interstitial atom. Existing spinodal strengthening models are for substitutional spinodal decomposition. A brief review will be given here.
Cahn's theory of spinodal hardening [26] involves calculations of the force on a single dislocation (pure edge or pure screw) due to compositional gradients and internal stresses in a b.c.c. spinodal structure. He assumes a sinusoidal concentration profile and that the dislocations are flexible. He correlates the wavelength and amplitude of the spinodal structure to particle spacing and particle hardness in precipitation hardening theories. His results are that:
TCRSS = KA2 (2.1)
where A = amplitude of the composition fluctuation K = a constant, different for edge and screw
dislocations
Kato, Mori, and Schwartz criticize Cahn's theory for predicting yield stresses that are smaller than experimental observations [27]. Their model also explains spinodal hardening in terms of the internal coherency stress field resulting from compositional modulations. Like Cahn, they assume a sinusoidal concentration profile and flexible dislocations. However, they calculate the force on single dislocations of mixed character in an f.c.c. spinodal structure rather than b.c.c. They contend that using mixed dislocations gives yield stresses of the right order of
magnitude to correlate with experimental results. The result of their model is:
TCRSS = KA (2.2)
where A = amplitude of the compositonal fluctuation K = a constant
Note that the wavelength does not contribute to the strength in either of these models.
Kato [28] later derived a spinodal strengthening model for b.c.c. alloys. He used the same assumptions as in his work with Mori and Schwartz [27], but applied them to a b.c.c.
alloy. His result is:
TCRSS = K1A + K2/w (2.3) where A = amplitude of composition fluctuation
w = wavelength of composition fluctuation K1, K2 = constants
The first term is due to the misfit effect and the second term is due to the modulus effect. This would suggest an increase in strength to the left of the dashed line in Figure 2.1 where the amplitude is increasing and the wavelength is constant, and a decrease in strength to the right where the wavelength is increasing and the amplitude is constant.
Along with providing a good review of existing spinodal strengthening models, Ardell presents a new theory of hardening by spinodal decomposition [29]. He criticizes the Cahn model [26] and the Kato, Mori, and Schwartz model [27] because they both calculate the TCRSS of an ideal microstructure. Ardell's model is based on the idea that although the spinodal microstructure is modulated, it is not perfectly periodic. Based on this idea, spinodal strengthening can be correlated to hardening by strong diffuse obstacles. His equation is:
TCRSS = K(A)5/3(w)2/3 (2.4) where A = amplitude of -the compositional fluctuation
w = wavelength of compositional fluctuation K = a constant
This model predicts that the strength will increase with both the amplitude and the wavelength of the compositional modulation.
Owen and Grujicic [30] discuss existing spinodal strengthening models with respect to Fe-Ni-C martensites. They contend that existing spinodal strengthening models do not apply to the Fe-Ni-C system because they depend on a simple sine function to represent the compositonal variations. In aged Fe-Ni-C martensites, the concentration modulations are asymmetric about the original concentration. They conclude that the flow stress of Fe-Ni-C martensite is strongly dependent on the amplitude of the concentration modulations but only weakly dependent on the wavelength. However, they do
not provide a relationship for this dependence.
2.4 Fracture Toughness of Ferrous Martensites
The fracture toughness of martensitic steels is a very important mechanical property. It is well known that untempered martensite is quite brittle. In order to be used for structural purposes, it must be tempered to achieve some ductility.
Vilo and Pietikainen [1] got some very interesting results looking at the number of microcracks in virgin and aged Fe-Ni-C martensites. They found that there were no microcracks in the virgin martensite. Microcracks evolved spontaneously during aging. They suggest that this is the result of a decrease in ductility during aging and the microstresses that result from aging. This agrees with some
earlier work by Pietikainen [2] where he found that virgin martensite is ductile.
Looking at the Vilo and Pietkanen work, Taylor [9] suggests that the brittleness of untempered (but aged) martensite may be the result of spinodal decomposition since severe internal stresses result from the coherent mixture of the high- and low- carbon bands. The higher-carbon regions are body-centered tetragonal, while the lower-carbon regions exhibit negative tetragonality as observed by Chen and Winchell [181. They contend that there is severe elastic distortion due to coherency strains in these carbon-poor areas. Cohen [31] suggests that the elastic coherency strains may be as high as 17 percent. The formation of the modulated structure and the coherency strains that result could be the reason for the decrease in ductility as aging progresses.
Chapter 3
Purpose of Research
It is obvious from the prevous chapter that there has been extensive research to understand the aging of carbon-containing ferrous martensites and the changes in mechanical properties that occur during aging. However, the idea that a modulated structure forms spinodally during aging is relatively new (Taylor, [9]). The main purpose of the present research is to see how this new insight into martensite decomposition affects our understanding of the changes in mechanical behavior that accompany it.
It is well documented that martensite gets stronger and less ductile during aging as discussed in the literature review. Now that it is known that the martensite undergoes a spinodal decomposition during aging, it is desired to apply a spinodal strengthening model to its aging behavior. Also, keeping in mind the work of Vilo and Pietikainen [1] who found that virgin martensite is not inherently brittle, it is suspected that the loss of ductility that occurs during aging is a result of the tremendous internal coherency strains that result from the formation of the spinodal modulated structure. An attempt will be made to prove this.
In this study, mechanical properties are measured as a function of aging time, specifically microhardness and fracture toughness. In order to correlate these results with Taylor's data, the exact same materials are used. Also, since these materials have Ms temperatures of -40 C, they allow measurment of mechanical properties of virgin martensite. Existing spinodal strengthening models are analyzed with respect to these data.
Chapter 4
Experimental Procedures
41 Material Selection
The literature is full of experiments to study the aging and tempering behavior of ferrous martensites. However, many different alloys have been used and the results are difficult to correlate. It was recognized during an informal tempering seminar held at MIT in the spring of 1980 that there was a need for choosing a "standard alloy" for aging and tempering experiments so that results could be directly correlated. Two compositions were chosen: Fe-15Ni-lC and Fe-25Ni-0.4C (all figures given in weight percent). Both of these alloys have estimated Ms temperatures of -40 C. This temperature is low enough that no carbon redistribution should occur during quenching into the martensitic regime. Thus the martensite can be examined in the virgin state and then aged under controlled conditions.
In the past seven years, considerable data have been generated for these two "standard alloys", including both aging and tempering studies (see Chapter 2). Accordingly, these alloys were also used in the present investigation. The available material had been left over from the work by Taylor [9]. However, there was not enough of it for all of the intended experiments, so alloys of nominallly the same composition were also included.
The materials studied by Taylor [9] were conventionally processed Fe-Ni-C alloys. Climax Molybdenum Company furnished hot-worked bars of 1/2-inch square cross section. The compositions of these steels are listed in Table 4.1. They will be referred to as conventional Fe-15Ni-0.9C and conventional Fe-25Ni-0.4C even though these are not their
exact compositions. (Note that this Fe-15Ni-0.9C alloy is referred to in the literature as Fe-15Ni-1C [9,15,16]. It is the same alloy, i.e. from the same heat.)
In addition to using the material left over from Taylor's work, two other alloys of nominally the same compositions were also studied. However, these alloys were not fabricated using conventional methods. They were extruded billets of rapidly solidified powder. The purpose of using this processing technique is to produce a more homogeneous material. The exact compositions of these materials are listed in Table 4.1. They will be referred to as RSP Fe-13Ni-lC and RSP Fe-25Ni-0.4C even though these are not their exact compositions.
In addition to these two sets of "standard alloys", one other alloy was used. This was the Fe-1.8C-1.8Mn steel studied by Sachdev [32]. Taylor included resistivity measurements of this alloy in his thesis [9]. The composition is listed in Table 4.1 also.
Table 4.1 Alloy Compositions
Alloy Carbon Nickel Manganese
Conv. Fe-15Ni-0.9C 0.88 (5)* 15.0 (4)
Conv. Fe-25Ni-0.4C 0.39 (3) 25.0 (4) RSP Fe-13Ni-1.OC 1.02 (2) 13.4 (2) RSP Fe-25Ni-0.4C 0.43 (2) 24.83 (2)
Conv. Fe-1.8C-1.8Mn 1.8 (1) 1.8 (1)
*The numbers in parentheses represent the number of different chemical analyses averaged to arrive at these values.
4.2 Heat Treatment
The as-received Fe-Ni-C alloys were fully austenitic with an equiaxed grain structure. However, to insure complete homogenization and to remove any residual stresses arising from fabrication, the materials were further heat treated.
Prior to heat treatment, samples were encapsulated in quartz tubes along with tantalum and cast iron chips. The tantalum acts as an oxygen getter; the cast iron raises the carbon potential inside the capsule so that no decarburization occurs. The capsules were then evacuated and back-filled with argon.
Austenization was performed at temperatures between 1050 C and 1100 C for 2 hours. This high austenitizing treatment was selected because it was desired to have a large austenitic grain size (see section 4.5 on Microhardness Measurements). The samples were quenched into room temperature water directly from the furnace, breaking the quartz capsules in the process to achieve fast cooling. Since the M temperature was below room temperature, the specimens were still fully austenitic at this point. Samples were then quenched into liquid nitrogen to form martensite and kept there for 1 hour to accomplish any further isothermal transformation.
The only variation in this heat treatment was for the Fe-1.8C-1.8Mn steel. This steel was heat treated according to the method of Sachdev [32]. Homogenization was at 1150 C for 3 days in a quartz capsule with cast iron and tantalum chips, followed by quenching into room temperature water as above. However, this quenching was not quick enough to prevent the precipitation of cementite and redistribution of the carbon during quenching. Therefore, the samples were reaustenitized and rapidly quenched using a method similar to that of Sherman [12]. Reaustenization was in a vertical furnace with an opening at the bottom. This opening was covered with aluminum
foil and the furnace was filled with argon. The samples were reaustenitized at 1150 C for 0.5 hour and then dropped directly into an iced brine solution below the opening in the bottom of the furnace. Tantalum chips were hung next to the steel samples to getter any oxygen that might be present.
4.3 Metallographic Sample Preparation
Care was taken during metallographic preparation to have the samples stay "very cold" during polishing. Winchell and Cohen found that little carbon redistribution takes place below -60 C when aged for 3 hours [22]. Based on this information, samples were kept below this temperature during polishing so that microhardness readings could be taken at close to zero aging time. The procedure adopted is described below.
First, the sample was mounted in a bakelite mold, 1.25" in diameter, L.5" tall. A hole was drilled in the top, 1" in diameter, down to the top of the specimen. The entire mount was then quenched in liquid nitrogen. When the mount was removed from the liquid nitrogen, the drilled hole was filled with liquid nitrogen and a cap put on. It was assumed that the thermal diffusivity of the sample was high enough that the entire sample could be kept close to liquid nitrogen temperature, in as much as one face of the sample was in contact with the liquid nitrogen. The specimen was then ground and polished automatically with the liquid nitrogen reservoir continually being refilled. After the final polish, the sample was up-quenched to room temperature by running cold water over it. The sample was then etched in 10% nital and brought to the microhardness machine for hardness measurements.
4.4 Aging Procedure
Aging experiments were performed at three temperatures: -3 C, room temperature, and 60 C. For aging at -3 C, the specimens were placed in a jar with a dessicant, and transferred to the freezer of a conventional refrigerator. Samples were removed from the freezer one at a time and up-quenched to room temperature by running cold water over them for microhardness measurements. Each sample was at room temperature for about 10 minutes for each microhardness point.
The specimens to be aged at room temperature were placed in a dessicator and left on the shelf. Samples aged at 60 C were held in a mineral oil bath and maintained at temperature using a Braun Thermomix 1460 unit. Samples were removed from the 60 C mineral oil bath one at a time and quenched to room temperature by running cold water over them for microhardness measurements. Each sample was at room temperature for about 10 minutes for each microhardness point.
4.5 Microhardness Measurements
All the microhardness measurements were made with a LECO DM400 instrument, with a 25 gram load. This very light load was chosen so that the entire indentation would be small enough to fit entirely within the larger martensitic plates. Thus the retained austenite would not have a significant influence on the reading. Also, the inclusions can be completely avoided by this method. This is the reason that the samples were heat treated to obtain a very large austenitic grain size, which translates to a large martensitic plate size. With a load of 25 grams, the entire indentation could fit easily into the larger martensitic plates (see Figure 4.1).
There was some concern as to how accurate a microhardness reading is with such a light load. For this reason, Figure
Figure 4.1 Photomicrograph of conventionally processed Fe-15Ni-0.9C, aged at room temperature for 5000 hours, showing the microhardness
indentation within a martensite plate.
-28-4.2 was generated using a calibration block and Figure 4.3 was generated with the RSP Fe-13Ni-lC material of this study. It is seen that the microhardness measurements made with lighter loads are higher than those made using heavier loads. This is a common observation as indicated in Figure 4.4, from the work of Marder [24]. Also, for the microhardness measurements on the calibration block, the standard deviation was as high as 30 DPH points for the lighter loads, as compared to 5-10 DPH points for the heavier loads.
For the RSP Fe-13Ni-1C material,2 the readings taken completely within the martensitic plates (marked with a cross) were notably harder than those taken at random locations (marked with an open square), with retained austenite being present, as seen in Figure 4.3. So, even though the lighter load measures some 40-50 DPH points higher than it should, it was used to minimize the effect of retained austenite. It is realized that the microhardness readings thus obtained are not absolute; however, they can provide us with general trends in martensitic hardness as a function of aging time.
There was quite a bit of variation in microhardness measured on the same sample at the same aging time, and possible reasons are as follows. First, not all of the martensitic plates are oriented exactly perpendicular to the plane of polish. It is reasonable to expect that a plate oriented at some angle to the plane of polish, with a retained austenite pocket behind it, will read softer than a plate oriented exactly perpendicular to the plane of polish, with more of the same martensite being directly behind it. To minimize this effect of orientation, plates were chosen for microhardness measurements that were symmetric about the midrib. It is expected that these plates were approximately perpendicular to the plane of polish. Also, the narrowest possible plates were chosen, assuming that they were the most
900 80 880 840 820 800 -DPH 780 760 740 720 700 880 -66880 640 -0 200 400 600 Load (g)
Figure 4.2 Variation of microhardness with load using a calibration block as the test sample. The microhardness of the calibration block is 704 DPH, represented by a horizontal line.
[O Indentation 1 o + Indentation 2 0 O o + o - _ __
900 850 800 750 DPH700 -6650 600 660 600 -0 Figure 4. 2 200 .3 Load (g) 4 400 600
Variation of microhardness with load, using a RSP Fe-13Ni-1C sample (aged at room temperature
for 456 hours) for the measurement.
-31-[
Random locations+
Vithin martensite plate
o o
0 o
0
t I I I I I I I I I I I I I I I I I I
1300
I I I
I I I a I I I I I
100 200 300 400 500 S00 700 800 900 1000
VICKERS HARDNESS NUMBER
20 Kg
'
/// IDEAL
*
Figure 4.4 Difference between light load and Vickers
microhardness readings taken on the same
specimens. (Marder [24]) -32-120 110 100 90 0 OT 60 z 50 30 20 10 ... A_
In addition, with such a small indentation, the thickness of the measuring lines on the microhardness instrument become significant, and the human error is great. By measuring the same indentation 10 times, the standard deviation in readings was approximately 30 DPH points for a 25 g load. Because there was such a large variation for each reading, 8-10 readings were taken on each specimen at each time increment, and 5-10 specimens were used for each alloy. These readings were then averaged to determine each point on the microhardness vs. time graphs. Thus at least 50 microhardness readings were averaged together to get a value for each aging time. Readings that were more than one standard deviation below the mean value were eliminated and the mean recalculated. It is assumed that these readings were not typical, probably due to the presence of retained austenite. The method for elimination of unrepresentative microhardness measurements and the averaging techniques used are further discussed in section 5.2.
4.6 Fracture Toughness Measurements
The effect of aging on the fracture toughness was measured in two ways. The first was with a standard three-point bend plane-strain fracture toughness test (KIC). The second was to look at the number of cracks formed upon making the microhardness indentations as a function of time. Each of these will be discussed separately.
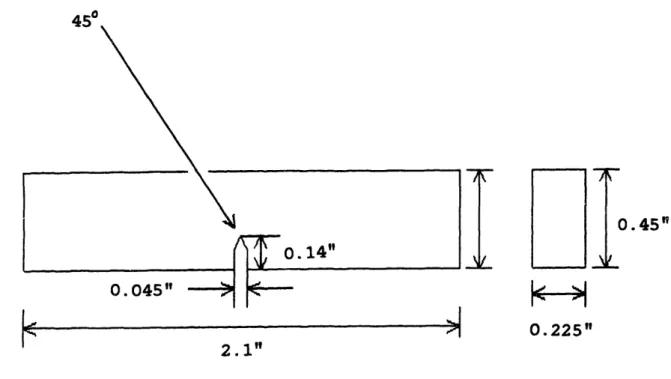
The three-point bend plane-strain fracture toughness test was performed according to ASTM standard E399-81. The sample geometry and dimensions are displayed in Figure 4.5. This is a standard KIC test. The RSP Fe-13Ni-lC and the conventionally processed Fe-15Ni-0.9C materials were used.
0.045"
J
3
H
0
.
45
"
0.225"
Figure 4.5 Drawing of three-point bend plain strain fracture toughness specimen.
4R0
I
2.1"
' I V ,
The RSP alloy contained a very high volume fraction of A1203 inclusions and it was feared that they would interfere with the fracture path. However, there was not enough of either material to do the recommended 3 tests per test condition.
Heat treatment of the samples was the same as for the microhardness samples, 3 hours at 1100 C. Machining of the samples was performed in the austenitic state. The samples were then fatigue pre-cracked in the austenitic state in three-point bend plane strain, using an Instron fatigue machine. The load during fatigue pre-cracking was low so that
it took 60,000 - 100,000 cycles to initiate the crack.
After pre-cracking, metallography was performed to insure that no martensite formed due to plastic deformation during the pre-cracking process. The samples were then quenched in liquid nitrogen to form martensite. The pre-crack length was measured before and after quenching and was found not to change. Samples were then aged the appropriate amount of time and then tested on an Instron machine, using the same three-point bend fixture as for pre-cracking.
Another method was also used to look at toughness. Ho-ever, this method was a qualitative one. It was noticed that while measuring the microhardness that the martensitic plates often cracked upon applying the 25 g load. An example of this cracking is seen in Figure 4.1. A crack can be seen extending from one corner of the microhardness indentation. The indentations that cracked during load application were not
included in computing the microhardness value. However, they were noted to see if there was any dependence on aging time.
4.7 Atom Probe/Field-lon Microscopy
AP/FIM was done on the conventionally processed Fe-25Ni-0.4C alloy to determine when the modulated structure reached full amplitude and began to coarsen. Since there is already
considerable data available in the literature for the 15Ni-0.9C alloy [9, 15, 16], efforts were concentrated on the Fe-25Ni-0.4C material.
The Fe-25Ni-0.4C alloy was heat treated at 1100 C for 2 hours followed by water quenching, as for all the other experiments. To analyze the as-quenched structure, atom probe tips were prepared in the austenitic state and then placed in the atom probe and quenched in-situ to form martensite. To analyze later aging times, bulk samples were quenched in liquid nitrogen to form martensite and then aged in this form. The samples were subsequently polished into atom probe tips approximately 2-3 hours before analysis.
The method of Miller, Beaven and Smith was used for polishing the samples into atom probe tips [33]. Rough polishing was carried out with a 25% perchloric acid/75% acetic acid solution, floating on carbon tetrachloride, and an applied voltage between 15 and 18 volts. The final polish used a 2% perchloric acid/98% 2 butyloxy-ethanol solution and a voltage of 18 volts. All atom probe analyses were carried out at 50 K with a pulse fraction (pulse voltage/DC standing voltage) of 15%.
Chapter 5
Experimental Results and Discussion
5.1 Microstructure
As mentioned earlier, the steels were heat treated to obtain a large austenitic grain size. Since austenitic grain boundaries act as obstacles to the growth of martensitic plates during their formation, a large austenitic grain size tends to yield a large martensitic plate size.
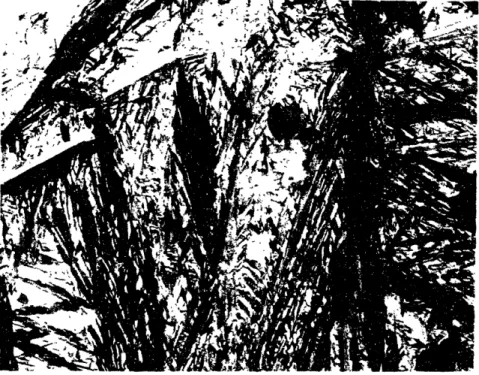
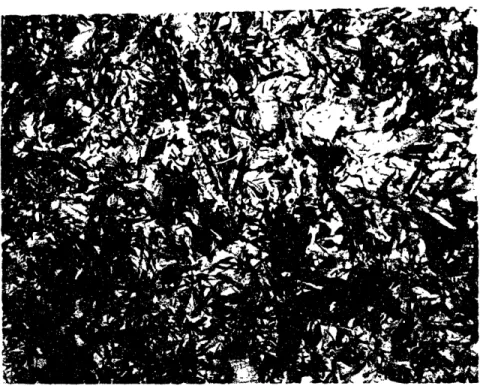
Variations in microstructure were observed due to changes in chemical composition and processing. Figure 4.1 is an example of the conventional Fe-15Ni-0.9C alloy, aged approximately 5000 hours. Figure 5.1 is an example of the conventional Fe-25Ni-0.4C alloy, aged approximately 2200 hours. It is seen that there is more retained austenite in the Fe-15Ni-0.9C alloy (approximately 17% total as compared to 10% total). Figure 5.2 is an example of the RSP Fe-13Ni-1C alloy, aged approximately 7500 hours. It is seen that there is more retained austenite (approximately 20% total) than in the conventional Fe-15Ni-0.9C alloy. It should also be noted that the inclusion content of the RSP steel is much higher than in the conventional steel. These alumina inclusions are present as small spheres. They are seen as small, dark circles in Figure 5.2, with an average diameter of approximately 3 microns. The as-heat-treated austenitic grain size and thus the martensitic plate size is also much smaller in the RSP steel, for a similar heat treatment. This is because the RSP alloy initially has a much smaller austenitic grain size and also because the inclusions pin the austenitic grain boundaries during heat treatment and do not let them grow as rapidly as in the lower inclusion content, conventional steel.
I -? C,> *t R. wQ -;, ,- ss. ,, Br. Ef: b N _:·:1~·~.. .. ~~~~~
Figure 5.1 Photomicrograph of conventionally processed
Fe-25Ni-0.4C, aged at room temperature for 2200 hours.
,-Figure 5.2 Photomicrograph of RSP Fe-13Ni-lC, aged at room temperature for 7500 hours.
-39-5.2 Microhardness
As previously mentioned, all microhardness indentations were made with a relatively light load so that they each fit entirely within a martensitic plate. The effect of retained austenite on the measurement is thereby minimized. The microstructural variations from alloy to alloy, such as average martensitic plate size and inclusion content, are also minimized. Figure 4.1 is an example of a 25 g microhardness indentation within the martensitic plate of a conventionally processed Fe-15Ni-0.9C alloy.
The effect of aging on the variation in microhardness was observed by plotting the microhardness versus time at constant aging temperature. Figure 5.3 is a plot of microhardness vs. time for RSP Fe-13Ni-l1C aged at room temperature. In this plot, two averaging techniques used on the microhardness data are displayed. Averaging method 1, indicated by open squares, included every microhardness data point measured. The standard deviation of this set of data was approximately 60 DPH points. In averaging method 2, indicated by crosses all microhardness data points that read softer than one standard deviation below the average were eliminated. It is assumed that these few readings that were exceptionally soft included some retained austenite below or around the martensitic plate. The standard deviation of this set of data was approximately 40 DPH points. This second averaging technique will be used for all subsequent plots. The argument for adopting this averaging technique is that it does not significantly change the shape of the curve, (it only raises each point 15 DPH points on the average), while it does considerably decrease the standard deviation of each point, thereby making the curve more accurate. Also, the above mentiioned physical reason for eliminating th soft points is reasonable.
1I
10 100
log(t) in hours
Figure 5.3 Plot of microhardnesb vs. time for RSP Fe-13Ni-lC, aged at room temperature,
comparing averaging method 1 with averaging method 2. OU 940 -920 900 880 880 840 820 800 -DPI 780 760 -740 720 -700 680 680 -840 --1 0.1 o 4 + O 3 + o
0§
,4
,
,
+4 O _ _ _ _ _ _ _ + 3 Averaging method o + Averaging method 2 I -800 -750 -700 -650 -600 -550 10000 I 3 1000 w - - _ " - __ _· I · --n IThe left y-axis of Figure 5.3 represents the microhardness values as they were measured experimentally. The right y-axis represents the microhardness corrected for the light load. According to Figure 4.4, the light load will always read higher than a 20 Kg load. Using Figure 4.4, the right y-axis was calculated by the formula:
DPHcorrected = DPH/1.143 - 25 (5.1)
These values are probably closer to the actual microhardness of the martensitic plates.
It is seen in Figure 5.3 that there are three distinct stages of aging. The zeroth stage of aging (AO) is the region encompassing the first peak (from t=O to t=50 hours). The first stage (Al) is the region from the end of the first peak to the top of the second hardness peak (from t=50 to t=300 hours). The second stage (A2) corresponds to the softening portion of the second peak (from t=300 to t=1000 hours). We are naming these stages of aging AO, Al, and A2 to maintain some correspondance with earlier literature [5]. The third peak is due to the precipitation of epsilon carbides, and is considered the first stage of tempering (T1). Each stage of aging will be discussed individually.
Zeroth Stage of Aging
In this region called the zeroth stage of aging (AO), there is localized rearrangement of carbon atoms. It is interesting to note that this is roughly the same time where Taylor found a resistivity peak [9]. Taylor's resistivity data are reproduced in Figure 5.4. The resistivity peak is not well understood but is generally attributed to the carbon atom redistribution which increases the static displacement of iron atoms [9, 13]. The fact that a hardness peak is observed at the same time implies that there is some significant
in
I
Time, minutes
Figure 5.4 Resistivity at -196 C (corrected for retained austenite) vs. log(time) for conventionally processed Fe-15Ni-0.9C at various temperatures
structural change that occurs here. It is not certain what happens at this time but several possibilities will now be discussed.
Several studies have implied that spinodal decompostion of the martensite begins immediately upon bringing the martensite to room temperature [9, 15, 16]. This would explain the hardening portion of the AO stage of aging. (Spinodal hardening is discussed in the next section.) However, this does not explain the subsequent decrease in hardness. One possiblity for this slight decrease in hardness is that carbon atoms are being pulled away from dislocations to join the spinodal structure. During the initial stages of aging, the carbon atoms are redistributing themselves locally and may form Snoek atmospheres around the dislocations [11]. When the carbon atoms leave these atmospheres, the dislocations are free to move. This could result in a slight decrease in hardness until the spinodal hardening overcomes this effect and the hardness again increases.
Another possiblity is based on spinodal strengthening models. If the hardening is attributed to spinodal decomposition, one would model this by superimposing carbon rich areas as particles on top of the solid solution hardening effect, which is quite potent for carbon in iron. The increase in hardness could be attributed to both of these hardening effects. The decrease in hardening could be a result of the carbon leaving solid solution to join the spinodal structure. If the decrease in solid solution hardening is faster than the increase in spinodal hardening, a decrease could be explained.
Other studies have implied that spinodal decomposition does not begin immediately but rather uncoordinated carbon clusters form first and then the clusters align to form a modulated spinodal structure. The increase in hardness could
then be attributed to the formation of carbon clusters and the subsequent decrease to coarsening of these clusters.
First Stage of Aging
The second microhardness peak at approximately 300 hours corresponds well with AP/FIM data indicating that this is approximately the time when full compositional modulation amplitude is reached for aging a Fe-15Ni-lC martensite at room temperature [16]. (This is the same alloy that is referred to as conventional Fe-15Ni-0.9C in this thesis.) The increase in hardness leading to this peak may be attributed to spinodal decomposition. If this peak is going to be attributed to spinodal decomposition, it should be determined whether any existing spinodal hardening models apply. Several spinodal hardening models were discussed in Chapter 2 [25, 26, 27, 28] and will now be applied.
Each of the spinodal strengthening models discussed in Chapter 2 presented an equation for the critical resolved shear stress as a function of the wavelength and/or the amplitude of the compositional modulations. In order to apply these models to the data discussed above, values for the amplitude and wavelength were taken from the work of Chang, Smith, and Olson [16] and substituted into these equations to see if any yielded a linear relationship. The constants for each equation were not known so no absolute values for the critical resolved shear stress could be calculated. Since the portion of the hardening curve attributed to spinodal hardening is linear when plotted as a function of log(t) (Figure 5.3), a linear relationship from any of the above mentioned models is considered to be a good correlation. Also, the fastest hardening rate was observed in this region of the microhardness curve. For these models to apply they must predict the fastest hardening to occur in this region.
The equations predicted from these spinodal hardening models are as follows:
Cahn [26] TCRSS = KA2 (2.1)
Kato, et.al.[27] TCRSS = KA (2.2) Kato [28] TCRSS = K1A + K2/w (2.3) Ardell [29] TCRSS = K(A)5/3(w)2/3 (2.4) Figures 5.5, 5.6, 5.7, and 5.8 are plots of TCRSS/K as a function of log(t) for these models. The points designated by open squares were calculated with the experimental amplitude and wavelength data from Chang, Smith and Olson [16]. The points designated by crosses were calculated by interpolating
the data from Chang, Smith and Olson [16].
The first two curves, Figures 5.5 and 5.6 are dependent only on the carbon modulation amplitude. It is seen that in the area of interest (t=100 to t=300 hours), each of these two curves is linear, and increasing. The rate of hardness increase is the highest in this region. Thus both models are reasonable for these data. Without knowing all of the constants involved, it is not possible to pick which of these models is favored.
The second two curves, Figures 5.7 and 5.8, take the carbon modulation wavelength into account. For the Kato model [28], the two constants K1 and K2 are not known, so a family of curves was derived to indicate various possibilities. A typical curve from this family of curves is displayed in Figure 5.7. This is the only model that accounts for the decrease in hardness with increasing wavelength. The Ardell model displayed in Figure 5.8 makes little sense since it predicts a rapid increase in hardness with increasing wavelength at the longer aging times. Thus the fastest rate of hardness increase did not occur in the time range observed
80 -60 40 30 20 10 - 0-0· 1 1 10 I I 2 100 log(t) in hours
Figure 5.5
Critical resolved shear stress vs. log(time)using Cahn's model [26] and data from Chang, Smith, and Olson [16].
80 80 - 70-TCRSS K 0 o 0 0 o 0o 0~~o I 3 1000 4 10000 * --· fir% Bu1 0 1
2
lo(t) in hours00
log(t) in hours
Figure 5.6 Critical resolved shear stress vs. log(time) using the Kato, et.al. model [27] and data from Chang, Smith, and Olson [16].
4 11 10 9 8 - 7- 8-TCRSS R o 0 0 o o 6- 4- 3- 21 - 0-0 I I0 to 3 1000 4 ioo00 1 · · · 1 · · ] f 4A. I
o o 4+ o 4 Eo Experimental
+ Interpolated
I 3 1000log(t) in hours
Figure
5.7
Critical resolved shear stress vs. log(time) using the Kato model [28] and data from Chang, Smith, and Olson [16].B
8-
5-TCRSS K 4 -+ o 3 - 2- I-0 -0 ! I 10 2 100O 4 10000I l
100
log(t) in hours
Figure 5.8 Critical resolved shear stress vs. log(time) using Ardell's model [29] and data from Chang, Smith, and Olson [16].
-50-280 -240 -220 -200 160 160 -TCRSS K 140 120 100 -D Experimental
t
Interpolated 0 13 4 + 0 80 - 60-40 - 20-0 0 i 10to 3 1000 4 10000 - -sexperimentally (t=100 to t=300 hours), but rather after this time when a decrease in hardness was observed experimentally.
Second Stage of Aging
The decrease in hardness corresponding to the second hardness peak is due to coarsening of the spinodal structure. In this region, we have already reached full amplitude which stays constant, and the wavelength of the spinodal structure increases rapidly with time. It is common to observe softening when a given structure coarsens. As discussed in the previous section, the Kato spinodal strengthening model is the only one that explains this decrease in hardness with increasing carbon composition modulation wavelength.
The Onset of Tempering
The third hardness peak is most likely due to the precipitation of epsilon carbides. On aging at room temperature, Taylor was able to identify epsilon carbides with TEM when the wavelength reaches approximately 100 angstroms [34]. This corresponds to 1000-2000 hours at room temperature. In this study the hardness started increasing again after about 1000 hours at room temperature, marked by the beginning of the third hardness peak.
Summary of the Three Stages of Aging
Figure 5.9 is a schematic of the d0 0 2, resistivity, carbon modulation amplitude and wavelength, and microhardness vs. time for a steel with an approximate composition of Fe-15Ni-1C. This figure clearly shows that the zeroth stage of aging (A0) corresponds with the resistivity peak. The first stage of aging (Al) corresponds with an increase in carbon modulation amplitude (with constant wavelength). The second stage of aging (A2) corresponds with an increase in carbon
f I I ) I I lif?) ' If~~~ I , log(t) in hours
Figure
5.9
Summary of x-ray data (a), resistivity (b), amplitude (c), wavelength (c), andmicrohardness (d) vs. time.
-52-d002 A. w DPH I I : I 1 · 1~~~~~~~~~~~~~~~~~~~~~~~~~~~~~1 I II I I I~~~~~~~~~~~~~~~~~~~~~~~~~~ I I~~~~~~~~~~~~~~~~~~~~~~~~~~~ I 0modulation wavelength (with constant amplitude). The beginning of tempering corresponds with the precipitation of epsilon carbides (observed when the carbon modulation wavelength is approximately 100 angstroms).
The Effect of Aging Temperature
The effect of raising the aging temperature is observed in the RSP Fe-13Ni-lC alloy by comparing Figure 5.3 (aged at room temperature), Figure 5.10 (aged at 60 C) and Figure 5.11 (aged at -3 C). As is expected, raising the temperature increases the kinetics of the carbon redistribution, and the hardness peaks are shifted to earlier times.
It is assumed that the kinetics of aging at 60 C (Figure 5.10) were too fast to see the AO stage of aging. Looking back at Taylor's resistivity data [9] (Figure 5.4) it is seen that the resistivity peak which corresponds with the AO stage of aging occurs on the time scale of 10 minutes, which is earlier than the first reading on Figure 5.10. The Al and A2 stages of aging are clearly shown in the second hardness peak, on the order of 50 hours. The onset of tempering is also clearly shown by the third hardness peak, on the order of 200 hours.
The kinetics of aging at -3 C are very slow as seen in Figure 5.11. As mentioned in section 4.4, each of these samples was brought to room temperature for 10 minutes for each set of microhardness readings. In order to correct for the samples aging at room temperature for a time, the hardening that can be attributed to aging at room temperature was subtracted out for each point. This was done by taking the slope of the first part of the curve in Figure 5.4 to come up with the correction factor of 1.5 DPH points per 10 minutes at room temperature.
I
10 100
log(t) in hours
Figure 5.10 Plot of microhardness vs. time for RSP Fe-13Ni-1C, aged at 60 C. -54-DPH 980 940 920 900 880 860 840 820 800 780 760 740 720 700 880 660 640 -i 0.1 + + + + 4 4 -800 -750 -700 -650 -600 -550 10000
i
1 1000 _ _ _~ _ X_1 3
1 10 100 1000
log(t) in hours
Figure 5.11 Plot of micrdhardness vs. time for RSP Fe-13Ni-1C, aged at -3 C. 960 940 920 900 880 880 840 820 800 DPI 780 780 740 720 700 880 66880 840 -1 0.1 10000