HAL Id: hal-01826691
https://hal.archives-ouvertes.fr/hal-01826691
Submitted on 15 Apr 2021
HAL is a multi-disciplinary open access
archive for the deposit and dissemination of sci-entific research documents, whether they are pub-lished or not. The documents may come from teaching and research institutions in France or abroad, or from public or private research centers.
L’archive ouverte pluridisciplinaire HAL, est destinée au dépôt et à la diffusion de documents scientifiques de niveau recherche, publiés ou non, émanant des établissements d’enseignement et de recherche français ou étrangers, des laboratoires publics ou privés.
How good is your marine protected area at curbing
threats?
Mirta Zupan, Fabio Bulleri, Julian Evans, Simonetta Fraschetti, Paolo
Guidetti, Antoni Garcia-Rubies, Marta Sostres, Valentina Asnaghi, Anthony
Caro, Salud Deudero, et al.
To cite this version:
Mirta Zupan, Fabio Bulleri, Julian Evans, Simonetta Fraschetti, Paolo Guidetti, et al.. How good is your marine protected area at curbing threats?. Biological Conservation, Elsevier, 2018, 221, pp.237– 245. �10.1016/j.biocon.2018.03.013�. �hal-01826691�
1
How good is your marine protected area at curbing threats?
Mirta Zupan
a*, Fabio Bulleri
b, Julian Evans
c, Simonetta Fraschetti
d, Paolo Guidetti
e,
Antoni Garcia-Rubies
f, Marta Sostres
a, Valentina Asnaghi
g, Anthony Caro
a, Salud
Deudero
h, Raquel Goñi
h, Giuseppe Guarnieri
d, Francois Guilhaumon
i, Diego Kersting
j,k, Athina Kokkali
l, Claudia Kruschel
m, Vesna Macic
n, Luisa Mangialajo
o,p, Sandra
Mallol
h, Enrique Macpherson
f, Antonella Panucci
l, Mirko Radolovic
q, Mohamed
Ramdani
s, Patrick J. Schembri
c, Antonio Terlizzi
t,u, Elisa Villa
v, Joachim Claudet
aAffiliations
a
National Center for Scientific Research, PSL Research University, CRIOBE, USR
3278 CNRS-EPHE-UPVD, 66860 Perpignan, France
b
Dipartimento di Biologia, Università di Pisa, Via Derna 1, 56126, Pisa
cDepartment of Biology, University of Malta, Msida MSD2080, Malta
d
Department of Biological and Environmental Sciences and Technologies, University
of Salento, CoNISMa, 73100, Lecce, Italy
e
CoNISMa (Interuniversity National Consortium of Marine Sciences, 00196 Rome,
Italy)
f
Centre d’Estudis Avançats de Blanes, CEAB-CSIC, C. acces Cala S. Francesc 14,
17300 Blanes, Spain
g
Department for the Earth, Environment and Life Sciences, University of Genoa,
CoNISMa, 16132, Genoa, Italy
h
Instituto Español de Oceanografía - Centro Oceanográfico de Baleares. Muelle de
Poniente s/n 07015 Palma de Mallorca, Spain.
i
UMR 9190 MARBEC, IRD-CNRS-IFREMER-UM, Université de Montpellier,
34095 Montpellier, France
j
Section Paleontology, Institute of Geological Sciences, Freie Universität Berlin, 12249
Berlin, Germany
k
Departament de Biologia Evolutiva, Ecologia i Ciències Ambientals. Universitat de
08028 Barcelona, Spain
l
Hellenic Centre for Marine Research, 46.7 km. Athens Sounio, PO Box 712 19013
Anavyssos, Attiki, Greece
m
Department of Ecology, Agronomy and Aquaculture, University of Zadar, Trg kneza
Višeslava 9, 23000 Zadar, Croatia
n
Institute of marine biology, University of Montenegro, Dobrota b.b.; 85330 Kotor;
Montenegro
o
Université Côte d’Azur, CNRS, ECOMERS, Parc Valrose 28, 06108 Nice Cedex,
France
p
Sorbonne Universités, UPMC Univ Paris 06, CNRS, LOV, 06230
Villefranche-sur-mer, France
q
Administrative department for sustainable development, Region of Istria, Flanatička
29, 52100 Pula, Croatia
s
Institut scientifique de Rabat,
Avenue Ibn Batouta, Rabat, Morocco
t
Department of Life Sciences, University of Trieste, CoNISMa, 34127 Trieste, Italy
uStazione Zoologica Anton Dohrn, 80121, Napoli, Italy
v
Microbia Environnement, Observatoire Océanologique, F-66651 Banyuls/mer, France
*is corresponding author
2
Marine protected areas (MPAs) are key tools to mitigate human impacts in coastal
environments, promoting sustainable activities to conserve biodiversity. The designation of
MPAs alone may not result in the lessening of some human threats, which is highly
dependent on management goals and the related specific regulations that are adopted. Here,
we develop and operationalize a local threat assessment framework. We develop indices to
quantify the effectiveness of MPAs (or individual zones within MPAs in the case of
multiple-use MPAs) in reducing anthropogenic extractive and non-extractive threats operating at local
scale, focusing specifically on threats that can be managed through MPAs. We apply this
framework in 15 Mediterranean MPAs to assess their threat reduction capacity. We show that
fully protected areas effectively eliminate extractive activities, whereas the intensity of
artisanal and recreational fishing within partially protected areas, paradoxically, is higher
than that found outside MPAs, questioning their ability at reaching conservation targets. In
addition, both fully and partially protected areas attract non-extractive activities that are
potential threats. Overall, only three of the 15 MPAs had lower intensities for the entire set of
eight threats considered, in respect to adjacent control unprotected areas. Understanding the
intensity and occurrence of human threats operating at the local scale inside and around
MPAs is important for assessing MPAs effectiveness in achieving the goals they have been
designed for, informing management strategies, and prioritizing specific actions.
Keywords: fully protected area; partially protected area; management; extractive activities;
non-extractive activities; marine use;
Highlights
• We present and operationalize a cost-effective framework to quantify local threats
inside and outside MPAs.
• We assess how good MPAs are at curbing extractive and non-extractive threats.
• Fully protected areas effectively eliminate extractive threats.
• Fully protected areas attract non-extractive threats, when allowed.
• Small scale fishing intensity is larger in partially protected areas than outside.
3
1. Introduction
The effects of human coastal activities often combine into cumulative impacts on many
marine ecosystems (Halpern et al., 2015; 2008). Marine protected areas (MPAs) represent the
most common tool used in marine spatial planning to mitigate human impacts on marine
ecosystems (Lubchenco and Grorud-Colvert, 2015; Lubchenco et al., 2003) and are being
increasingly used worldwide both for conservation and fisheries management (Boonzaier and
Pauly, 2015). Understanding how MPAs target threats they’ve been designed to address is
essential to inform decision-making and optimize conservation outcomes (Guarderas et al.,
2008; Hockings et al., 2004). Some MPAs are located in regions of high cumulative human
impact, as shown both in the Mediterranean Sea (Coll et al., 2012; Rodríguez-Rodríguez et
al., 2015) and in the Atlantic (Batista et al., 2014). This led to debate about their
appropriateness at effectively reducing threats (Agardy et al., 2011; Jameson et al., 2002;
Rodríguez-Rodríguez et al., 2015).
Most studies that aimed at evaluating MPAs effectiveness at reducing threat intensities were
based on large scale assessments, with resolutions of 500 m (Batista et al., 2014) or 1 km
2grid cells (Micheli et al., 2013; Portman and Nathan, 2015). Little emphasis has been given
on mapping MPAs’ specific threats acting at smaller spatial scales -- possibly with some
heterogeneity across MPA zones in the case of multiple-use MPAs --, those at which MPAs
and their respective management actions are primarily designed to operate in (MPAs being a
local spatial management tool; Olsen et al., 2013). This can result in difficulties to translate
research findings into management actions, compromising potential benefits of MPAs
(Agardy et al., 2011; Freed and Granek, 2014; Kearney et al., 2012; Mills et al., 2010).
The effectiveness of MPAs in reducing threats should be assessed at a local scale, where
protection schemes are implemented. To achieve this goal, it is crucial to understand the
differences in occurrence and intensity of human activities between the protected and
unprotected areas (Claudet and Guidetti, 2010; Portman and Nathan, 2015). This helps to
determine whether an MPA is actually successful in mitigating threats or whether the trends
observed are merely an indicator of what is occurring outside of the protected area, at larger
scales (Hargreaves-Allen et al., 2011).
Two broad types of MPAs exist. First, fully protected areas (FPAs); where all extractive
activities (e.g., fishing) are prohibited and where some non-extractive actives (e.g., diving)
can be allowed. They are also known as no-take areas or marine reserves. Second, partially
protected areas (PPAs); where some activities are prohibited (e.g., spearfishing), others
regulated (e.g., fishing with trammel nets) and others allowed (e.g., boating). Those PPAs can
be further classified down according to the impact allowed and regulated uses have on
species and habitats (Horta e Costa et al., 2016). Different levels of partial protection,
together with full protection, can be combined spatially within multiple-use MPAs.
Accordingly, the capacity of MPAs to reduce threats will differ depending on their type,
design, regulations and level of enforcement (Di Franco et al., 2016; Guidetti et al., 2008;
Scianna et al., 2015). Therefore, information on the intensity of threats within each MPA
zone and in the surrounding external areas is necessary to assess MPA effectiveness in
reducing threats.
Obtaining detailed information on threats is resource demanding, both in terms of time and
costs, as the sources of information are largely heterogeneous (Levin et al., 2014). There is a
4
need for a reliable, cost-effective method to assess the threat-reduction capacity of MPAs,
robust to the heterogeneity of data sources and associated levels of confidence based on data
quality. In addition, methods need to be standardized across MPAs as to allow both threat
comparisons, among different zones within individual MPAs, and across MPAs.
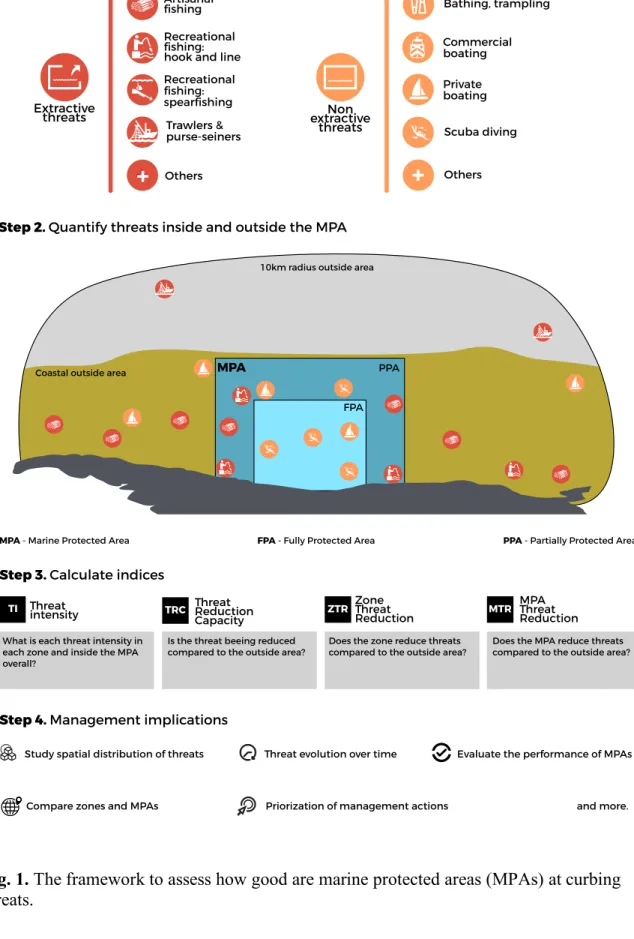
Here, we developed a cost-effective framework to quantify threats at local scale and assess
how MPAs are good (or not) at mitigating extractive and non-extractive local area-based
threats (Fig. 1). We trialed the framework on 15 Mediterranean MPAs. MPAs in the
Mediterranean Sea are a good model since this basin combines a high intensity of human uses
(Claudet and Fraschetti, 2010; Portman and Nathan, 2015) together with a high conservation
priority (Coll et al., 2010). This information is essential to inform local management as well
as forthcoming regional marine spatial planning (European Commission, 2017).
2. Materials and methods
2.1. Data collection
We first identified human threats that affect marine ecosystems at a local scale and that can
be managed by the MPA staff through regulations. This allowed the identification of 8 threats
(Table 1). Threats were either assigned to extractive (i.e., professional and recreational
fishing) or non-extractive uses (i.e., activities related to touristic frequentation).
We then developed indicators for each threat accounting for both availability of the data and
the quality of the information given. The set of indicators selected was tailored to the data
context of the study case, here the Mediterranean, where data availability can be poor in some
regions. Data relevant for quantifying threat indicators were collected by means of
questionnaires distributed to local managers and scientists. Local expert had to preferably
obtain threat indicator values from scientific studies, technical reports or other official
documents. When such sources were not available, expert opinion was considered. Three
levels of confidence were applied for the estimated threat values (qualitative: high, medium,
low).
Threat indicator values were considered as high confidence when
they were obtained
directly from recent quantitative data (e.g., from monitoring data), as medium confidence
when estimated from less recent quantitative data and as low confidence when no quantitative
data were available and local experts of the particular MPA provided the estimation of the
threat indicator value.
Threat indicators were quantified both within and outside 15 coastal MPAs in the
Mediterranean Sea (MPAs listed in Appendix A). In case of multiple-use MPAs (n=13), data
was obtained for each full (no-take/no-entry or no-take zones) or partial protection level. We
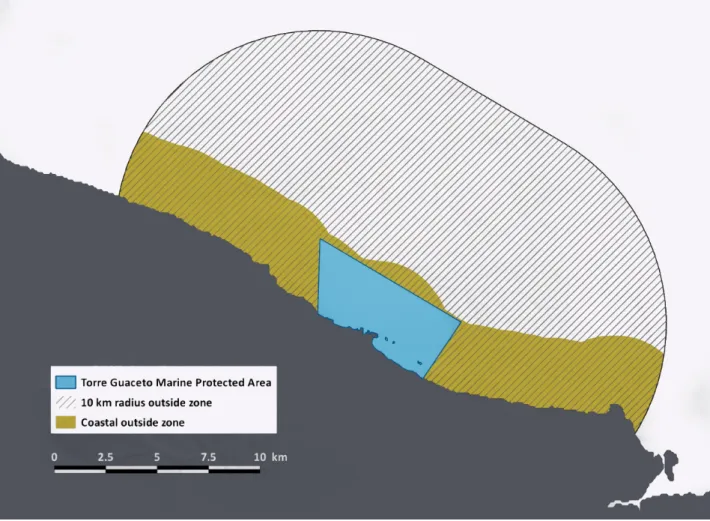
used two approaches to delineate the outside area, depending on the characteristics of the
threat: i) for commercial fishing with trawlers and purse seiners a 10 km radius surrounding
the MPAs was applied, while ii) for all other threats originating closer to the shore the coastal
section at a maximum distance from the shore equal to the MPAs most offshore limit was
considered (Fig C.1.). This specific outside areas were chosen following consultations with at
least one expert of each MPA. The two approaches aimed to reflect the nature and occurrence
of that threat in order to avoid over- or underestimation of threat intensities, respectively, in
the outside areas.
5
from management plans, whilst the outside surface areas were calculated using QGIS 2.8/1
(QGIS Development Team, 2015).
All the raw data collected in this study can be found in Appendix B.
2.2. Threat indices
2.2.1. Threat intensity
Using the raw threat values (Table B.1), we calculated the intensity TI
ijkof each threat i
within each protection level j (full protection, partial protection and no protection-outside) for
each MPA k, as follows:
TI
#$%=
T
#$%)
A
$%where T
ijkis the value of threat i in zone j of MPA k, and A
jkis the area (km
2) of zone j in
MPA k. We have then normalized threat intensity values (TI) by diving each value with the
maximum threat intensity value (TI) of each threat, which resulted in a standardized scale of
[0;1]. These normalized values were then used to calculate the mean threat intensity of each
threat in each protection level to explore the variability of threat intensity amongst protection
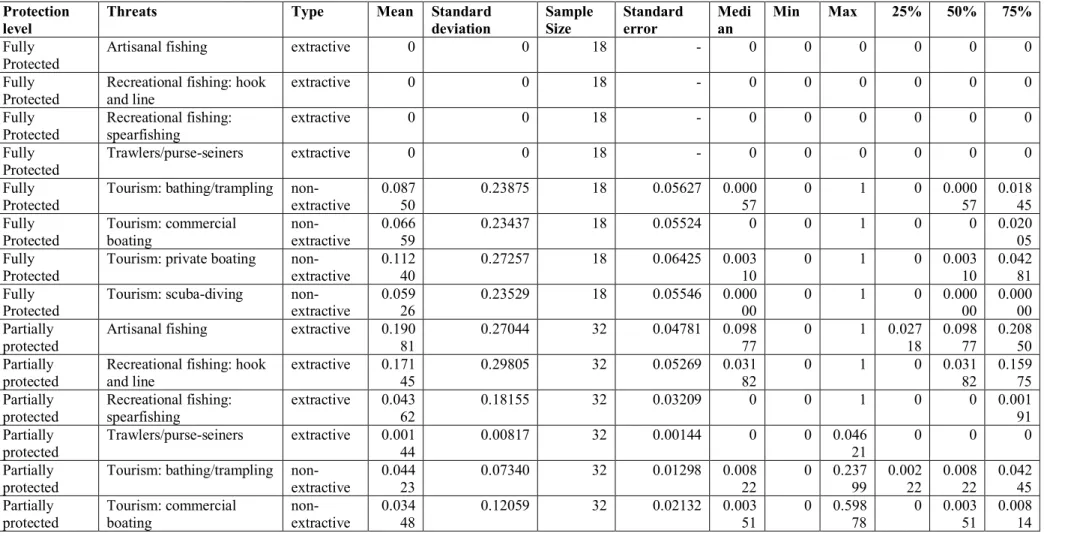
levels. Detailed descriptive statistics of the normalized threat intensity index can be found in
Appendix C.
2.2.2. Threat reduction capacity
The threat reduction capacity TR
ijkof each protection level j (excluding the outside area) of
each MPA k was calculated as:
TR
#$%= − ,1 −
TI
#$%TI
.,#%
)
0
where TI
ijkis the intensity of threat i inside zone j of MPA k, and TI
o,ikis the threat intensity
of threat i outside of the MPA k. A negative value of 12 indicates that the threat intensity is
reduced inside the protected area relative to the outside; a positive value of 12 indicates that
the threat intensity is higher inside the MPA relative to the outside. The mean threat
reduction capacity values (TR
ijk) were used to compare the reduction capacity of the fully and
partially protected zones for every threat. Detailed descriptive statistics of the threat reduction
capacity index can be found in Appendix C.
2.2.3. Zone threat reduction score
The zone threat reduction score (zT) was calculated as:
zT
45=
∑ TR
7 745∗ w
7∑ w
7 7,
where TR
ijkis the threat reduction capacity defined above and w
iis the weight associated to
threat i (Table 1). The weights for each threat were derived from Horta e Costa et al. (2016)
and were rescaled to values between 0 and 1, with 1 being the weight assigned to the threat
with the greatest ecological impact (i.e. trawling). The weights were used to discriminate
between different potential ecological impacts of each threat and were obtained with expert
6
knowledge, but based on previous studies (see detailed explanation in Appendix A of Horta e
Costa et al., 2016).
2.2.4. MPA threat reduction score
The MPA threat reduction score mpaT was calculated as:
mpaT
%=
∑ zT
$ $%∗ A
$%∑ A
$ $%,
where =1
$%is the threat reduction score of zone j of MPA k, and A
jkis the surface area of
zone j of MPA k. When the zone or MPA threat reduction score is negative, threats are being
effectively reduced inside the zone and/or MPA compared to outside. When the threat
reduction score is positive the MPA is actually enhancing threats rather than reducing them.
2.2.5. Local threat index
To account for the context in which MPAs are sited we calculated a local threat index lTI as
follows:
>1?
#%=
1?
.,#%max 1?
.,#,
where the TI
o,ikis the intensity of threat i outside MPA k and
max 1?
.,#is the maximum
intensity value of threat i recorded from all the outside areas of all considered MPAs. The
local threat index ranges from 0 to 1, indicating a local low and high intensity, respectively,
of a particular threat in the area outside an MPA compared to the broader context.
2.2.6. MPA local threat index
Local threat indices were aggregated at each MPA scale to calculate the MPA local threat
index mpa.lTI as follows:
mpa. >1?
5=
∑ >1?
7 #%∗ w
7∑ w
7 7where lTI
ikis the local threat index of threat i of MPA k, as calculated above, and w
iis the
weight of threat i. The values of the MPA local threat indices were normalized by dividing by
the maximum local threat index value, resulting in a standard scale of 0-1, with low scores
indicating a low local threat intensity, that is an overall low intensity of threats in the area
outside the MPA, when compared to threat intensities in area outside the other MPAs in the
region.
2.3. Data analyses
The relationship between the MPA threat reduction score (mpaT) and the MPA local threat
index (mpa.lTI) were explored using a linear model. Additionally, the relationship between
7
the threat reduction score, mpaT, and the age and size of the MPA were also tested with a
regression to investigate whether these design characteristics affect the threat reduction
capacity of MPAs.
The data on the confidence level associated with each threat type and zone protection level
was analysed using chi-square tests to assess whether there is an association between data
quality and zone type or threat type, respectively.
All analyses were conducted using R (R Development Core Team, 2016). The R script is
available in Appendix D.
3. Results
Mean threat intensities (TI) differed amongst protection levels threat type (Fig. 2). Fully
protected zones had no extractive threats (by definition), however they had the highest
intensity of all non-extractive threats. On average, the intensity of non-extractive threats was
2.6 and 16 times greater in fully protected zones compared to partially protected zones and
the area outside of the MPAs, respectively.
All threats were present in partially protected zones, with the highest levels of both
recreational and artisanal fishing (Fig. 2). In the area outside MPAs, the intensity of
extractive threats was up to 18 times greater than the intensity of non-extractive threats.
The threat reduction capacity (TR) differed across protection level and threat type (Fig. 3).
Fully protected areas removed all extractive threats, while on average, partially protected
zones did not reduce extractive threats. The intensities of large commercial fisheries (trawling
and purse-seine) were reduced in partially protected zones compared to the outside, yet the
intensities of artisanal and recreational fishing were approximately 4.9 times greater than in
the surrounding areas. All non-extractive threats were increased within fully and partially
protected zones, compared to the outside surrounding areas.
The mean zone threat reduction score (zT) for non-extractive threats was, on average, 4.8
greater for fully protected zones compared to partially protected zones, yet this value was
highly variable (Fig. 3).
The MPA threat reduction score (mpaT) ranged between -0.8 and 116 (Fig. 4). Overall, only
three MPAs reduced all threats relative to the outside. Five MPAs reduced all extractive
threats and two MPAs reduced all non-extractive threats relative to their outside area.
The intensity of threats in the areas outside of MPAs varied greatly among MPAs (Fig. C.2 in
Appendix C). There were no significant relationship between the MPAs’ threat reduction
score (mpaT) and the MPA local threat index (mpa.lTI), indicating that the capacity of MPAs
to reduce threats was independent on the intensity of threats in their surrounding areas
(p>0.05, see Fig. C.3 in Appendix C). Likewise, there were no significant relationships
between the MPA threat reduction score and the age or size of the MPA (p>0.05, see Fig. C.4
and C.5 in Appendix C).
The confidence levels associated with estimates of threat intensities differed among zones of
MPAs and the outside areas (chi-squared test, χ
2=153.54, p<0.001). More than half of the
values from the areas outside were given low confidence (Fig. 5). In contrast within the
MPAs, the majority of threat values had high confidence, 65% and 50% in fully and partially
8
protected zones, respectively.
Confidence levels also differed amongst threats (chi-squared test, χ
2=233.63, p<0.001). For
all extractive threats, the greatest proportion of values had high confidence (Fig. 6).
Scuba-diving and commercial boating were among the non-extractive threats with the highest
proportion of high confidence, while the values attributed to private boating and bathing had
low confidence.
4. Discussion
This study was designed to provide a framework of the effectiveness of MPAs at curbing
threats at the scale they are designed, developing indices of the intensity of threats at the scale
of single MPAs (Fig. 1). The information provided was scaled to support management
actions designed to enhance the success of each MPA in achieving its goals (Hockings et al.,
2004).
Our most compelling result is that threats can indeed increase in MPAs compared to outside
areas. Even if absent for fully protected zones, many extractive threats were larger in
partially protected zones compared to outside. Contrary to fully protected zones, partially
protected zones do not necessarily have the objective to eliminate threats (e.g., via a fishing
ban), but to regulate their intensity towards sustainable levels. Implementing management
strategies that allow and maintain ecologically sustainable uses ensures long-term benefits
from ecosystem services benefiting local economies and, hence, local communities (Roberts
et al., 2005). In the Mediterranean Sea, the regulatory regimes of partially protected areas
vary from MPA to another, however there are some common modalities (Portman et al.,
2012).
Artisanal and recreational fishing are permitted in partially protected zones of many MPAs,
although most of the time subjected to restrictions in the type of gear allowed. The intensity
of artisanal and recreational fishing was up to 4.8 times higher inside partially protected
zones compared to outside control areas. While the regulatory regime in partially protected
zones may be stricter than in the surrounding outside areas, the former still attract more
fishers and hence increase fishing pressure. Most of the partially protected zones considered
in this study surround fully protected areas (Appendix A) and may attract fishermen. Full
protection enhance fish abundance and size (Guidetti et al., 2014; Sala et al., 2012), often
resulting in the spillover of larvae and adults to adjacent unprotected areas (Di Franco et al.,
2015; 2012; Di Lorenzo et al., 2016; Garcia-Rubies et al., 2013; Goñi et al., 2010; Stobart et
al., 2009), hence concentrating fishing effort (Kellner et al., 2007; Stelzenmüller et al., 2007).
The intensity of non-extractive threats was also higher within MPAs than in the areas outside,
and at least 4 times higher in fully protected zones compared to partially protected zones. By
definition, fully protected areas are places aiming to protect the full spectrum of biodiversity
by limiting all kinds of extractive and destructive activity within them (Allison et al., 1998),
yet this does not exclude all human activity. Indeed, most fully protected zones allow and, as
we show here, attract visitation with the intent of non-extractive activities (Thurstan et al.,
2012). Increasing non-extractive touristic activities are viewed as a positive socioeconomic
output of MPAs in the Mediterranean Sea and worldwide (Leisher et al., 2007; Pascual et al.,
2016), as they promote education, support employment and generate revenue
(Hargreaves-Allen et al., 2011; Pascual et al., 2016; Spalding et al., 2017). Increasing tourism is, therefore,
often listed as a looked-for objective of MPAs (Hargreaves-Allen et al., 2011). Thurstan et al.
9
(2012) suggest that unless all activities are adequately managed, regulation of extractive
activities alone may not guarantee the levels of biodiversity protection expected from fully
protected zones.
Only three MPAs were effective in reducing the intensity of threats in respect to adjacent
unprotected areas. Examining the context in which MPAs are established is, nevertheless,
central to understanding the capacity of MPAs in addressing threats and their conservation
potential (Portman and Nathan, 2015). The majority of MPAs in this study are multiple-use
MPAs that accommodate a variety of uses. This type of MPAs is common for densely
populated systems (Agardy et al., 2003), such as the Mediterranean Sea, where reducing all
threats is unlikely. Portman et al. (2015) showed that the
variety of activities occurring within
the Mediterranean MPAs is often greater than in the coastal unprotected areas of many
Mediterranean countries. Yet, multiple use MPAs and particularly partially protected areas
alone are now the most common type of MPAs being implemented worldwide (Claudet,
2017). They are being established to meet the international targets of protection (Agardy et
al. 2016), with the stated objectives of biodiversity conservation. Our results point that the
achievability of their goals should be questioned, as here, we show that not only the variety,
but also intensity of threats is generally greater within MPAs than in the areas outside (see
also Mora et al., 2006) that leads to the low threat reduction capacity of MPAs.
The capacity to reduce (or not) threats was not dependent on the threat local context, the age
or the size of the MPA. This suggests that the relationship between threat-intensity and
reduction-capacity is mainly a function of management objectives and capacity (Gill et al.,
2017), corresponding regulations (Horta e Costa et al. 2016) and enforcement (Guidetti et al.,
2008) of each MPA rather than the magnitude of the outside threat intensities or design
features. Hargreaves et al. (2017) examined the differences in threats inside and outside coral
reef MPAs and they showed that MPAs with reduced threats had more staff and invested
more funds into active management. Indeed, management has been identified as one of the
most important factors affecting the effectiveness of MPAs (Gill et al., 2017). Understanding
how different management regimes affect the threat reduction capacity of zones in
multiple-use MPAs should be further investigated as it could shed light onto the highly variable
responses we have observed among protection levels.
Our framework uses threats, and their respective indicators, that are most common and were
easily obtained in the Mediterranean MPAs. While we were able to trial our framework using
the information available, the assessment of the MPAs threat reduction capacity could be
refined with more detailed and robust data. Besides, we do acknowledge that other types of
threats may be present in other systems yet this issue can be easily overcome, as our
framework can be adapted to suit a variety of systems, by incorporating new threats and their
corresponding indicators.
We did not include poaching as one of the threats in our framework. Poaching levels can
often be higher than assumed
in MPAs
(
Bergseth et al., 2017) and represent an important
threat to the effectiveness of MPAs. While we
initially planned to collect data on poaching,
we faced strong difficulties to quantitatively standardize this threat across MPAs. If
standardized data can be obtained across a range of MPAs, this can easily be added in the
framework as an additional threat.
Our results point out that we have greater confidence about what is happening inside MPAs
than in their surrounding areas. The low confidence associated with threat values in the
10
unprotected, outside, areas might have affected the precision of our results. The areas outside
MPAs are usually less monitored or completely unmonitored and estimating threat values for
these areas was challenging. Good management should require regular monitoring, both for
the ecological and environmental status of the MPA habitats (Fraschetti et al., 2013), but also
should incorporate monitoring of the main activities that can lead to potential threats both
inside and beyond the borders of the MPA (Claudet and Guidetti, 2010; Hargreaves-Allen et
al., 2017; Parravicini et al., 2013).
Evaluating the success of MPAs is essential to maximize their conservation potential (Agardy
et al., 2016; Pomeroy et al., 2005), especially within an adaptive management framework
(Scianna et al., 2015). Contrary to previous assessments (Coll et al., 2012; Micheli et al.,
2013) our approach uses data specific to each zone of the MPA, where strong heterogeneity
among threats intensity can occur, and accounts for manageable threats at manageable scales
relevant for MPA managers. We therefore believe this work has general and wide
applications, especially for managers and planners who need to assess the success of MPAs at
achieving marine spatial planning goals (Partelow et al., 2015).
Management implications
By providing the ability to easily compare threat intensities and the capacity of a given MPA
to reduce threats, our proposed framework can help prioritize management actions.
Management actions should first be directed towards reducing threats that would prevent
achieving the MPA objectives. Besides, the threat assessment framework can help identify
unexpected indirect effects of MPA creation, such as increased non-extractive threat due to
increase attendance.
By providing the ability to easily compare threat reduction score among zones, in the case of
multiple-use MPAs, our proposed framework can help guide local spatial planning.
Assigning different uses in different zones can have trade-offs in terms of biodiversity
conservation and ecosystem services delivery and threat assessment is a first step towards the
identification of acceptable thresholds of uses. When scaled-up regionally, the threat
assessment framework can help guide regional spatial planning.
The threat assessment framework could be incorporated into monitoring programs. First,
monitoring threat evolution over time helps identify the management actions able to reduce
threats. Second, this would necessarily imply to monitor and collect data, which is a
11
Acknowledgments
This work was financially supported by the ERA-Net BiodivERsA (BUFFER project) and
the EU-FP7 (COCONET project).
References
Agardy, T., Bridgewater, P., Crosby, M.P., Day, J., Dayton, P.K., Kenchington, R., Laffoley,
D., McConney, P., Murray, P.A., Parks, J.E., Peau, L., 2003. Dangerous targets?
Unresolved issues and ideological clashes around marine protected areas. Aquatic
Conserv: Mar. Freshw. Ecosyst. 13, 353–367. doi:10.1002/aqc.583
Agardy, T., Claudet, J., Day, J.C., 2016. “Dangerous Targets” revisited: Old dangers in new
contexts plague marine protected areas. Aquatic Conserv: Mar. Freshw. Ecosyst. 26, 7–
23. doi:10.1002/aqc.2675
Agardy, T., di Sciara, G.N., Christie, P., 2011. Mind the gap: Addressing the shortcomings of
marine protected areas through large scale marine spatial planning. Mar. Policy 35, 226–
232. doi:10.1016/j.marpol.2010.10.006
Allison, G.W., Lubchenco, J., Carr, M.H., 1998. Marine Reserves are Necessary but not
Sufficient for Marine Conservation. Ecol. Appl. 8, S79-92
Batista, M.I., Henriques, S., Pais, M.P., Cabral, H.N., 2014. Assessment of cumulative
human pressures on a coastal area: Integrating information for MPA planning and
management. Ocean Coast. Manag. 102, 248–257. doi:10.1016/j.ocecoaman.2014.09.020
Boonzaier, L., Pauly, D., 2015. Marine protection targets: an updated assessment of global
progress. Oryx 50, 27–35. doi:10.1017/S0030605315000848
Bergseth, B.J., 2017 Effective marine protected areas require sea change in compliance
management. ICES J. Mar. Sci.
doi:10.1093/icesjms/fsx105
Claudet, J., Fraschetti, S., 2010. Human-driven impacts on marine habitats: A regional
meta-analysis in the Mediterranean Sea. Biol. Cons. 143, 2195–2206.
doi:10.1016/j.biocon.2010.06.004
Claudet, J., Guidetti, P., 2010. Improving assessments of marine protected areas. Aquatic
Conserv: Mar. Freshw. Ecosyst. 20, 239–242. doi:10.1002/aqc.1087
Claudet, J., 2017. Six conditions under which MPAs might not appear effective (when they
are). ICES J. Mar. Sci. doi: 10.1093/icesjms/fsx074.
Coll, M., Piroddi, C., Albouy, C., Ben Rais Lasram, F., Cheung, W.W.L., Christensen, V.,
Karpouzi, V.S., Guilhaumon, F., Mouillot, D., Paleczny, M., Palomares, M.L.,
Steenbeek, J., Trujillo, P., Watson, R., Pauly, D., 2012. The Mediterranean Sea under
siege: spatial overlap between marine biodiversity, cumulative threats and marine
reserves. Glob. Ecol. and Biogeogr. 21, 465–480. doi:10.1111/j.1466-8238.2011.00697.x
Coll, M., Piroddi, C., Steenbeek, J., Kaschner, K., Ben Rais Lasram, F., Aguzzi, J.,
Ballesteros, E., Bianchi, C.N., Corbera, J., Dailianis, T., Danovaro, R., Estrada, M.,
Froglia, C., Galil, B.S., Gasol, J.M., Gertwagen, R., Gil, J., Guilhaumon, F.,
Kesner-Reyes, K., Kitsos, M.-S., Koukouras, A., Lampadariou, N., Laxamana, E., López-Fé de
la Cuadra, C.M., Lotze, H.K., Martin, D., Mouillot, D., Oro, D., Raicevich, S.,
Rius-Barile, J., Saiz-Salinas, J.I., San Vicente, C., Somot, S., Templado, J., Turon, X., Vafidis,
D., Villanueva, R., Voultsiadou, E., 2010. The Biodiversity of the Mediterranean Sea:
Estimates, Patterns, and Threats. PLOS ONE 5, e11842–36.
doi:10.1371/journal.pone.0011842
Di Franco, A., Calò, A., Pennetta, A., De Benedetto, G., Planes, S., Guidetti, P., 2015.
Dispersal of larval and juvenile seabream: Implications for Mediterranean marine
protected areas. Biol. Conserv. 192, 361–368. doi:10.1016/j.biocon.2015.10.015
12
Di Franco, A., Coppini, G., Pujolar, J.M., De Leo, G.A., Gatto, M., Lyubartsev, V., Melià, P.,
Zane, L., Guidetti, P., 2012. Assessing Dispersal Patterns of Fish Propagules from an
Effective Mediterranean Marine Protected Area. PLOS ONE 7, e52108–14.
doi:10.1371/journal.pone.0052108
Di Franco, A., Thiriet, P., Di Carlo, G., Dimitriadis, C., Francour, P., Gutiérrez, N.L., de
Grissac, A.J., Koutsoubas, D., Milazzo, M., del Mar Otero, M., Piante, C., Plass-Johnson,
J., Sainz-Trapaga, S., Santarossa, L., Tudela, S., Guidetti, P., 2016. Five key attributes
can increase marine protected areas performance for small-scale fisheries management.
Sci. Rep. 6, 1–9. doi:10.1038/srep38135
Di Lorenzo, M., Claudet, J., Guidetti, P., 2016. Spillover from marine protected areas to
adjacent fisheries has an ecological and a fishery component. J. Nat. Conserv. 32, 62–66.
doi:10.1016/j.jnc.2016.04.004
European Commission, 2017. Maritime Affairs, Maritime spatial Planning.
https://ec.europa.eu/maritimeaffairs/policy/maritime_spatial_planning_en
(accessed
10.07.2017)
Fraschetti, S., Guarnieri, G., Bevilacqua, S., Terlizzi, A., Boero, F., 2013. Protection
enhances community and habitat stability: evidence from a mediterranean marine
protected area. PLOS ONE 8, e81838. doi:10.1371/journal.pone.0081838
Freed, S., Granek, E.F., 2014. Effects of Human Activities on the World's Most Vulnerable
Coral Reefs: Comoros Case Study. Ocean Coast. Manage. 42, 280–296.
doi:10.1080/08920753.2014.904261
Garcia-Rubies, A., Hereu, B., Zabala, M., 2013. Long-term recovery patterns and limited
spillover of large predatory fish in a Mediterranean MPA. PLOS ONE 8, e73922.
doi:10.1371/journal.pone.0073922
Gill, D.A., Mascia, M.B., Ahmadia, G.N., Glew, L., Lester, S.E., Barnes, M., Craigie, I.,
Darling, E.S., Free, C.M., Geldmann, J., Holst, S., Jensen, O.P., White, A.T., Basurto, X.,
Coad, L., Gates, R.D., Guannel, G., Mumby, P.J., Thomas, H., Whitmee, S., Woodley,
S., Fox, H.E., 2017. Capacity shortfalls hinder the performance of marine protected areas
globally. Nature. 000, 1–16. doi:10.1038/nature21708
Gonson, C., Pelletier, D., Gamp, E., Preuss, B., Jollit, I., Ferraris, J., 2016. Decadal increase
in the number of recreational users is concentrated in no-take marine reserves. Mar. Poll.
Bull. 107, 1–11. doi:10.1016/j.marpolbul.2016.04.007
Goñi, R., Hilborn, R., D i az, D., Mallol, S., Adlerstein, S., 2010. Net contribution of
spillover from a marine reserve to fishery catches. Mar. Ecol. Prog. Ser. 400, 233–243.
doi:10.3354/meps08419
Guarderas, A.P., Hacker, S.D., Lubchenco, J., 2008. Current Status of Marine Protected
Areas in Latin America and the Caribbean. Conserv. Biol. 22, 1630–1640.
doi:10.1111/j.1523-1739.2008.01023.x
Guerrero, A.M., McAllister, R.R.J., Corcoran, J., Wilson, K.A., 2013. Scale Mismatches,
Conservation Planning, and the Value of Social-Network Analyses. Conserv. Biol. 27,
35–44. doi:10.1111/j.1523-1739.2012.01964.x
Guidetti, P., Baiata, P., Ballesteros, E., Di Franco, A., Hereu, B., Macpherson, E., Micheli, F.,
Pais, A., Panzalis, P., Rosenberg, A.A., Zabala, M., Sala, E., 2014. Large-Scale
Assessment of Mediterranean Marine Protected Areas Effects on Fish Assemblages.
PLOS ONE 9, e91841–14. doi:10.1371/journal.pone.0091841
Guidetti, P., Milazzo, M., Bussotti, S., Molinari, A., Murenu, M., Pais, A., Spanò, N.,
Balzano, R., Agardy, T., Boero, F., Carrada, G., Cattaneo-Vietti, R., Cau, A., Chemello,
R., Greco, S., Manganaro, A., Notarbartolo di Sciara, G., Russo, G.F., Tunesi, L., 2008.
Italian marine reserve effectiveness: Does enforcement matter? Biol. Conserv. 141, 699–
709. doi:10.1016/j.biocon.2007.12.013
13
Halpern, B.S., Frazier, M., Potapenko, J., Casey, K.S., Koenig, K., Longo, C., Lowndes, J.S.,
Rockwood, R.C., Selig, E.R., Selkoe, K.A., Walbridge, S., 2015. Spatial and temporal
changes in cumulative human impacts on the world’s ocean. Nat. Commun. 6, 7615.
doi:10.1038/ncomms8615
Halpern, B.S., Walbridge, S., Selkoe, K.A., Kappel, C.V., Micheli, F., D'Agrosa, C., Bruno,
J.F., Casey, K.S., Ebert, C., Fox, H.E., Fujita, R., Heinemann, D., Lenihan, H.S., Madin,
E.M.P., Perry, M.T., Selig, E.R., Spalding, M., Steneck, R., Watson, R., 2008. A Global
Map of Human Impact on Marine Ecosystems. Science 319, 948–952.
doi:10.1126/science.1149345
Hargreaves-Allen, V., Mourato, S., Milner-Gulland, E.J., 2011. A Global Evaluation of Coral
Reef Management Performance: Are MPAs Producing Conservation and
Socio-Economic Improvements? Environ. Manage. 47, 684–700.
doi:10.1007/s00267-011-9616-5
Hargreaves-Allen, V.A., Mourato, S., Milner-Gulland, E.J., 2017. Drivers of coral reef
marine protected area performance. PLOS ONE 12, e0179394–21.
doi:10.1371/journal.pone.0179394
Hockings, M., Stolton, S., Dudley, N., 2004. Management Effectiveness: Assessing
Management of Protected Areas? J. Environ. Policy Plan. 6, 157–174.
doi:10.1080/1523908042000320731
Horta e Costa, B., Claudet, J., Franco, G., Erzini, K., Caro, A., Gonçalves, E.J., 2016. A
regulation-based classification system for Marine Protected Areas (MPAs). Mar. Policy
72, 192–198. doi:10.1016/j.marpol.2016.06.021
Jameson, S.C., Tupper, M.H., Ridley, J.M., 2002. The three screen doors: can marine
“protected” areas be effective? Mar. Poll. Bull. 44, 1177–1183.
doi:10.1016/S0025-326X(02)00258-8
Kearney, R., Buxton, C.D., Farebrother, G., 2012. Australia’s no-take marine protected areas
Appropriate conservation or inappropriate management of fishing? Mar. Policy 36,
1064–1071. doi:10.1016/j.marpol.2012.02.024
Keller, B.D., Gleason, D.F., McLeod, E., Woodley, C.M., Airame, S., Causey, B.D.,
Friedlander, A.M., Grober-Dunsmore, R., Johnson, J.E., Miller, S.L., Steneck, R.S.,
2009. Climate change, coral reef ecosystems, and management options for marine
protected areas. Environ. Manage. 44, 1069–1088. doi:10.1007/s00267-009-9346-0
Kellner, J.B., Tetreault, I., Gaines, S.D., Nisbet, R.M., 2007. Fishing the line near marine
reserves in single and multispecies fisheries, Ecol. Appl.. doi:10.1890/05-1845
Leisher, C., Van Beukering, P., Scherl, L.M., 2007. Nature’s Investment Bank: How Marine
Protected Areas Contribute to Poverty Reduction. Arlington, USA: The Nature
Conservancy
Levin, N., Coll, M., Fraschetti, S., Gal, G., Giakoumi, S., Göke, C., Heymans, J.J.,
Katsanevakis, S., Mazor, T., Öztürk, B., Rilov, G., Gajewski, J., Steenbeek, J., Kark, S.,
2014. Biodiversity data requirements for systematic conservation planning in the
Mediterranean Sea. Mar. Ecol. Prog. Ser. 508, 261–281. doi:10.3354/meps10857
Lubchenco, J., Grorud-Colvert, K., 2015. Making waves: The science and politics of ocean
protection. Science 350, 382–383. doi:10.1126/science.aad5443
Lubchenco, J., Palumbi, S.R., Gaines, S.D., Andelman, S., 2003. Plugging a hole in the
ocean: the emerging science of marine reserves. Ecol. Appl. 13, 3–7.
doi:10.1890/1051-0761(2003)013[0003:PAHITO]2.0.CO;2
Micheli, F., Halpern, B.S., Walbridge, S., Ciriaco, S., Ferretti, F., Fraschetti, S., Lewison, R.,
Nykjaer, L., Rosenberg, A.A., 2013. Cumulative Human Impacts on Mediterranean and
Black Sea Marine Ecosystems: Assessing Current Pressures and Opportunities. PLOS
ONE 8, e79889. doi:10.1371/journal.pone.0079889
14
Mills, M., Pressey, R.L., Weeks, R., Foale, S., Ban, N.C., 2010. A mismatch of scales:
challenges in planning for implementation of marine protected areas in the Coral
Triangle. Conserv. Lett. 3, 291–303. doi:10.1111/j.1755-263X.2010.00134.x
Mora, C., Andrèfouët, S., Costello, M.J., Kranenburg, C., Rollo, A., Veron, J., Gaston, K.J.,
Myers, R.A., 2006. Coral reefs and the global network of Marine Protected Areas.
Science 312, 1750–1751. doi:10.1126/science.1125295
Olsen, E.M., Fonseca, L., Goni, R., Johnson, D., Katsanevakis, S., Macpherson, E., Pelletier,
D., Rabaut, M., Chantal-Ribeiro, M., Weaver, P., Zaharia, T., 2013. Achieving
Ecologically Coherent MPA Networks in Europe: Science Needs and Priorities.
European Marine Board Position Paper 18. Larkin, K.E, and McDonough, N. (Eds.).
European Marine Board, Ostend, Belgium
Parravicini, V., Micheli, F., Montefalcone, M., Morri, C., Villa, E., Castellano, M., Povero,
P., Bianchi, C.N., 2013. Conserving biodiversity in a human-dominated world:
degradation of marine sessile communities within a protected area with conflicting
human uses. PLOS ONE 8, e75767. doi:10.1371/journal.pone.0075767
Partelow, S., Wehrden, von, H., Horn, O., 2015. Pollution exposure on marine protected
areas: A global assessment. Mar. Poll. Bull. 100, 352–358.
doi:10.1016/j.marpolbul.2015.08.026
Pascual, M., Rossetto, M., Ojea, E., Milchakova, N., Giakoumi, S., Kark, S., Korolesova, D.,
Melià, P., 2016. Socioeconomic impacts of marine protected areas in the Mediterranean
and Black Seas. Ocean Coast. Manage. 133, 1–10. doi:10.1016/j.ocecoaman.2016.09.001
Pomeroy, R.S., Watson, L.M., Parks, J.E., Cid, G.A., 2005. How is your MPA doing? A
methodology for evaluating the management effectiveness of marine protected areas.
Ocean Coast. Manage. 48, 485–502. doi:10.1016/j.ocecoaman.2005.05.004
Portman, M.E., Nathan, D., 2015. Conservation “identity” and marine protected areas
management: A Mediterranean case study. J. Nat. Conserv. 24, 109–116.
doi:10.1016/j.jnc.2014.10.001
Portman, M.E., Nathan, D., Levin, N., 2012. From the Levant to Gibraltar: A Regional
Perspective for Marine Conservation in the Mediterranean Sea. Ambio 41, 670–681.
doi:10.1007/s13280-012-0298-x
QGIS Development Team, 2015. QGIS Geographic Information System. Open Source
Geospatial Foundation. https://qgis.osgeo.orh
R Core Team, 2016. R: A language and environment for statistical computing. Foundation
for Statistical Computing, Vienna, Austria
Roberts, C.M., Hawkins, J.P., Gell, F.R., 2005. The role of marine reserves in achieving
sustainable fisheries. Philos. Trans. R. Soc. Lond., B, Biol. Sci. 360, 123–132.
doi:10.1098/rstb.2004.1578
Rodríguez-Rodríguez, D., Sánchez-Espinosa, A., Schröder, C., Abdul Malak, D., Rodríguez,
J., 2015. Cumulative pressures and low protection: a concerning blend for Mediterranean
MPAs. Mar. Poll. Bull. 101, 288–295. doi:10.1016/j.marpolbul.2015.09.039
Sala, E., Ballesteros, E., Dendrinos, P., Di Franco, A., Ferretti, F., Foley, D., Fraschetti, S.,
Friedlander, A., Garrabou, J., Güçlüsoy, H., Guidetti, P., Halpern, B.S., Hereu, B.,
Karamanlidis, A.A., Kizilkaya, Z., Macpherson, E., Mangialajo, L., Mariani, S., Micheli,
F., Pais, A., Riser, K., Rosenberg, A.A., Sales, M., Selkoe, K.A., Starr, R., Tomas, F.,
Zabala, M., 2012. The Structure of Mediterranean Rocky Reef Ecosystems across
Environmental and Human Gradients, and Conservation Implications. PLOS ONE 7,
e32742–13. doi:10.1371/journal.pone.0032742
Scianna, C., Niccolini, F., Gaines, S.D., Guidetti, P., 2015. Organization Science': A new
prospective to assess marine protected areas effectiveness. Ocean Coast. Manage. 116,
443–448. doi:10.1016/j.ocecoaman.2015.09.005
15
Spalding, M., Burke, L., Wood, S.A., Ashpole, J., Hutchison, J., zu Ermgassen, P., 2017.
Mapping the global value and distribution of coral reef tourism. Mar. Policy 82, 104–
113. doi:10.1016/j.marpol.2017.05.014
Stelzenmüller, V., Maynou, F., Mart i n, P., 2007. Spatial assessment of benefits of a coastal
Mediterranean Marine Protected Area. Biol. Conserv. 136, 571–583.
doi:10.1016/j.biocon.2007.01.002
Stobart, B., Warwick, R., González, C., Mallol, S., Díaz, D., Reñones, O., Goni, R., 2009.
Long-term and spillover effects of a marine protected area on an exploited fish
community. Mar. Ecol. Prog. Ser. 384, 47–60. doi:10.3354/meps08007
Thurstan, R.H., Hawkins, J.P., Neves, L., Roberts, C.M., 2012. Are marine reserves and
non-consumptive activities compatible? A global analysis of marine reserve regulations. Mar.
Policy 36, 1096–1104. doi:10.1016/j.marpol.2012.03.006
Tables
Table 1. Local threats that can affect marine protected area (MPA) effectiveness and that can
be managed by the MPA regulations. Indicators were chosen considering trade-offs between
reliability and data availability. Weights reflect the potential impact of a given activity on both
species and habitats and were rescaled after Horta e Costa et al. (2016)
Threat Threat Indicator Scaled weight
Extractive threats
Recreational fishing: hook and line Number of people (nb/year) 0.56
Recreational fishing: spearfishing Number of people (nb/year) 0.33
Artisanal fishing:
Professional fishing except trawlers/purse-seiners Number of boats (nb/year) 0.82
Commercial fishing:
Professional fishing trawlers/purse-seiners Number of boats (nb/year) 1 Non-extractive threats
Tourism: bathing/trampling Number of people (nb/year) 0.11
Tourism: scuba-diving Number of dives (nb/year) 0.11
Tourism: private boating Number of private boats (nb/year) 0.22
Tourism: commercial boating Number of commercial touristic boats
16
Figures
Fig. 1. The framework to assess how good are marine protected areas (MPAs) at curbing
threats.
Artisanal fishing Recreational fishing: hook and line Recreational fishing: spearfishing Trawlers & purse-seiners Others Bathing, trampling Commercial boating Private boating Scuba diving Others Extractive
threats extractiveNon
threats
Step 1. Identify threats
Step 2. Quantify threats inside and outside the MPA
Step 3. Calculate indices
Threat intensity TI ThreatReduction Capacity TRC ZoneThreat Reduction ZTR MPAThreat Reduction MTR
Step 4. Management implications
Study spatial distribution of threats Threat evolution over time
Priorization of management actions Compare zones and MPAs
Evaluate the performance of MPAs
and more.
How good is your MPA at curbing threats?
10km radius outside area
Coastal outside area
MPA - Marine Protected Area FPA - Fully Protected Area PPA - Partially Protected Area
MPA
FPA PPA
What is each threat intensity in each zone and inside the MPA overall?
Is the threat beeing reduced
17
Fig. 2. Mean threat intensities (
± SE) across fully protected, partially protected and outside
zones of 15 marine protected areas.
18
Fig. 3. Mean threat reduction capacity (
± SE) for each threat across zones of different
protection levels. The last bar of each panel represents the zone threat reduction score (zT).
Negative values of the threat reduction capacity indicate that the threat is reduced in the marine
protected area (MPA) relative to the outside, while positive values indicate that threats are
higher inside the MPA relative to the outside.
19
Fig. 4. Threat reduction score of marine protected areas (MPAs) for all threats combined (top
panel), extractive (bottom left panel) and non-extractive threats (bottom right panel). Negative
values of the threat reduction score indicate that threats are being effectively reduced within an
MPA relative to the outside, while positive threat reduction score values indicate that the MPA
is not effective at reducing threats compared to the outside.
20
Fig. 5. Level of confidence (low, medium and high) associated to threat values corresponding
to the fully protected zones, partially protected zones and the outside areas of the marine
protected areas.
21
Fig. 6. Confidence levels (low, medium and high) associated to threat values for each threat.
22
Appendix A
Database of marine protected areas used in the present study
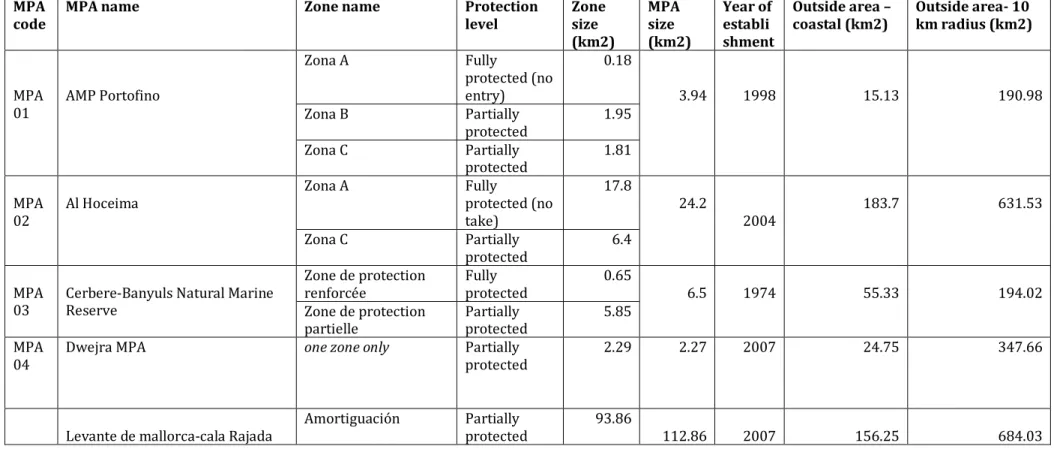
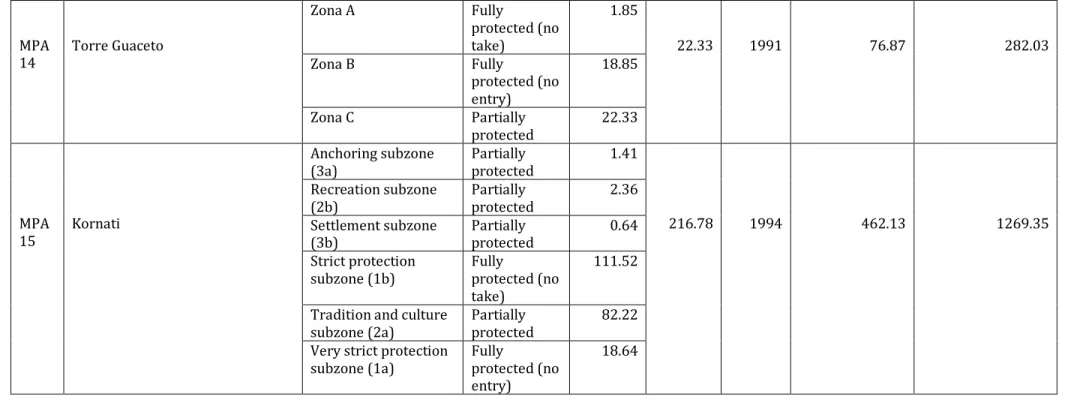
Table A.1: The characteristics of each of the marine protected areas (MPAs) included in this study. Zone name represents the official name
on the basis of the establishment decree. Zones were classified according to the level of protection: fully protected zones (no-entry and
no-take areas) and partially protected zones. The size of each zone within the MPA was obtained from managers and/or management
plans, whilst the outside surface areas were calculated using QGIS 2.8/1 (QGIS Development Team, 2015). Commercial fisheries using
trawlers and purse seiners were assessed in a 10km radius outside area whereas recreational and artisanal fishing and tourism were
assessed in the coastal outside area.
MPAcode MPA name Zone name Protection level Zone size (km2) MPA size (km2) Year of establi shment Outside area –
coastal (km2) Outside area- 10 km radius (km2) MPA 01 AMP Portofino Zona A Fully protected (no entry) 0.18 3.94 1998 15.13 190.98 Zona B Partially protected 1.95 Zona C Partially protected 1.81 MPA 02 Al Hoceima Zona A Fully protected (no take) 17.8 24.2 2004 183.7 631.53 Zona C Partially protected 6.4 MPA 03 Cerbere-Banyuls Natural Marine Reserve Zone de protection
renforcée Fully protected 0.65 6.5 1974 55.33 194.02 Zone de protection
partielle Partially protected 5.85 MPA 04 Dwejra MPA one zone only Partially protected 2.29 2.27 2007 24.75 347.66
23
MPA 05 Integral Fully protected (no take) 19 MPA 06 Masia BlancaBuffer Fully protected (no
take) 2.07 2.50 1999 36.43 196.48 Integral Fully protected (no take) 0.43 MPA 07 NP Brijuni Zone A Fully protected (no take) 31.24 34.01 1983 68.1 398.78 Zone B Partially protected 2.77 MPA 08 National rine Park of Zakynthos Peripheral zone Partially protected 31.94 83.31 1999 171.12 1050.33 Zone A Partially protected 8.01 Zone B Partially protected 35.95 Zone C Partially protected 7.40 MPA 09 Parc Natural de Cap de Creus Parc Natural
Cadaques Partially protected 9.6 30.5 1998 76.52 557.97 Parc Natural Cap de
Creus Partially protected 2.3 Parc Natural Cap Gros Partially
protected 7.1 Parc Natural Cap
Norfeu Partially protected 3.3 Reserva Natural Integral des Encalladora Fully protected (no entry) 0.02 Reserva Natural Parcial del Cap de Creus Partially protected 2.9
24
Reserva Natural
Parcial del Cap Norfeu Partially protected 2.7 Reserva Natural Parcial dels Farallons Partially protected 2.6 MPA 10 Parc Natural del Montgrí, el baix Ter i les Medes Reserva Natural Parcial de les Illes Medes Partially protected 9.4 15.19 2010 94.35 348.87 Reserva Natural Parcial de les Illes Medes Fully protected (no take) 1 Parc Natural Marí Partially protected 4.79 MPA 11 Parque Nacional marítimo terrestre del Archipiélago de Cabrera Reserva marina Fully protected (no entry) 2.12 87.05 1991 64.91 800.32 Uso especial Fully protected (no take) 0.71 Uso moderado Partially protected 77.98 Uso restringido Fully protected (no take) 0.68 Uso restringido
pesquero Partially protected 5.62 MPA 12 Porto Cesareo Zone A Fully protected (no take) 1.99 164.87 1997 307.91 407.17 Zone B Fully protected (no take) 30.21 Zone C Partially protected 132.66 MPA
25
MPA 14 Torre Guaceto Zona A Fully protected (no take) 1.85 22.33 1991 76.87 282.03 Zona B Fully protected (no entry) 18.85 Zona C Partially protected 22.33 MPA 15 Kornati Anchoring subzone(3a) Partially protected 1.41 216.78 1994 462.13 1269.35 Recreation subzone (2b) Partially protected 2.36 Settlement subzone (3b) Partially protected 0.64 Strict protection
subzone (1b) Fully protected (no take)
111.52 Tradition and culture
subzone (2a) Partially protected 82.22 Very strict protection
subzone (1a) Fully protected (no entry)
18.64
Appendix B
Raw threat data collected of marine protected areas used in the present study
Table B.1. Raw data collected for all threat indicators for each zone of all marine protected areas (MPAs) used in this study. The source of data
and confidence level associated to each threat value are also presented. Zone name represents the official name on the basis of the establishment
decree. Zones were classified according to the level of protection: fully protected zones (no-entry and no-take areas), partially protected zones
and the unprotected-outside areas. The size of each zone within the MPA was obtained from managers and/or management plans, whilst the
outside surface areas were calculated using QGIS 2.8/1 (QGIS Development Team, 2015). Commercial fisheries using trawlers and purse seiners
were assessed in a 10km radius outside area whereas recreational and artisanal fishing and tourism were assessed in the coastal outside area.
26
MPA Code Zone name
Protection level
Zone size
(km2) Threats Indicators Value Data source Confidence Details
MPA 01 Zona A No-entry 0.175 Artisanal
fishing Number of boats (nb/year) 0 data high MPA regulations MPA 01 Zona A No-entry 0.175 Recreational
fishing: hook and line
Number of
people (nb/year) 0 data high MPA regulations MPA 01 Zona A No-entry 0.175 Recreational
fishing: spearfishing
Number of people (nb/year)
0 data high MPA regulations MPA 01 Zona A No-entry 0.175 Tourism:
bathing/trampl ing
Number of
people (nb/year) 0 data high MPA regulations MPA 01 Zona A No-entry 0.175 Tourism:
commercial boating Number of commercial touristic boats (nb/year)
0 data high MPA regulations
MPA 01 Zona A No-entry 0.175 Tourism: private boating
Number of private boats (nb/year)
0 data high MPA regulations MPA 01 Zona A No-entry 0.175 Tourism:
scuba-diving Number of dives (nb/year) 0 data high MPA regulations MPA 01 Zona A No-entry 0.175 Trawlers/purse
-seiners Number of boats (nb/year) 0 data high MPA regulations MPA 01 Zona B Partially
protected 1.95 Artisanal fishing Number of boats (nb/year) 39 data high Portofino MPA data of granted licences MPA 01 Zona B Partially
protected 1.95 Recreational fishing: hook and line
Number of
people (nb/year) 400 data medium Estimated data (on the basis of resident population) MPA 01 Zona B Partially
protected 1.95 Recreational fishing: spearfishing
Number of
people (nb/year) 0 data medium MPA regulations MPA 01 Zona B Partially
protected 1.95 Tourism: bathing/trampl ing
Number of
people (nb/year) 150000 data low Cappanera et al. (2010) MPA 01 Zona B Partially
protected 1.95 Tourism: commercial boating
Number of
27
touristic boats (nb/year) MPA 01 Zona B Partially
protected 1.95 Tourism: private boating
Number of private boats (nb/year)
1924 data medium Cappanera et al. (2014): estimated data referred to 2013 season
MPA 01 Zona B Partially
protected 1.95 Tourism: scuba-diving Number of dives (nb/year) 32306 data medium Cappanera et al. (2014): estimated data referred to 2013 season
MPA 01 Zona B Partially
protected 1.95 Trawlers/purse-seiners Number of boats (nb/year) 0 data high MPA regulations MPA 01 Zona C Partially
protected 1.811 Artisanal fishing Number of boats (nb/year) 39 data high Portofino MPA data of granted licences MPA 01 Zona C Partially
protected 1.811 Recreational fishing: hook and line
Number of
people (nb/year) 349 data medium Estimated data (on the basis of resident population) MPA 01 Zona C Partially
protected 1.811 Recreational fishing: spearfishing Number of people (nb/year)
0 data high MPA regulations MPA 01 Zona C Partially
protected 1.811 Tourism: bathing/trampl ing
Number of
people (nb/year) 150000 data low Cappanera et al. (2010): estimated data referred to the period from June to September MPA 01 Zona C Partially
protected 1.811 Tourism: commercial boating
Number of commercial touristic boats (nb/year)
0 data high MPA regulations
MPA 01 Zona C Partially
protected 1.811 Tourism: private boating
Number of private boats (nb/year)
8767 data medium Cappanera et al. (2014): estimated data referred to 2013 season
MPA 01 Zona C Partially
protected 1.811 Tourism: scuba-diving Number of dives (nb/year) 2000 expert opinion low Cappanera et al. (2014): estimated data referred to 2013 season
MPA 01 Zona C Partially
protected 1.811 Trawlers/purse-seiners Number of boats (nb/year) 0 data high MPA regulations MPA 01 Outside Outside 15.13 Artisanal
fishing
Number of boats (nb/year)
159 data high Ligurian Region data, MARTE+ (Cattaneo-Vietti R. 2013)
28
MPA 01 Outside Outside 15.13 Recreational fishing: hook and line Number of people (nb/year) 800 expert opinion low Estimated MPA 01 Outside Outside 15.13 Recreational
fishing: spearfishing
Number of
people (nb/year) 100 expert opinion low Estimated MPA 01 Outside Outside 15.13 Tourism:
bathing/trampl ing Number of people (nb/year) 100000 expert opinion
low Estimated data (on the basis of the number of resident people, ISTAT 2012)
MPA 01 Outside Outside 15.13 Tourism: commercial boating Number of commercial touristic boats (nb/year)
140 data high Cappanera et al. (2014): estimated data referred to 2013 season
MPA 01 Outside Outside 15.13 Tourism: private boating Number of private boats (nb/year) 3600 expert opinion low Estimated MPA 01 Outside Outside 15.13 Tourism:
scuba-diving Number of dives (nb/year) 100 expert opinion low Estimated MPA 01 Outside Outside 190.98 Trawlers/purse
-seiners
Number of boats (nb/year)
53 data high Fleet register EC - December2013 MPA 02 Zona A No-take 17.8 Artisanal
fishing Number of boats (nb/year) 0 data medium Franzosini C. & Limam A. (2006); AGIR (2013) MPA 02 Zona A No-take 17.8 Recreational
fishing: hook and line
Number of
people (nb/year) 0 data medium Nibani H. (2010); AGIR (2013) MPA 02 Zona A No-take 17.8 Recreational
fishing: spearfishing
Number of
people (nb/year) 0 data medium Nibani H. (2010), AGIR (2013) MPA 02 Zona A No-take 17.8 Tourism:
bathing/trampl ing
Number of
people (nb/year) 0 expert opinion medium expert opinion MPA 02 Zona A No-take 17.8 Tourism:
commercial boating Number of commercial touristic boats (nb/year)
0 data low Nibani H. (2010), AGIR (2013)
MPA 02 Zona A No-take 17.8 Tourism: private boating Number of private boats (nb/year) 0 expert
29
MPA 02 Zona A No-take 17.8 Tourism: scuba-diving
Number of dives (nb/year)
100 data medium Nibani H. (2010), AGIR (2013)
MPA 02 Zona A No-take 17.8 Trawlers/purse
-seiners Number of boats (nb/year) 0 data medium Franzosini C. & Limam A. (2006), AGIR (2013) MPA 02 Zona C Partially
protected 6.4 Artisanal fishing Number of boats (nb/year) 130 data high Franzosini C. & Limam A. (2006), AGIR (2013) MPA 02 Zona C Partially
protected 6.4 Recreational fishing: hook and line
Number of
people (nb/year) 1800 data medium Franzosini C. & Limam A. (2006), AGIR (2013) MPA 02 Zona C Partially
protected 6.4 Recreational fishing: spearfishing
Number of
people (nb/year) 800 data medium Franzosini C. & Limam A. (2006), AGIR (2013) MPA 02 Zona C Partially
protected 6.4 Tourism: bathing/trampl ing
Number of
people (nb/year) 1200 expert opinion low Nibani H. (2010); AGIR (2013) MPA 02 Zona C Partially
protected 6.4 Tourism: commercial boating Number of commercial touristic boats (nb/year)
0 data high Nibani H. (2010), AGIR (2013)
MPA 02 Zona C Partially protected 6.4 Tourism: private boating Number of private boats (nb/year) 50 expert opinion
low Nibani H. (2010), AGIR (2013)
MPA 02 Zona C Partially
protected 6.4 Tourism: scuba-diving Number of dives (nb/year) 850 data medium Nibani H. (2010), AGIR (2013) MPA 02 Zona C Partially
protected 6.4 Trawlers/purse-seiners Number of boats (nb/year) 0 data high Franzosini C. & Limam A. (2006) MPA 02 Outside Outside 183.7 Artisanal
fishing Number of boats (nb/year) 416 data medium Franzosini C. & Limam A. (2006) MPA 02 Outside Outside 183.7 Recreational
fishing: hook and line Number of people (nb/year) 2250 expert opinion
low expert opinion MPA 02 Outside Outside 183.7 Recreational
fishing: spearfishing
Number of
people (nb/year) 900 expert opinion low expert opinion MPA 02 Outside Outside 183.7 Tourism:
bathing/trampl ing Number of people (nb/year) 4500 expert opinion
![[PDF] Introduction à l'emploi du logiciel DELPHI](data:image/gif;base64,R0lGODlhAQABAIAAAP///wAAACH5BAEAAAAALAAAAAABAAEAAAICRAEAOw==)