HAL Id: hal-00317694
https://hal.archives-ouvertes.fr/hal-00317694
Submitted on 3 Jun 2005
HAL is a multi-disciplinary open access
archive for the deposit and dissemination of
sci-entific research documents, whether they are
pub-lished or not. The documents may come from
teaching and research institutions in France or
abroad, or from public or private research centers.
L’archive ouverte pluridisciplinaire HAL, est
destinée au dépôt et à la diffusion de documents
scientifiques de niveau recherche, publiés ou non,
émanant des établissements d’enseignement et de
recherche français ou étrangers, des laboratoires
publics ou privés.
Spatial and temporal variations of small-scale plasma
turbulence parameters in the equatorial electrojet: HF
and VHF radar observational results
G. Manju, K. S. Viswanathan, S. Ravindran
To cite this version:
G. Manju, K. S. Viswanathan, S. Ravindran. Spatial and temporal variations of small-scale plasma
turbulence parameters in the equatorial electrojet: HF and VHF radar observational results. Annales
Geophysicae, European Geosciences Union, 2005, 23 (4), pp.1165-1173. �hal-00317694�
SRef-ID: 1432-0576/ag/2005-23-1165 © European Geosciences Union 2005
Annales
Geophysicae
Spatial and temporal variations of small-scale plasma turbulence
parameters in the equatorial electrojet: HF and VHF radar
observational results
G. Manju, K. S. Viswanathan, and S. Ravindran
Space Physics Laboratory, Vikram Sarabhai Space Centre, Trivandrum - 695 022, Kerala, India
Received: 14 June 2004 – Revised: 4 March 2005 – Accepted: 14 March 2005 – Published: 3 June 2005
Abstract. The spatial and temporal variations of various
parameters associated with plasma wave turbulence in the equatorial electrojet (EEJ) at the magnetic equatorial loca-tion of Trivandrum (8.5◦N, 77◦E; dip 0.5◦N) are studied for the first time, using co-located HF (18 MHz) and VHF (54.95 MHz) coherent backscatter radar observations (day-time) in the altitude region of 95–110 km, mostly on magnet-ically quiet days. The derived turbulence parameters are the mean electron density irregularity strength (δn/n), anomalous electron collision frequency (νe*) and the corrected east-west
electron drift velocity (Vey). The validity of the derived
pa-rameters is confirmed using radar data at two different fre-quencies and comparing with in-situ measurements. The be-haviour of δ n/n in relation to the backscattered power during weak and strong EEJ conditions is also examined to under-stand the growth and evolution of turbulence in the electrojet.
Keywords. Ionosphere (Equatorial ionosphere; Ionospheric
irregularities) – Space plasma physics (Turbulence)
1 Introduction
The field-aligned ionisation irregularities, namely, the type I and type II irregularities, that are generated by the plasma in-stabilities in the equatorial electrojet region, have been stud-ied extensively during the past several years using coherent HF and VHF radars (Fejer and Kelley, 1980 and references therein). These (type I and type II irregularities) are gener-ated by the action of the two-stream and gradient drift in-stability mechanisms, respectively. The type I irregularities are characterized by phase velocities nearly equal to the ion-acoustic velocity (Cs)of the medium and appear more or less
simultaneously at all radar elevation angles when the thresh-old condition is exceeded. For type I waves the observed phase velocity is independent of the zenith angle and for type
Correspondence to: G. Manju
(manju spl@vssc.org)
II waves, it shows a cosine θ dependence (where θ is the el-evation angle). Type II irregularities have phase velocities proportional to the electron drift velocity and are observed even for very small electron drifts, whenever the electron density gradient and the electric field are in the same direc-tion.
The characteristic features of the type I and type II irreg-ularities present in the equatorial electrojet (EEJ) are being increasingly understood, due to several theories, both lin-ear and nonlinlin-ear, which have been developed, taking into account the effect of plasma wave turbulence (e.g. Sudan, 1983a,b; Farley, 1985; Kudeki et al., 1987). The dominant role of large-scale waves in determining the altitude struc-ture and dynamics of the EEJ was confirmed by the radar interferometry technique (Farley et al., 1981) and later by a combination of ground-based and in-situ measurements (Pfaff et al., 1987). Ronchi et al. (1990, 1991) carried out theoretical investigations on the modifications of large-scale electrojet structure by small-scale plasma wave turbulence. Sudha Ravindran and Reddy (1993) investigated the effect of plasma turbulence on the phase velocity of type I waves from VHF backscatter radar observations.
The high spatial resolution observations of the EEJ at Jica-marca by Farley et al. (1994) have revealed wave-like struc-tures, which are in agreement with the theoretical investiga-tions of Ronchi et al. (1990). The latter included background short wavelength turbulence in the long wavelength equa-tions through a turbulent collision frequency operator and studied its effects on the large-scale dynamics of the EEJ. By this, they could explain the discrepancy between the al-titude of the maximum of the experimental and theoretical EEJ current density profiles.
In another approach, Krishna Murthy and Sudha Ravin-dran (1994) studied experimentally the effect of plasma wave turbulence mainly on the altitude structure of the EEJ, based on limited VHF radar observations at Trivandrum. But the time evolution of the turbulence parameters, their variation in relation to the signal strength; etc have not been exam-ined in their study. In the present study, the parameters
1166 G. Manju et al.: Spatial and temporal variations of small-scale plasma turbulence parameters
Table 1. Experimental specifications of VHF and HF radar systems at Trivandrum.
Parameter VHF HF
Operating frequency (MHz) 54.95 18
Pulse width (µs) 20 20
Pulse repetition frequency (s−1) 500 250
Peak power (kW) 20 50
Average power-aperture product (Wm2) 2.2×10⁵ 1.25×10⁷
Beam direction Fixed beam 30◦ 3 beam orientations zenith, 30◦ off zenith towards west off zenith towards west and east Half power two-way beamwidth (E-W) ∼3.5◦ ∼5◦
δn/n, νe∗/νe and Vey (corrected to include turbulence) have
been estimated mainly for quiet days at different times, and the time evolution of these parameters has also been stud-ied. These temporal variations are examined in association with the backscatter signal power and 1H variations (devi-ations of the horizontal component of the Earth’s magnetic field from the nighttime level). The behaviour of δn/n at dif-ferent altitudes in the EEJ, in relation to the backscattered power during weak and strong EEJ conditions is presented in detail. In addition, the turbulence parameters have been esti-mated, using both HF and VHF radar observations at several altitudes in the EEJ, for the first time, at Trivandrum on the magnetic equator.
2 Experimental setup
The VHF and HF radars at Trivandrum are pulsed, monos-tatic, coherent, Doppler systems operating in the backscatter mode. The scattered wave vector follows the condition for Bragg scatter, given as
λ =2λirrsin(θ/2), (1)
where λ is the radar wavelength, λirris the irregularity scale
size and θ is the scattering angle. For backscattering θ =180◦;
hence,
λirr =λ/2. (2)
These radar systems (used in this study) operate at 54.95 and 18 MHz, respectively, corresponding to irregularity scale sizes of 2.7 and 8.3 m for backscattering. Detailed speci-fications, data recording and analysis procedures for VHF backscatter radar have been described in Reddy et al. (1987). The mode of data acquisition and analysis procedure is given in Manju (1997) and Janardhanan et al. (2001). The system details for both the radars are given in Table 1. The parame-ters estimated from the radar Doppler spectra are the power (zeroth moment), mean Doppler frequency, f
D
(first moment) and the width of the spectrum (second moment). The power is a measure of the strength of the scattering centres present in the volume illuminated by the radar antenna beam; the mean Doppler frequency gives the mean drift velocity of the
irregularities and the width of the spectrum is a gross indica-tor of the strength of turbulence.
HF radar employs the Doppler beam swinging (DBS) tech-nique to point the antenna beam at three angles, viz., vertical and 30◦ off zenith in the east and west directions. A sin-gle 12×6 antenna array (12 in the magnetic east-west and 6 in the magnetic north-south direction) is employed for both transmission and reception. A centre-fed dipole of full wave-length is used as the antenna element. The entire array is con-figured in such a manner that there are six sub arrays and the beam positions at three angles are obtained by proper phas-ing of these sub arrays. For the present study, data recorded in the west beam position only are used, since the VHF radar beam is along the west at zenith angle 30◦.
3 Data and method of analysis
The present study is carried out using a database obtained partly using VHF radar observations and partly using simul-taneous HF and VHF radar observations during daytime only. Both the radars point towards west and hence they measure in the same volume at the same time (for simultaneous obser-vations using the two radars). Section 4.1 presents the results for those days when VHF radar data sets alone are available. These data sets are obtained at 5-min intervals and six data sets are averaged for each half hour to estimate the turbulence parameters (Krishna Murthy and Ravindran, 1994). For the comparative study using both HF and VHF radar data, pre-sented in Sect. 4.2, thirty data sets at one-minute intervals are averaged for each half hour. The averaging is carried out to minimize the effects of winds in the EEJ region with peri-ods less than 25 min on the deduced altitude structure of the electrojet.
The radar spectral data used for the present study have been selected so that they are purely type II (uncontami-nated by type I). This assures the reliability of electron drift velocity and the electric field derived from the irregularity drift velocity (Viswanathan et al., 1987). This is due to the fact that the phase velocity of type II irregularities is di-rectly related to the electron drift velocity and hence to the driving electric field, whereas the phase velocity of type I waves becomes saturated to the ion-acoustic velocity (Cs)
irrespective of the electric field magnitude. Since the gen-eration of type I waves at higher scale sizes is less proba-ble, the HF radar observations are generally free from type I contamination. With the VHF radar observations, significant contribution from type I irregularity is mostly present close to noontime (Viswanathan et al., 1987) in the altitude range of 101–112 km.
The method of estimation of turbulence parameters used here involves the matching of the experimental and theoret-ical drift velocity profiles of the EEJ by including the tur-bulence contribution in the drift velocity equations, thereby removing the discrepancy between the altitude of maximum of the two profiles (Krishna Murthy and Ravindran, 1994). The radar signal is required to be present at six or more al-titudes without type I contamination, for the estimation of turbulence parameters using this method. This method is evolved based on the theoretical work presented by Ronchi et al. (1990), who suggested that the main features of the large-scale observations and the dynamics of EEJ can be success-fully explained when the additional electron mobility and diffusion due to background short wavelength plasma tur-bulence are also considered. The electric fields of the large amplitude short-scale waves perturb the electron orbits ran-domly, thus causing anomalous diffusion of electrons across the magnetic field. This anomalous electron diffusion is in-terpreted mathematically as an additional anomalous elec-tron collision frequency (νe∗)over and above the normal col-lision frequency (νe). In the above theory the inclusion of a
turbulent mobility operator in the equilibrium equation acts as an enhanced collision frequency (νe∗). The Pedersen and Hall mobilities of electrons,µP eand µH e, respectively, are
given as
µP e=qeνe/me(2e+νe2) (3)
µH e=qee/me(2e+ν
2
e), (4)
where, qeand meare the electronic charge and mass,
respec-tively, eis the electron gyrofrequency and νeis the collision
frequency of electrons with neutrals.
According to the non-linear short scale turbulence theory of Ronchi et al. (1990), the expressions for the turbulent Ped-ersen (µ∗P e)and Hall (µ∗H e)mobility parameters are given as µ∗P e=1/2(9/1 + 9)(µH e/µP e)2 δn(h) n 2 µP e (5) µ∗H e=1/2(9/1 + 9) δn(h) n 2 µH e, (6) where 9 = νiνe/ ie, (7)
where i is the ion gyrofrequency and νiis the collision
fre-quency of ions with neutrals. δn(h)n
are the small-scale electron density irregularity strength which is altitude depen-dent. δ n(h) are the fluctuations in electron density for small-scales less than 100 m as a function of altitude h, and n is the
large-scale electron density. The brackets indicate that the mean of the quantity for a range of shorter scale sizes less than 100 m is considered.
For a typical value of δn(h)/n (∼10%) (Pfaff et al., 1987), it is seen that µ∗H e µH e and µ∗P e≥µP e. Therefore, µ∗P e
is the turbulent mobility parameter of interest in the present study.
Vey, the experimentally observed electron drift velocity in
the E-W direction, is given by (Reddy et al., 1987):
Vey =Vp(1 + 9), (8)
where Vp is the phase velocity of type II irregularities in the
E-W direction. V p =λ.f D =5.4f D (Reddy et al., 1987), (9) where f D
is the mean Doppler frequency and λ is the radar wavelength.
The expression for the theoretical electron drift velocity (Vey)T (Reddy et al ., 1987) is given by
(Vey)T =[ρi/(1 + 9)][Ey/B], (10)
where Eyis the global E-W electric field and B is the
geo-magnetic field.
ρi =(νi/ i) (11)
Here the estimation of turbulence parameters is based on the assumption that the discrepancy between the observed and theoretical electron drift velocity profiles in the EEJ, is due to the non-inclusion of the effect of plasma wave turbulence, in the respective equations (for details, refer to Krishna Murthy and Ravindran, 1994). This is taken care of by including height dependent 9* in the equations for Veyand (Vey)T and
equating them. Vey =Vp(1 + 9 + 9∗) (12) (Vey)T = [ρi/(1 + 9 + 9∗)](Ey/B). (13) From Eq. (5), (ν∗e/νe) ∼ µ∗P e/µP e=1/2(9/1 + 9)(µH e/µP e)2 δn(h) n 2 (14) where δn(h)n 2
is assumed to be a second degree polyno-mial in height of the form a+bh+ch2, h is the altitude and a, b, c are constants to be determined.
(ν∗e/νe) ∼ µ∗P e/µP e=(9 ∗
/9) =1/2(9/1 + 9)
(µH e/µP e)2(a + bh + ch2) (15)
1168 G. Manju et al.: Spatial and temporal variations of small-scale plasma turbulence parameters
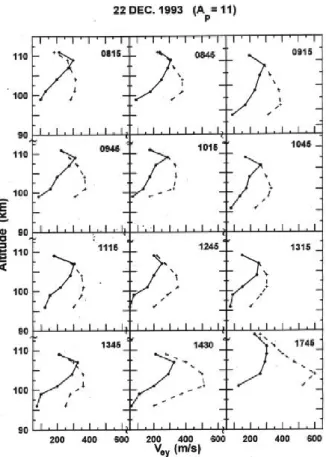
Fig. 1. Daytime altitude profiles of Veyon 22 December 1993. The
solid curves correspond to the uncorrected Vey values (without
in-cluding turbulence effects), while the dashed curves represent the corrected Vey values obtained after including the effects of
turbu-lence.
where,
A =1/2[92/(1 + 9)](µH e/µP e)2, (17)
A is calculated at different heights using values obtained from MSIS 86 (Hedin, 1987) model for neutral densities and temperatures.
Equating (12) and (13) and substituting for 9* results in Vp=ρi/[1 + 9 + A(a + bh + ch2)]2[Ey/B]. (18)
Taking the ratio of Vp(at 2 altitudes) for 3 sets of data at six
altitudes, Eyis eliminated and the equations are solved to
ob-tain the values of a, b and c. Thereafter, the values of Ey, Vey
(with turbulence parameter 9*), ν∗
eand δn/n are estimated.
The spatial and temporal variations of the parameters such as Vey (including 9*) and δn/n (obtained using the above
method) are presented in Sect. 4. The behaviour of δn/n viz-a-viz the backscattered power is also investigated.
4 Results
The data used in the present study are relatively free from contamination by type I irregularities, in view of the fact that winter and summer months have been selected. It should be
mentioned here that based on our experience with VHF radar observations, it is known that for low solar activity conditions during winter and summer months, the type I contamination is at a minimum (for details, refer to Vikramkumar et al., 1984). The days selected are relatively magnetically quiet (as is evidenced by the geo-magnetic indices), except for 21 December 1993 (Ap=20), which is somewhat disturbed.
On 21 December 1993, type I contamination is present in the Doppler spectrum between 09:15 and 10:45 IST (Indian Standard Time corresponding to 82.5◦E longitude leads UT by 5.5 h). All times given here correspond to IST. On 15 June 1995 (Ap=6) data are available during 08:30–16:30,
with type I contamination from 10:00–12:00. Hence, turbu-lence parameters are not estimated during the 10:00–12:00 period. The results presented for 22 December 1993 and 15 June 1995 are obtained using VHF radar observations while those presented for 25 and 26 October, 1995 (equinoctial pe-riod) are based on simultaneous HF radar and VHF radar ob-servations.
4.1 Altitude profiles of Vey and δ n/n in the EEJ – VHF
radar observations
As an example, Fig. 1 shows Vey profiles for the daytime
on 22 December 1993 (Ap=11), which is a relatively
mag-netically quiet day without type I presence, even at higher altitudes. Hence, data were available at the required six alti-tudes for estimating turbulence parameters reasonably well. As mentioned earlier, the profiles shown here are the average profiles obtained mostly at each half hour. The solid curves correspond to the deduced Vey profiles without turbulence
effects, while the dashed curves correspond to the corrected Veyprofiles obtained after including the effects of turbulence.
The time in hours corresponding to each panel is given at the top.
It is seen from Fig.1 that in all cases the altitude of the maximum of the corrected profile is lower than the deduced profile (without turbulence effects). Also, it should be men-tioned that the theoretical Vey profile (without considering
the effect of turbulence) peaks around 97 km (not shown in the figure) (Richmond 1973a,b), which is lower than the cor-rected profile. Thus, the effect of including νe* is to shift
the peak of the theoretical profile to a higher level. As can be seen, the magnitudes of the corrected Veyare larger than
the deduced values (without turbulence effects), especially below and around the altitude of maximum Vey. This is due
to the inclusion of 9* for the corrected profile. However, the Veyvalues (including turbulence) are larger mostly in the
late afternoon hours in comparison with those in the pre-noon hours, indicating an increase in turbulence strength from pre-noon to afterpre-noon.
The altitude profiles of δn/n obtained, which is directly related to 9*, refer to Eq. (16), corresponding to these times are shown in Fig. 2. The value is less than 6% up to 13:45 but later increases to ∼10%. It is seen that on occasions, it spans a very narrow range and at other times it shows marked altitude variations. Figure 3 shows the altitude profiles of Vey
Fig. 2. Deduced altitude profiles of δn/n corresponding to the times shown in Fig. 1.
(deduced without 9* and corrected with 9*) and δn/n in the left and right panels, respectively, for the pre-noon, close to noon and afternoon times, of 15 June 1995. In Fig. 3, the Vey profiles exhibit similar behaviour as in Fig. 1. The δn/n
values are found to lie in the range of 2–6% for the pre-noon and noon times with higher values at 15:45. This pattern of variation in δn/n is seen for all the days examined. There is a consistent increase in δn/n in all cases during the late afternoon hours.
4.2 Comparison of turbulence parameters estimated from HF and VHF radar observations
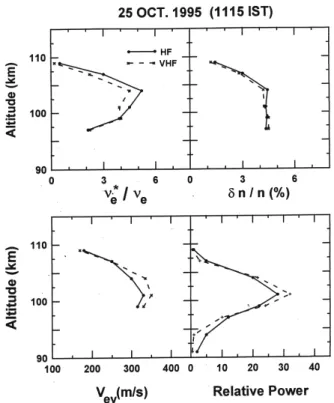
We have operated the HF and VHF radars simultaneously on a number of days and compared the turbulence parameters estimated from the two sets of observations. Figure 4 shows the altitude profiles of ν∗
e/νe, δn/n, Vey and relative power
at 11:15 on 25 October 1995. The solid line corresponds to the parameters estimated from the HF radar observations and the broken line to those from VHF radar observations. It is seen that there is a good agreement between the values estimated from the two radars, though VHF radar is sensitive to 2.7-m scale size irregularities while HF radar returns are from 8.3-m scale size irregularities. The δn/n values are in the range of 2–4%. The δn/n values are nearly the same for the two radars, although the scale sizes probed are different.
Fig. 3. Uncorrected (solid) and corrected (dashed) altitude profiles of Veyand δn/n for the pre-noon, close to noon and afternoon on 15
June 1995.
The relative power and Veyare seen to peak at 101 km in both
cases, though the magnitudes differ slightly.
4.3 Time variation of different turbulence parameters – VHF and HF radar observations
First we present the observations for 22 December 1993 and 15 June 1995, based on VHF radar observations. Figure 5 shows the time variation of corrected Vey, relative power,
δn/n (at 104 km, close to the peak altitude of EEJ) and 1H at Trivandrum for 22 December 1993 from 08:00–18:00. The relative power is obtained from the backscatter signal power of the Doppler spectrum for a given range bin. It is seen from the figure that Vey and the relative power show an increase
from ∼14:00 and reach their maxima around 16:00. Corre-spondingly the δn/n values also increase from 3–6% and con-tinue to increase beyond 16:00. A similar pattern is obtained at other altitudes, too. The 1H values at Trivandrum, shown in the top panel, also reveal a significant increase during this period and thereafter a decrease to near zero by 18:00. The increase in 1H around 16:00 is in contrast to the typical 1H variations observed on a quiet day, where the peak value is attained close to noon.
The temporal variations of the estimated east-west elec-tric field Ey (taking into consideration νe∗)on this day are
1170 G. Manju et al.: Spatial and temporal variations of small-scale plasma turbulence parameters
Fig. 4. Altitude profiles of νe∗/νe, δn/n, corrected Vey and relative
power (in arbitrary units) corresponding to 11:15 on 25 October 1995, from HF and VHF radar observations.
and 16:00, attaining a peak value of ∼2.6 mV/m at 16:00. The height integrated Cowling conductivity 63generally
de-creases during the afternoon hours. It is known that 1H is a function of 63and Ey,and hence the observed increase in
1H may quite reasonably be attributed to the large magni-tude of Ey. Another important aspect is that after 16:00, Vey,
relative power and 1H values decrease, while δn/n continues to increase to a value of ∼8% at 18:00.
The time variations of these parameters at 99 km for the same day are shown in Fig. 7. It is seen that in the post-noon period, the power decreases from 13:00 onwards up to 17:45. However, Vey increases up to 15:45 and then
de-creases. Thus, on this day δn/n values are also the rela-tively high, mostly independent of the variations in Vey and
power in the late afternoon and pre-noon hours. Similar is the case at 101 and 107 km. The time variations of Vey, relative
power, δn/n (for 104 km) and 1H for 15 June 1995 are shown in Fig. 8. The gap in the figure corresponds to the presence of type I in the radar spectrum. It is seen that δn/n values show similar variations, as shown by Veyand power from 12:45 to
13:45. Beyond 13:45, power and Vey decrease, while δn/n
shows an increase from ∼6% to 8% by 16:30. 1H values do show similar variations with Vey and δn/n, especially when
EEJ is strong. Again it is seen that in the pre-noon time the δn/n values are high while the power and Vey have not yet
built up.
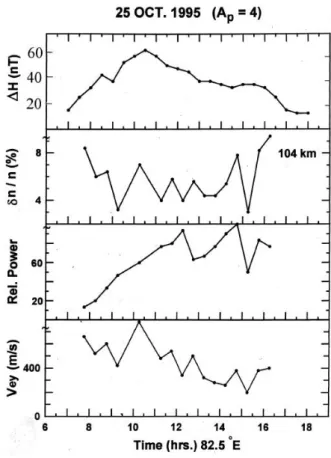
Time variations of Vey, relative power, δn/n (all obtained
from HF radar observations) and 1H for 25 and 26 October
Fig. 5. Daytime variation of corrected Vey, relative power, δn/n at
104 km and 1H at Trivandrum on 22 December 1993.
Fig. 6. Daytime variation of the estimated Ey(taking into account
νe∗)on 22 December 1993. The sharp increase in the electric field magnitude between 14:00 and 16:00 is to be noted in particular.
1995 are shown in Figs. 9 and 10, respectively. In Fig. 9, 1H values attain their peak at ∼10:30, nearly close to the time of maximum in Vey (this feature can also be noticed in Fig. 10
for 26 October 1995). Prior to 09:00, the relative power is less, even while δn/n values are relatively high. Similarly we see high δn/n values in the late afternoon hours, while the power and Veyare low or decreasing. This behaviour in
Fig. 7. Daytime variation of corrected Vey, relative power and δn/n
at 99 km on 22 December 1993.
Fig. 8. Same as Fig. 5, but for 15 June 1995.
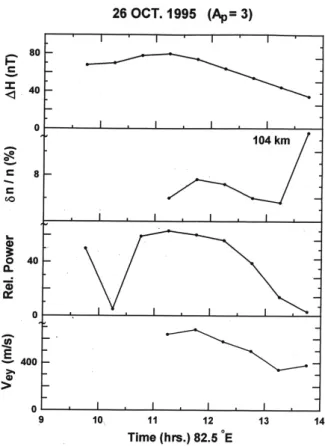
the pre-noon and post-noon periods is a consistent feature for all the days examined. It is to be noted from Fig. 10 that the parameters Vey and δn/n are shown only from 11:15, in
Fig. 9. Same as Fig. 5, but for 25 October 1995.
view of the fact that slight type I contamination was present in the HF radar data prior to that time. In such cases, the data give rise to unrealistically high values of Vey, δn/n and
νe∗/νe. Further, in Fig. 10, the parameters Vey, power, δn/n
and 1H show similar variations up to ∼13:30. Beyond that time, δn/n shows an increase, while Vey and power show a
decreasing trend. The importance and the implications of the above observations are discussed below.
5 Discussion
In the present study, the parameters δn/n, ν∗e/νeand Vey
(cor-rected to include turbulence) have been estimated mainly for quiet days at different times. The method of deducing these parameters used in the present study is based on the non-linear short scale turbulence theory developed by Ronchi et al. (1990) for scale sizes <100 m and hence the values de-duced using this method correspond to a range of turbulent scale sizes below 100 m. The deduced δn/n values using both HF and VHF radars lie in the range of 0–10%. For similar scale sizes Pfaff et al. (1987) have reported δn/n values in the range 0–10% using in-situ measurements in Peru for electro-jet altitudes. Prakash et al. (1972) have shown using in-situ rocket measurements at Trivandrum that irregularity ampli-tudes for scale sizes <15 m are 0–2% while that for scale sizes in the range 30–300 m are 0–20% for electrojet alti-tudes. Thus, the values deduced in the present study seem to
1172 G. Manju et al.: Spatial and temporal variations of small-scale plasma turbulence parameters
Fig. 10. Same as Fig. 5, but for 26 October 1995.
agree well with different in-situ measurements, as the scale sizes probed by the VHF and HF radars are 2.7 m and 8.3 m, respectively.
The use of HF radar data, in addition to VHF radar data for estimating turbulence parameters yields δn/n values in the same range, thereby further confirming the validity of the method used in the present study. Moreover, the approach of using HF and VHF radar observations has an added advan-tage that VHF radar data is contaminated by the presence of type I irregularities during strong electrojet times (Vikramku-mar et al., 1984), whereas during such times turbulence pa-rameters can be estimated from HF radar data, as it is less susceptible to type I contamination.
The phase velocity of type II irregularities, which indicates the strength of the electrojet current, is proportional to the radar measured mean Doppler frequency (f
D
), as mentioned earlier (Reddy et al., 1987). Vikramkumar et al. (1984) have presented the typical daytime variation of the radar measured mean Doppler frequency. They have shown that the elec-trojet current and signal strength (power) show a rapid in-crease in the morning (building-up phase), a broad maximum around 11:00 (strong EEJ phase), and a decrease in the after-noon hours (decaying phase). The present study shows that there is a direct relation between δn/n and power when the EEJ is strong. During those times when the EEJ is building up (before 09:30) and decaying (after 13:30) the δn/n val-ues are high, while the radar-observed backscattered power is
low. During such times (morning building up and afternoon falling off times of the EEJ), the background electron den-sity (n) values are relatively low. These low n values result in an increase in δn/n for a given δn value. This could pos-sibly explain the high δn/n observed during weak EEJ times. Moreover, the backscattered power variations obtained using the VHF radar correspond to irregularities in the wavelength range of ∼3 m. During non-steady states of the EEJ, proba-bly energy has not been fully transferred to the very small-scale sizes of ∼3 m from relatively larger small-scale sizes. This can also result in high δn/n (which corresponds to all scale sizes below 100 m) while power (corresponding to 3 m scale) is low. When the EEJ gains strength, energy fully reaches the lowest of scale sizes “seen” by the radar and observed power becomes high. As the EEJ gains strength by about 09:30 the background electron density (n) increases and δn/n values re-duce with respect to the earlier values.
6 Conclusions
The study carried out using co-located HF and VHF radar observations at Trivandrum brings out the following aspects. 1. The deduced values of δn/n agree well with the values
obtained by other workers using in-situ observations. 2. The δn/n values obtained using simultaneous HF and
VHF radar observations lie in the same range, thus val-idating the present method of estimation of turbulence parameters.
3. A direct relationship is observed between δn/n and backscattered power during strong EEJ times. During building up and decaying phases of EEJ, the δn/n val-ues are high while the power is low. This shows that during the strong phase of the EEJ energy is carried to the lowest of scale sizes. During the weaker phases of the EEJ, the power values are low while δn/n is high, as the energy has not been carried to the lowest of scale sizes and a steady state has not been reached. Thus, the comparison of δn/n and backscattered power sheds light on the growth and evolution of turbulence in the electro-jet plasma.
4. The absence of type I contamination in the HF radar data facilitates the estimation of turbulence parameters even when VHF radar data is contaminated by type I irregularities.
The study brings out the utility of the present method in estimating plasma turbulence parameters using HF and VHF radar data. Further, the behavior of δn/n and backscattered power at different times of the day shows the diurnal evolu-tion of plasma turbulence in the EEJ. This aspect can in the future be studied further to understand the differences in the growth and development of plasma turbulence under differ-ent geophysical conditions, such as magnetically highly dis-turbed, moderately disdis-turbed, and quiet times. Another as-pect that can be pursued is the study of the seasonal variations
of the plasma turbulence parameters, if any. The database generated from such studies can be potentially used to im-prove existing electrojet models.
Acknowledgements. The authors thank the referees for their valu-able comments which helped to improve the paper substantially. The useful discussions with colleagues in Space Physics Labora-tory are greatfully acknowledged.
Topical Editor U.-P. Hoppe thanks G. Hassenpflug and T. Blix for their help in evaluating this paper.
References
Farley, D. T., Ierkic, W. M., and Fejer, B, G.: Radar Interferome-try: A new technique for studying plasma turbulence in the iono-sphere. J. Geophys. Res., 86, 1467–1472, 1981.
Farley, D. T.: Theory of equatorial electrojet plasma waves: New developments and current status. J. Atmos. and Terr. Phys., 47, 729–744, 1985.
Farley, D. T., Swartz, W. E., Hysell, D. L., and Ronchi, C.: High-resolution radar observations of daytime kilometre scale wave structures in the equatorial electrojet. J. Geophys. Res., 99, 299– 307, 1994.
Fejer, B. G. and Kelley, M. C.: Ionospheric irregularities. Reviews of Geophys. and Space Phys., 18, 401–454, 1980.
Hedin, A. E.: MSIS-86 thermospheric model. J. Geophys. Res., 92, 4649–4662, 1987.
Janardhanan, K. V., Ramakrishna Rao, D., Viswanathan, K. S., Kr-ishna Murthy, B. V., Shenoy, K. S. V., Mohan Kumar, S. V., Ka-math, K. P., Mukundan, K. K., Sajitha, G., Shajahan M., and Ayyappan, C.: HF backscatter radar at the magnetic equator: System details and preliminary results. Indian J. Radio and Space Phys., 30, 77–82, 2001.
Krishna Murthy, B. V. and Sudha R.: Effect of small-scale plasma turbulence on profiles of electron drift velocity in the equatorial electrojet. An experimental study. J. Geophys. Res., 99, 19 549– 19 554, 1994.
Kudeki, E., Fejer, B, G., Farley, D. T., and Hanuise, C.: The CON-DOR equatorial electrojet campaign: Radar results. J. Geophys. Res., 92, 13 561–13 577, 1987.
Manju, G.: Studies on equatorial electrojet. Ph.D. Thesis, Univer-sity of Kerala, India, 44–54, 1997.
Pfaff, R. F., Kelley, M. C., Kudeki, E., Fejer, B, G., and Baker, K. D.: Electric field and plasma density measurements in the strongly driven daytime equatorial electrojet, 2. The unstable layer and gradient drift waves. J. Geophys. Res., 92, 13, 597– 612, 1987.
Prakash, S., Subbaraya B. H., and Gupta, S. P.: Rocket measure-ments of ionisation irregularities in the equatorial ionosphere at Thumba and identification of plasma irregularities. Indian J. Ra-dio Space Phys., 1, 72–79, 1972.
Reddy, C. A., Vikramkumar, B. T., and Viswanathan, K. S.: Electric fields and currents in the equatorial electrojet deduced from VHF radar observations − I. A method of estimating electric fields. J. Atmos. and Terr. Phys., 49, 183–191, 1987.
Richmond, A. D.: Equatorial electrojet−I. Development of a model including winds and instabilities. J. Atmos. Terr. Phys., 35, 1083–1103, 1973a.
Richmond, A. D.: Equatorial electrojet−II. Use of the model to study the equatorial ionosphere.J. Atmos. Terr. Phys., 35, 1105– 1118, 1973b.
Ronchi, C., Sudan, R. N., and Similon, P. L.: Effect of short scale turbulence on kilometre wavelength irregularities in the equato-rial electrojet. J. Geophys. Res., 95, 189–200, 1990.
Ronchi, C., Sudan, R. N., and Farley, D. T.: Numerical simulations of large-scale plasma turbulence in the daytime equatorial elec-trojet. J. Geophys. Res., 96, 21 263–21 279, 1991.
Sudan, R. N.: Unified theory of type I and type II irregularities in the equatorial electrojet. J. Geophys. Res., 88, 4853–4860, 1983a. Sudan, R. N.: Non-linear theory of type I irregularities in the
equa-torial electrojet. Geophys. Res. Lett., 10, 983–986, 1983b. Sudha R. and Reddy, C. A.: Variation of type I plasma wave phase
velocity with electron drift velocity in the equatorial electrojet. J. Geophys. Res., 98, 21 581–21 592, 1993.
Vikramkumar, B. T., Viswanathan, K. S., and Rao, P. B.: VHF backscatter radar observations of the equatorial electrojet irregu-larities: Diurnal, seasonal and solar cycle variations. Ann. Geo-phys., 2, 495–500, 1984.
Viswanathan, K. S., Vikramkumar, B. T., and Reddy, C. A.: Electric fields and currents in the equatorial electrojet deduced from VHF radar observations, II. Characteristics of electric fields on quiet and disturbed days. J. Atmos. and Terr. Phys., 49, 193–200, 1987.