HAL Id: hal-00297448
https://hal.archives-ouvertes.fr/hal-00297448
Submitted on 7 Apr 2008
HAL is a multi-disciplinary open access
archive for the deposit and dissemination of
sci-entific research documents, whether they are
pub-lished or not. The documents may come from
teaching and research institutions in France or
abroad, or from public or private research centers.
L’archive ouverte pluridisciplinaire HAL, est
destinée au dépôt et à la diffusion de documents
scientifiques de niveau recherche, publiés ou non,
émanant des établissements d’enseignement et de
recherche français ou étrangers, des laboratoires
publics ou privés.
The impact of biogenic VOC emissions on photochemical
ozone formation during a high ozone pollution episode
in the Iberian Peninsula in the 2003 summer season
N. Castell, A. F. Stein, R. Salvador, E. Mantilla, M. Millán
To cite this version:
N. Castell, A. F. Stein, R. Salvador, E. Mantilla, M. Millán. The impact of biogenic VOC emissions on
photochemical ozone formation during a high ozone pollution episode in the Iberian Peninsula in the
2003 summer season. Advances in Science and Research, Copernicus Publications, 2008, 2, pp.9-15.
�hal-00297448�
Adv. Sci. Res., 2, 9–15, 2008 www.adv-sci-res.net/2/9/2008/
©Author(s) 2008. This work is distributed under the Creative Commons Attribution 3.0 License.
Advances in
Science and
Research
EMS
Annual
Meeting
and
8th
Eur
opean
Confer
ence
on
Applications
of
Meteor
olo
gy
2007
The impact of biogenic VOC emissions on photochemical
ozone formation during a high ozone pollution episode in
the Iberian Peninsula in the 2003 summer season
N. Castell1, A. F. Stein2, R. Salvador1, E. Mantilla1, and M. Mill´an1
1Fundaci´on Centro de Estudios Ambientales del Mediterraneo, CEAM, Paterna, Valencia, Spain 2Earth Resources and Technology on assignment to NOAA/Air Resources Lab., Silver Spring, Maryland, USA
Received: 9 December 2007 – Revised: 28 February 2008 – Accepted: 18 March 2008 – Published: 7 April 2008
Abstract. Throughout Europe the summer of 2003 was exceptionally warm, especially July and August. The European Environment Agency (EEA) reported several ozone episodes, mainly in the first half of August. These episodes were exceptionally long-lasting, spatially extensive, and associated to high temperatures. In this paper, the 10–15 August 2003 ozone pollution event has been analyzed using meteorological and regional air quality modelling. During this period the threshold values of the European Directive 2002/3/EC were ex-ceeded in various areas of the Iberian Peninsula.
The aim of this paper is to computationally understand and quantify the influence of biogenic volatile organic compound (BVOC) emissions in the formation of tropospheric ozone during this high ozone episode. Being able to differentiate how much ozone comes from biogenic emissions alone and how much comes from the interaction between anthropogenic and biogenic emissions would be helpful to develop a feasible and effec-tive ozone control strategy. The impact on ozone formation was also studied in combination with various anthropogenic emission reduction strategies, i.e., when anthropogenic VOC emissions and/or NOxemissions
are reduced. The results show a great dependency of the BVOC contribution to ozone formation on the antro-poghenic reduction scenario. In rural areas, the impact due to a NOxand/or VOC reduction does not change
the BVOC impact. Nevertheless, within big cities or industrial zones, a NOxreduction results in a decrease
of the biogenic impact in ozone levels that can reach 85 µg/m3, whereas an Anthropogenic Volatile Organic Compound (AVOC) reduction results in a decrease of the BVOC contribution on ozone formation that varies from 0 to 30 µg/m3with respect to the contribution at the same points in the 2003 base scenario. On the other hand, downwind of the big cities, a decrease in NOxproduces a minor contribution of biogenic emissions and
a decrease in AVOCs results in greater contributions of BVOCs to the formation of ozone.
1 Introduction
Ozone is the most abundant tropospheric oxidant and an important component of photochemical pollution. Tropo-spheric ozone is formed by photochemical reactions with a nonlinear chemistry involving volatile organic compounds (VOCs) and the oxides of nitrogen (NOx=NO+NO2).
Ele-vated concentrations of near-surface ozone that typically oc-cur during the summer months have been shown to be harm-ful to human health and damaging to vegetation. Both NOx
and VOCs originate either from anthropogenic sources, e.g.,
Correspondence to: N. Castell
(nuria@ceam.es)
industries and vehicles, or from biogenic sources. This indi-cates that both anthropogenic and biogenic sources play roles in ozone formation and accumulation.
Naturally occurring VOC (especially isoprene, emitted primarily by oaks and other deciduous trees) represent a sig-nificant fraction of total ambient VOC, especially in subur-ban and rural settings. Biogenic VOC are especially impor-tant because they are usually highly reactive. Furthermore, a high rate of biogenic VOC emission increases the ratio of reactivity-weighted VOC to NOx and makes NOx-sensitive
conditions more likely (Chameides et al., 1992; Pierce et al., 1998; Sillman et al., 2002). On the other hand, biogenic NOx
10 N. Castell et al.: The impact of biogenic VOC emissions on photochemical ozone formation During the 10–15 August 2003 ozone pollution event,
an-ticyclonic conditions were accompanied by long residence times of polluted air masses in the atmospheric boundary layer, inhibiting the renovation of air masses. These atmo-spheric conditions, together with a cloudless sky and ele-vated temperatures, favoured photochemical ozone forma-tion. When influenced by meteorological conditions fea-turing a weak pressure gradient, the complex topography of the Iberian Peninsula favours the development of mesoscale flows such as mountain winds, topographic injection, and land/sea breeze. These mesoscale structures affect ozone distribution over the Iberian Peninsula (Millan et al., 1997). The aim of the present study is to computationally estimate the influence of biogenic volatile organic compound (BVOC) emissions on the formation of tropospheric ozone during this high ozone episode.
Previous air quality modelling research work, ranging from urban to continental scales, concluded that: (1) bio-genic emissions generally enhance ozone formation in most areas, and the magnitude of their impact varies from location to location; (2) a large biogenic impact normally occurs dur-ing high-temperature periods because biogenic sources tend to emit more VOCs at high temperatures; and (3) naturally emitted VOCs, especially isoprene, play a significant role in ground-level ozone due to their relatively high reactivity (Tao et al., 2003; Bell and Ellis, 2004).
In this paper, we consider the impact of biogenic emissions on surface ozone concentrations in the Iberian Peninsula. This study reports the “total impact” on ozone formation due to biogenic sources, i.e. the sum of ozone contributions from biogenic emissions alone (the pure impact) and those from the interactions between anthropogenic and biogenic emis-sions (the synergistic impact), and the isolated contribution of each of these factors (pure and synergistic) to ozone con-centrations. Thunis and Cuvelier (2000) addressed these is-sues by applying a factor separation approach to ozone mod-elling in the Burriana area (East coast of Spain) for a two-day ozone episode. We apply this approach to the Iberian Penin-sula over a six-day episode to determine the total, pure and synergistic impacts of biogenic and anthropogenic sources to ground-level ozone concentrations.
The impact on ozone formation is also studied in the con-text of various anthropogenic emissions reduction strategies, i.e., when anthropogenic VOC emissions and/or NOx
emis-sions are reduced.
2 Methodology
2.1 Meteorological and photochemical modelling
The non-hydrostatic Mesoscale Meteorological v3.5 (MM5) model has been used to simulate the meteorological situa-tion. Two nested grids (one-way) have been used with a 24 and 72 km horizontal resolution and a variable vertical reso-lution up to 15 km. The MM5 model was evaluated against
observed surface winds and temperature and was judged suit-able for use in emissions and photochemical modelling (Sal-vador et al., 2006).
For the photochemical simulation the CAMx v.4.3 air quality model operating with the CBIV chemical mechanism has been used. The influence of the initial conditions is mini-mized through a proper spin-up time (72 h), and the boundary conditions were selected as average background concentra-tions for the area, with an ozone concentration of 70 µg/m3
(Castell et al., 2007a,b).
2.2 Emission estimation
The anthropogenic emissions (traffic and industry) in the Iberian Peninsula have been estimated from the EMEP/CORINAIR (EEA, 2006) emissions inventory. The BVOCs emission model for vegetation (isoprene, monoter-penes and other VOCs) uses the algorithm from Guenther et al. (1993), suited and adapted for the particular emitter behaviour of some Mediterranean species. Emission factors and foliar biomass density associated with emitter land-use categories were collected from a literature review, giving pri-ority to those defined inside the Mediterranean zone. A de-tailed description can be found in Castell et al. (2006) and Parra et al. (1994). For land-use and meteorological inputs required by the BVOC emissions model the CORINE digital land-use map (Eionet, 2008) and the MM5 outputs (Castell et al., 2006) were used, respectively. In this study other natural sources as forest fires have not been considered.
The Guenther algorithm includes an environmental cor-rection factor owing to temperature and Photosynthetically Active Radiation (PAR) flux, however it does not include other biotic or abiotic variables that can be important because knowledge about them is very limited. The Iberian Peninsula has often dry summer periods such as August 2003, during which moisture is not available. Under such conditions, plant stomata are closed and therefore biogenic emissions can de-crease. The hydric stress is not contemplated by the algo-rithm. However, when possible, seasonal emission factors were used, in order to describe the Mediterranean species characteristics in dry and hot summers (Penuelas and Lluisa, 2001a,b).
Figure 1 shows the hourly mean emissions of isoprene, ter-penes and other VOCs (biogenic) and nitrogen dioxide (an-thropogenic) over the Iberian Peninsula for the 10–15 August 2003 episode.
2.3 Factor analysis
In order to quantify the amount of ozone originated from pure biogenic emissions as well as that from the synergistic ef-fect between anthropogenic and biogenic emissions, the fac-tor analysis technique proposed by Stein and Alpert (1993) was employed.
Figure 1.Hourly mean emissions of: (a) biogenic isoprene, (b) biogenic terpenes, (c) other biogenic VOCs, and (d) anthropogenic nitrogen dioxide, for the 10–15 August 2003 episode.
We consider the influences of factors A (Anthropogenic emissions) and B (Biogenic emissions) on the formation of ozone, and denote SAB, SA, SB, and SOsimulation results to
include both factors A and B, factor A alone, factor B alone, and neither of the two factors, respectively. Then the pure impacts (denoted by a prime) of factor A and B are given respectively by: S′
A=SA−SOand S′B=SB−SO.
Since the run including both factors is expressed as SAB=SO+S′A+SB′+S′AB, the effect of the mutual
interaction between the two processes is given by:
S′
AB=SAB−S′A−S′B−SO=SAB−SA−SB+SO.
On the other hand, the total impact of factor B is defined by SAB−SA (equivalent to S′B+S′AB), so that the interaction
can also be written as the difference between the total and the pure impacts, i.e., S′
AB=(SAB−SA)−(SB−SO).
This implies that the evaluation of the contribution from the two factors, and from their possible interaction, requires four simulations, namely SAB, SA, SBand SO.
3 Results and discussion 3.1 Model vs. measurement data
Air quality stations hourly data were used in order to eval-uate the performance of MM5-CAMx to simulate
ground-level ozone. Hourly measurements were provided by 8 re-mote air quality stations belonging to the EMEP network and homogenously distributed over Spain. The site descriptions can be found in NILU (2008). The performance of the mod-els was statistically evaluated by comparing the first-layer simulations results and the values measured at the air quality stations.
The objective set in the Directive 2002/3/EC (deviation of 50% for the 1-hour averages during daytime) is achieved for all of the stations for the whole period (10–15 August 2003), with a mean normalized gross error of −35%, and an un-paired peak accurately of −23%.
3.2 Impact of BVOC emissions on ozone levels
In this section, the BVOC impact is characterized by simu-lations with and without BVOC emissions. The total impact of biogenic emissions is studied by differentiating two sim-ulations: with (SAB) and without (SA) biogenic emissions;
however, both simulations include anthropogenic emissions. The maximum hourly episodic ozone levels have been rep-resented in Fig. 2a. The highest ozone values are found in the coastal zones and in the area of Madrid. It is in these areas
12 N. Castell et al.: The impact of biogenic VOC emissions on photochemical ozone formation
Figure 2. (a) Hourly maximum of ozone for every grid during
the episode. (b) Maximum hourly impact of biogenic emissions,
SAB−SA(µg/m3) for the 10–15 August 2003 episode. Note that the
difference does not necessarily occur on the ozone peak.
that the Iberian Peninsula’s largest cities and most important industrial zones are located.
Figure 2b shows for each grid point in the computa-tional domain, the maximum biogenic impact (in µg/m3), i.e., SAB−SA on ozone levels during the episode. The map
is therefore not a snapshot at a specific time, since the maxi-mum impact occurs at different times for different locations. From Fig. 2b we deduce that the largest impact of biogenic emissions is produced in areas where there is a pre-existing high photochemical production, i.e. close to zones where there are high emissions of ozone precursors. Thus, the total impact of the biogenic emission (the pure one in addition to the one that includes the biogenic/anthropogenic interaction) on the area of Madrid, Barcelona or Valencia can surpass 180 µg/m3 in the hourly maxima, and 120 µg/m3 in the 8-h
maxima. It should be noticed that this impact does not nec-essarily coincide with the timing of the ozone peak. More-over, both the information and the human health protection thresholds could also be surpassed by only considering the contribution from the anthropogenic emissions.
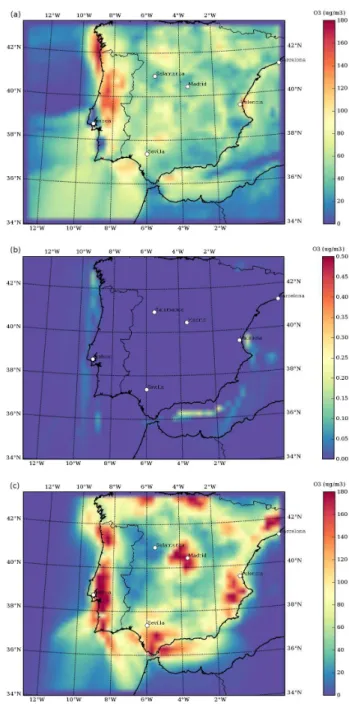
Figure 3.Factor separation analysis. Hourly maximum impact. (a)
S′
A, pure contribution of anthropogenic emissions to ozone
forma-tion; (b) S′
B, pure biogenic contribution; (c) S′AB, mutual interaction
between anthropogenic and biogenic emissions.
In the western part of the Iberian Peninsula there is a vast area where the total impact from biogenic emissions is smaller. This is a zone with fewer anthropogenic emissions, and a high VOC/NOxratio, it is a NOxsensitive ozone regime
(or NOx-limited). On the other hand, the most important
im-pact of biogenic emissions takes place in areas where large sources of NOx exists (low VOC/NOx ratios). One
possi-ble explanation is that those areas are VOC-sensitive (NOx
-saturated).
The impact of biogenic VOC seems to be greater in the VOC-sensitive areas. Nevertheless, O3-NOx-VOC
sensitiv-ity for individual locations and events are often very un-certain. Generalizations about NOx-sensitive versus
VOC-sensitive conditions are always very approximate and subject to many exceptions. NOx-sensitive conditions are possible
even in an urban centre, and VOC-sensitive conditions can occur even at far downwind locations (Jacob et al., 1995; Kleinman et al., 2000). Additional research is needed before a firm conclusion can be drawn.
3.3 Separation between biogenic and anthropogenic im-pacts
Results of the factor analysis of the two types of emissions are shown in Fig. 3. The figure depicts the maximum hourly contribution to the ozone concentration (not necessarily co-inciding with the ozone maximum), from pure anthropogenic emission (S′
A); from pure biogenic emission (S′B); and from
the interaction between biogenic and anthropogenic emis-sions (S′
AB), during the 10-15 August 2003 episode. The total
contribution of the biogenic emissions (S′
B+S′AB= SAB−SA)
is represented in Fig. 2b.
It can be observed that the biogenic emission contribu-tion is due almost exclusively to its interaccontribu-tion with anthro-pogenic emissions. In fact, the pure BVOC contribution is less than 1 µg/m3 in any area of the Iberian Peninsula
(Fig. 3b). This means that when only biogenic emissions are considered, the modelled ozone concentrations remain near background levels.
On the other hand, the contribution from pure anthro-pogenic emissions shows impacts higher than 120 µg/m3
across an extensive area of the peninsula (Fig. 3a). These impacts, added to the background concentrations, can sur-pass the legal thresholds of the European Directive. The contribution due to the interaction between biogenic and anthropogenic emissions surpasses the threshold values of 180 µg/m3and 240 µg/m3in different areas of the Peninsula
(Fig. 3c).
3.4 Sensitivity toNOx/AVOC emission reductions
In this section the BVOC impact on ozone production is an-alyzed when the anthropogenic emissions are reduced (50% NOxand/or AVOC).
All the anthropogenic reduction scenarios produce an im-provement in air quality with respect to the 2003 base sce-nario, since they all generate a reduction in the number of ozone threshold exceedances, as defined in EU Directives. Nevertheless, this improvement is more pronounced in some scenarios than in others. The scenarios with a 50% reduc-tion of NOx and those with a 50% reduction of NOx and
AVOC present a very similar spatial distribution in terms of exceedances, being restricted to large emission areas like Va-lencia, Barcelona or Madrid, and to the river channels. On
the other hand, even though the 50% AVOC reduction sce-nario shows a reduction in the number of exceedances, the reduction is not as pronounced as in the reduced NOx
scenar-ios.
It is observed that the BVOC impact has a clear depen-dence on NOxand AVOCs availability. In all the reduction
scenarios, as well as in the 2003 base scenario, the largest impacts are located around the zones with the greatest pre-cursor emissions, or downwind from them, moving inland along the natural channels. Nevertheless, if we compare the BVOC impact in these scenarios with the impact in the 2003 base scenario, both show zones in which the biogenic impact has increased and decreased. The biogenic emissions impact thus depends on the reduction scenario, i.e., whether it is a NOx or an AVOC reduction scenario. We have found zones
where reducing the NOxdecreases the BVOC impact, as well
as zones where decreasing the AVOCs increases the BVOC contribution to ozone formation.
The result of applying factorial analysis to the anthro-pogenic reduction emission scenarios shows that the largest mutual impact is produced in the AVOC reduction scenario (Fig. 4b). The explanation for this is that when AVOCs are reduced, the BVOCs, which have a high reactivity, play a more active role in the OH chemistry. In coastal zones, big cities and industrial areas, the synergistic impact could be greater than 180 µg/m3.
The second scenario where the synergy between anthro-pogenic and biogenic emissions is greater is the one in which both AVOCs and NOxhave been reduced by 50% (Fig. 4c).
In this scenario, the areas with large anthropogenic emissions have an impact up to 180 µ/m3. This means that the
contri-bution from the interaction between anthropogenic and bio-genic emissions is high enough to surpass the information threshold.
In rural areas (with high VOC/NOxratios), the impact due
to a reduction in NOxand/or VOC, scarcely suffers variations
in relation to the 2003 base case. Nevertheless, in areas with high NOx emissions (VOC-limited), the reduction in NOx
results in a decrease of the biogenic impact, that can reach 85 µg/m3; in these VOC-limited points the AVOCs reduction could also give place to a decrease in the BVOC contribution on ozone formation ranging from 0 to 30 µg/m3with respect
to their contribution at the same points in the 2003 base sce-nario.
On the other hand, downwind of the big cities (Barcelona, Madrid, Valencia or Sevilla) or industrial areas where a de-crease in the NOx produces a lower contribution of
bio-genic emissions (40 to 80 µg/m3), the decrease in AVOCs
results in greater contributions of BVOCs, with differences in relation to the contribution in the 2003 base scenario that reach 60 µg/m3. This can be related to the fact that as
air moves downwind from emission sources and ages pho-tochemically, conditions tend to change from VOC-limited (closer to emission sources) to NOx-sensitive (further from
14 N. Castell et al.: The impact of biogenic VOC emissions on photochemical ozone formation
Figure 4.Maximum hourly impact of biogenic emissions, SAB−SA
(µg/m3) for the different control scenarios: (a) 50% NO
x; (b) 50%
AVOC; and (c) 50% NOxand AVOC, respectively.
more rapidly than VOC as an air mass moves downwind (thus increasing the VOC/NOx ratio) and because biogenic
VOC becomes increasingly important as air moves down-wind (Milford et al., 1989, 1994).
Nevertheless, on the southern Portuguese coast the con-tribution of biogenic emissions reaches up to 200 µg/m3 in
the 50% NOxreduction scenario (Fig. 4a), which represents
around 60 µg/m3more than in the 2003 base scenario. These locations in southern Portugal are situated in one of the areas with the highest NOxemissions in the Iberian Peninsula, and
in a zone with important natural biogenic emissions. Results show (figure not included) that the largest purely anthropogenic contribution to the ozone levels is registered in the 50% NOx reduction scenario, and it is located in the
coastal zones, major urban centres and river valleys. In fact, in some areas, the anthropogenic contribution increases in relation to the 2003 emission scenario.
4 Conclusions
Including biogenic emissions in the photochemical simula-tion of the episode substantially enhances ozone producsimula-tion, yielding higher maximum values and also a greater number of exceedances of the thresholds established in the Directive. A factor analysis technique has been used to separate the pure biogenic emission contribution from the synergistic an-thropogenic and biogenic emission contribution. It is ob-served that for the whole Iberian Peninsula, the purely bio-genic VOC emission contribution is very small. In fact, in the simulation that included only BVOCs, the ozone levels stayed at nearly “clean air” conditions. The largest contri-bution of biogenic emissions comes from its non-linear in-teraction with anthropogenic emissions. At some points in the Peninsula, this mutual contribution between both types of emissions surpasses 180 µg/m3 in the hourly values, and
120 µg/m3 in the 8-h averages. This would produce
ex-ceedances of the legal threshold values established in the Eu-ropean Directive. Thus, the synergy between anthropogenic and biogenic emissions must be considered when examining anthropogenic emission control strategies.
On the other hand, another large contributor to ozone con-centrations is the purely anthropogenic factor, with ozone concentrations that can also exceed the legal thresholds men-tioned above.
The impact of biogenic emissions on ozone formation has also been studied in combination with some pogenic emissions reduction strategies, i.e., when anthro-pogenic VOC emissions and/or NOx emissions are reduced
by 50%. The largest impact is found in the scenario with NOxemissions unchanged and reduced anthropogenic VOCs
sources. This can be attributed to a decrease in anthropogenic competition in the ozone production reactions involving the OH radical.
Due to the highly non-linear nature of ozone formation the impact of BVOCs emissions on ozone is dependent on the initial levels of NOxand VOCs in a particular zone. For
instance, in rural areas (generally, NOx-limited), the impact
due to a reduction in NOxand/or VOC, scarcely suffers
vari-ations in relation to the 2003 base scenario. Nevertheless, in the polluted areas, the reduction in NOxproduces a decrease
in the biogenic impact. However an exception was observed on the southern Portuguese coast where the impact of bio-genic emissions reach up to 60 µg/m3more than in the 2003 base scenario in the NOxreduction scenario.
In view of the important impact of biogenic emissions on surface ozone levels, it is necessary to stress the need for having more accurate estimates of both the biogenic emis-sion factors for Mediterranean species and other parameters required for the elaboration of natural emissions inventories in order to reduce the uncertainties which, in current inven-tories, can reach up to 300% (Guenther et al., 2000; Simpson et al., 1995).
Acknowledgements. The Fundacion CEAM is financed by the Generalitat Valenciana and BANCAIXA. This work is a contribu-tion to CONSOLIDER-INGENIO 2010 programme (GRACCIE research project) and ACCENT. Thanks also to CESCA for its computer support.
Edited by: S. Joffre
Reviewed by: two anonymous referees
References
Bell, M. and Ellis, H.: Sensitivity analysis of tropospheric ozone to modified biogenic emissions for the Mid-Atlantic region, Atmos. Environ., 38, 1879–1889, 2004.
Castell, N., Mantilla, E., Salvador, R., Stein, A., Hernandez, L., and Millan, M.: Emission Inventory for a Photochemical Modelling Exercise over the South-west of Spain, 6th Annual Meeting of the EMS/6th ECAC, EMS2006-A-00315, 2006.
Castell, N., Salvador, R., Mantilla, E., and Millan, M.: A strategy for impact assessment using air quality models: an application in the Iberian Peninsula, 7th EMS Annual Meeting and 8th Euro-pean Conference on Applications of Meteorology, EMS2007-A-00341, 2007a.
Castell, N., Stein, A., Salvador, R., Mantilla, E., and Millan, M.: Sensitivity analysis of tropospheric ozone to modified initial and boundary conditions in both rural and industrial zones, 7th EMS Annual Meeting and 8th European Conference on Applications of Meteorology, EMS2007-A-00122, 2007b.
Chameides, W. L., Fehsenfeld, F., Rodgers,M. O., Cardellino, C., Martinez, J., Parrish, D., Lonneman, W., Lawson, D. R., Ras-mussen, R. A., Zimmerman, P., Greenberg, J., Middleton, P., and Wang, T.: Ozone precursor relationships in the ambient atmo-sphere, J. Geophys. Res., 97, 6037–6056, 1992.
EEA.: EMEP/CORINAIR Emission Inventory Guidebook, Tecni-cal report No 11/2006. European Environmental Agency, Copen-hagen, Denmark, 2006.
Eionet: European Topic Centre on Land Use and Spatial Infor-mation, http://terrestrial.eionet.europa.eu/CLC2000, (last access: April 2008), 2008.
Guenther, A., Zimmerman, P. R., and Harley, P. C.: Isoprene and monoterpenes Emission Rate Variability: Model Evaluations and Sensitivity analysis, J. Geophys. Res., 98(D7), 12 609–12 617, 1993.
Guenther, A., Geron, C., Pierce, T., Lamb, B., Harley, P., and Fall, R.: Natural emissions of non-methane volatile organic com-pounds, carbon monoxide, and oxides of nitrogen from North America, Atmos. Environ., 34, 2205–2230, 2000.
Jacob, D. J., Heikes, B. G., Dickerson, R. R., Artz, R. S., and Keene, W. C.: Evidence for a seasonal transition from NOx-to
hydrocarbon-limited ozone production at Shenandoah National Park, Virginia, J. Geophys. Res., 100, 9315–9324, 1995. Kleinman, L. I., Daum, P. H., Imre, D. G., Lee, J. H., Lee,
Y.-N., Nunnermacker, L. J., Springston, S. R., Weinstein-Lloyd, J., and Newman, L.: Ozone production in the New York City urban plume, J. Geophys. Res., 105, 14 495–14 511, 2000.
Milford, J., Russell, A. G., and McRae, G. J.: A new approach to photochemical pollution control: implications of spatial patterns in pollutant responses to reductions in nitrogen oxides and reac-tive organic gas emissions, Environ. Sci. Tech., 23, 1290–1301, 1989.
Milford, J., Gao, D., Sillman, S., Blossey, P., and Russell, A. G.: Total reactive nitrogen (NOy) as an indicator for the sensitivity of ozone to NOxand hydrocarbons, J. Geophys. Res., 99, 3533–
3542, 1994.
Millan, M., Salvador, R., and Mantilla, E.: Photooxidant dynamics in the Mediterranean Basin in summer: results from European Research Projects, J. Geophys. Res., 102(D7), 8811–8823, 1997. NILU: EMEP network site descriptions, http://www.nilu.no/ projects/ccc/sitedescriptions/es/index.html, (last access: April 2008), 2008.
Parra, R., Gasso, S., and Baldasano, J. M.: Estimating the biogenic emissions of non-methane volatile organic compounds from the North Western Mediterranean vegetation of Catalonia, Spain, Sci. Total Environ., 329, 241–259, 2004.
Penuelas, J. and Lluisa J.: Seasonal patterns of not-terpenoid C6-C10 VOC emission form seven Mediterranean woody species, Chemosphere, 45, 237–244, 2001a.
Penuelas, J. and Lluisa J.: The complexity of factors volatile organic compounds emissions by plants, Biol. Plant., 44(4), 481–487, 2001b.
Pierce, T., Geron, C., Bender, L., Dennis, R., Tonnesen, G., and Guenther, A.: Influence of increased isoprene emissions on re-gional ozone modeling, J. Geophys. Res., 103, 25 611–25 630, 1998.
Salvador, R., Mantilla, E., Castell, N., Stein, A., Hernandez, L., and Millan, M.: Analysis of Meteorological Conditions during Pho-tochemical Episodes over South-West of the Iberian Peninsula, 6th Annual Meeting of the EMS/6th ECAC, EMS2006-A-00314, 2006.
Sillman, S., Carroll, M. A., Thornberry, T., Lamb, B. K., Westberg, H., Brune, W. H., Faloona, I., Tan, D., Hurst, J. M., Shepson, P. B., Sumner, A., Hastie, D. R., Mihele, C. M., Apel, E. C., Riemer, D. D., and Zika, R. G.: Loss of isoprene and sources of nighttime OH radicals at a rural site in the U.S.: Results from photochemical models, J. Geophys. Res., 107(D5), 4043, doi:10.1029/2001JD000449, 2002.
Simpson, D., Guenther, A., Hewitt, C. N., and Steinbrecher, R.: Biogenic emissions in Europe 1. Estimates and uncertainties, J. Geophys. Res., 100(D11), 22 875–22 890, 1995.
Stein, D. and Alpert, P.: Factor separation in numerical simulations, J. Atmos. Sci., 50, 2107–2115, 1993.
Tao, Z., Larson, M. S., Wuebbles, D., Williams, A., and Caughey, M.: A summer simulation of biogenic contributions to ground-level ozone over the continental United States, J. Geophys. Res., 108(D14), 4404, doi:10.1029/2002JD002945, 2003.
Thunis, P. and Cuvelier, C.: Impact of biogenic emissions on ozone formation in the Mediterranean area. A BEMA modeling study, Atmos. Environ., 39, 317–334, 2000.