HAL Id: hal-02931899
https://hal.archives-ouvertes.fr/hal-02931899v2
Submitted on 9 Sep 2020
HAL is a multi-disciplinary open access
archive for the deposit and dissemination of
sci-entific research documents, whether they are
pub-lished or not. The documents may come from
teaching and research institutions in France or
abroad, or from public or private research centers.
L’archive ouverte pluridisciplinaire HAL, est
destinée au dépôt et à la diffusion de documents
scientifiques de niveau recherche, publiés ou non,
émanant des établissements d’enseignement et de
recherche français ou étrangers, des laboratoires
publics ou privés.
Distributed under a Creative Commons Attribution| 4.0 International License
TSE Inaugural Lecture 2020: What Can History Teach
Us About the Potential Consequences of COVID-19?
Victor Gay
To cite this version:
Victor Gay. TSE Inaugural Lecture 2020: What Can History Teach Us About the Potential
Conse-quences of COVID-19?. Master. Inaugural Lecture, France. 2020. �hal-02931899v2�
What Can History Teach Us About the Potential
Consequences of COVID–19?
Victor Gay
University of Toulouse 1 Capitole Toulouse School of Economics Institute for Advanced Study in Toulouse
September 2020
A Few Words About Me
•
In UT1 since September 2018:
• Assistant Professor at TSE.
• Research Fellow at IAST.
•
Education: University of Chicago 2018.
•
Fields: economic history, economics of culture, political economy.
•
Dissertation: “The Legacy of the Missing Men: World War I and
Female Labor in France Over a Century.”
A Few Words About My Teaching
•
Teaching in 2020–2021:
• M1 S1: Economic History.• M1 S1: Applied Econometrics + group supervision.
• M2 PPD S2: Institutions and Long-Run Development.
• M2 ETE S2: Development (Part 2: Economic History, with M. Saleh).
• DEEQA S2: Natural Experiments in History (with M. Saleh).
• Supervision of M1 and M2 theses.
•
Contact:
• Email: [email protected].
• Office: T.458.
• Website: victorgay.me
What can history teach us about the potential
consequences of COVID–19?
Context
•
Most serious health and economic crisis of 21st century:
• Since December 2019: nearly 900k fatalities, 26M cases.
• No natural immunity, no cure yet.
• Large-scale non-pharmaceutical interventions.
• Large economic downturn, e.g., France: 2020 Q2/2019 Q2: −19%.
• Euro area 2020 GDP forecast: −11% to −9%.
=⇒ Critical juncture.
•
Economic history can some provide guidance.
Does the past have useful economics?
More Economic Facts
•
More facts about economic growth
• Penn World Tables: real GDP PPP 182 countries since 1950.
• Maddison project database: real GDP since 1000.
•
More facts about populations:
• IPUMS USA: full count censuses 1850–1950.
• IPUMS NAPP: full count censuses North Atlantic starting 1703.
(Often) Better Economic Facts
•
Populations: no anonymity rule.
• IPUMS USA: linked samples across censuses.
• TRA France: linked families (vital and inheritance records).
•
Full companies’ records and manufacturing censuses.
•
Cautious approach to data as constructed objects.
(Often) Better Economic Facts
•
Populations: no anonymity rule.
• IPUMS USA: linked samples across censuses.
• TRA France: linked families (vital and inheritance records).
•
Full companies’ records and manufacturing censuses.
•
Cautious approach to data as constructed objects.
(Often) Better Economic Facts
•
Populations: no anonymity rule.
• IPUMS USA: linked samples across censuses.
• TRA France: linked families (vital and inheritance records).
•
Full companies’ records and manufacturing censuses.
•
Cautious approach to data as constructed objects.
Better Economic Theory
•
Economic history to build economic theory.
• Kaldor stylized facts and neoclassical growth.
• Ricardo and rising land rents.
•
Economic history to test economic theory.
• Variety of past experiences and policy responses.
• Better identification through exogenous variation.
Better Economic Theory
•
Economic history to build economic theory.
• Kaldor stylized facts and neoclassical growth.
• Ricardo and rising land rents.
•
Economic history to test economic theory.
• Variety of past experiences and policy responses.
• Better identification through exogenous variation.
Better Economic Theory
•
Economic history to build economic theory.
• Kaldor stylized facts and neoclassical growth.
• Ricardo and rising land rents.
•
Economic history to test economic theory.
• Variety of past experiences and policy responses.
• Better identification through exogenous variation.
Better Economics
•
Learn about mechanisms through institutional knowledge.
•
Analyze long-run processes.
•
Answer the big questions.
=⇒ Design better economic policy.
McCloskey (1976) Abramitzky (2015) Cantoni and Yuchtman (2020)
Better Economics
•
Learn about mechanisms through institutional knowledge.
•
Analyze long-run processes.
•
Answer the big questions.
=⇒ Design better economic policy.
McCloskey (1976) Abramitzky (2015) Cantoni and Yuchtman (2020)
Better Economics
•
Learn about mechanisms through institutional knowledge.
•
Analyze long-run processes.
•
Answer the big questions.
=⇒ Design better economic policy.
McCloskey (1976) Abramitzky (2015) Cantoni and Yuchtman (2020)
Better Economics
•
Learn about mechanisms through institutional knowledge.
•
Analyze long-run processes.
•
Answer the big questions.
=⇒ Design better economic policy.
McCloskey (1976) Abramitzky (2015) Cantoni and Yuchtman (2020)
Economics and History Intertwined
•
Economics emphasizes generality: the “imperial science”?
Stigler (1984)
• Substitution and income effects.
• Equilibrium responses.
• Law of Demand.
•
Reality of economic mechanisms is historically conditioned.
Arrow (1985)
•
Context is crucial to determine equilibrium responses.
Approach of this Lecture
•
Characterize features COVID–19 crisis.
•
Find commonalities (and differences) with past crises.
•
Leverage past experiences.
•
Useful references:
Alfani and Murphy (2017) Arthi and Parman
(2020) Beach, Clay, and Saavedra (2020)
Plan
•
Features of COVID-19 in Historical Perspective
•
Lessons from the Influenza Pandemic of 1918–1919
•
Lessons from the Great Depression of the 1930s
COVID–19 in historical perspective
COVID–19 in Historical Perspective
•
Epidemiology of COVID–19.
•
Demographic and distributional effects.
•
Policy responses.
=⇒ Characterization will generate natural historical counterparts.
•
Health effects: Influenza (1918–1919).
•
Economic effects: Great Depression (1930s).
COVID–19 in Historical Perspective
•
Epidemiology of COVID–19.
•
Demographic and distributional effects.
•
Policy responses.
=⇒ Characterization will generate natural historical counterparts.
•
Health effects: Influenza (1918–1919).
•
Economic effects: Great Depression (1930s).
Comparison Set
=⇒ Epidemic risks were (nearly) part of everyday life.
Epidemics Period Regions Deaths
Antonine Plague 160–180 Roman Empire 10–30%
Plague of Cyprian 249–270 Roman Empire 15–25%
Justinian plague 540–541 Eu., Med. 25–50M, 25–50%
Black Death 1347–1352 Eu. to Asia ∼50M, 35–60% (Eu)
Italian plague 1629–1632 North. Italy 2M , 30–35%
Columbian Exchange 1492–1650 Americas 80–90%
Cholera Pandemics 1–6 1817–1923 Worldwide 1M+
Third Plague 1850s–1900s China, India 12M
Russian Flu 1889–1890 Russia, Asia, Eu. 1M
Some Major Historical Epidemics
Data fromAlfani and Murphy (2017)
Comparison Set
Major 19th-century Epidemics in NYC
Figure fromBeach, Clay, and Saavedra (2020)using data fromRosenwaike (1972)and other primary sources.
A Word of Caution
COVID–19 data are provisional
Epidemiology of COVID–19: Spatial Diffusion
•
Very rapid and global diffusion (World Mapper’s dynamic cartogram).
•
Similar patterns in past pandemics: along trade routes, trading
centers (Amsterdam, London, Venice. . . ).
•
Most common with worldwide spread of 1918–1919 Influenza.
Epidemiology of COVID–19: Spatial Diffusion
•
Very rapid and global diffusion (World Mapper’s dynamic cartogram).
•
Similar patterns in past pandemics: along trade routes, trading
centers (Amsterdam, London, Venice. . . ).
•
Most common with worldwide spread of 1918–1919 Influenza.
Epidemiology of COVID–19: Spatial Diffusion
Worldwide Spread of 1918–1919 Influenza Pandemic
Data for 48 countries fromBarro, Ursua, and Weng (2020).
Epidemiology of COVID–19: Rate of Transmission
•
Basic reproductive rate (R
0): average number of secondary infections
produced by a typical case in a population where everyone is susceptible.
•
Estimates: 1.8–3.6, though debated.
Petersen et al. (2020)
•
Comparable to 1918 Influenza, yellow fever, or SARS: ∼ 3.
•
Much lower than measles, with R
0of above 10.
Epidemiology of COVID–19: Rate of Transmission
Basic Reproduction Rates and Case Fatality Rates Across Epidemics
Data fromArthi and Parman (2020).
Epidemiology of COVID–19: Severity
•
Measuring COVID–19 severity while unfolding is challenging:
• Case fatality rate: death from COVID / diagnosed cases of COVID.
• Crude mortality rate: death from COVID / total population.
• Infection fatality rate: death from COVID / cases of COVID.
•
Current average worldwide CFR ' 3% (variation across time/space).
•
Influenza 1918–1919 CFR ' 2.5%.
•
Much lower than Ebola, or smallpox.
=⇒ Initial spread, transmission, severity comparable to Influenza.
Epidemiology of COVID–19: Rate of Transmission
0 5 10 15 20Case fatality rate (%)
3/1/2020 5/1/2020 7/1/2020 9/1/2020
World France Italy UK US
Case Fatality Rates
Data fromECDCandourworldindata.org.
Demographic and Distributional Effects
−20 0 20 40 60 80 Excess mortality (%)Jan Mar May Jul
15−64 65−74 75−84 85+
Excess Mortality in 2020 vs 2015–2019 by Age in France
Data fromECDCandourworldindata.org.
Demographic and Distributional Effects
−20 0 20 40 60 80 Excess mortality (%)Jan Mar May Jul
15−64 65−74 75−84 85+
Excess Mortality in 2020 vs 2015–2019 by Age in France
Data fromECDCandourworldindata.org.
Demographic and Distributional Effects
•
Old age and worse baseline health.
•
Low SES: compounded risks.
• High contact jobs, continuing during pandemic.
• Likely low-paying jobs, more likely women and minorities.
• Differential access to healthcare.
•
Low SES more affected during Influenza (more later).
•
Difference with Influenza: W shape in age susceptibility.
Demographic and Distributional Effects
Median Excess Mortality Rate by Age and Sex (13 countries).
Figure fromMurray et al. (2006)
Policy Response
•
Absent of cure and limited medical capacities:
=⇒ Widespread non-pharmaceutical interventions (NPIs).
• Shutdowns • Travel restrictions
• Quarantines
• Social distancing
• Mask wearing
•
Open, linked, updated dataset
Desvars-Larrive et al. (2020) Sci Data
•
Quarantines very common in the past, some NPI during Influenza.
•
Generally not as stringent and generalized as today.
Policy Response
•
Absent of cure and limited medical capacities:
=⇒ Widespread non-pharmaceutical interventions (NPIs).
• Shutdowns• Travel restrictions • Quarantines
• Social distancing
• Mask wearing
•
Open, linked, updated dataset
Desvars-Larrive et al. (2020) Sci Data
•
Quarantines very common in the past, some NPI during Influenza.
•
Generally not as stringent and generalized as today.
Lessons from the Influenza Pandemic of 1918–1919
The 1918 Influenza Pandemic
•
Key features:
• Brief: Spring 1918–early 1919 (last wave in 1920 in some countries).
• Worldwide diffusion (with substantial variation).
• Severe fatalities: 20–50M deaths.
• Some countries implemented NPIs.
•
Useful to think about some potential consequences of COVID–19.
• Short-run health and economic consequences.
• Medium-run economic effects of NPIs.
• Long-run health consequences.
Key Empirical Issues
•
Measurement of mortality.
• Limited capacities for classification.
• Political pressure and timely information in wartime. =⇒ Scholars rely on excess mortality from all causes.
•
Simultaneity of WWI (e.g., France).
• 180k civilians, 30k soldiers. Darmon (2000) Guenel (2004)
• Civilian fatalities: 74 d´epartements (Statistique Sanitaire de la France)
• Military fatalities: no disaggregation (Statistique M´edicale).
• No correlation with military death rates. Boehnke and Gay (2020)
Key Empirical Issues
•
Measurement of mortality.
• Limited capacities for classification.
• Political pressure and timely information in wartime. =⇒ Scholars rely on excess mortality from all causes.
•
Simultaneity of WWI (e.g., France).
• 180k civilians, 30k soldiers. Darmon (2000) Guenel (2004)
• Civilian fatalities: 74 d´epartements (Statistique Sanitaire de la France) • Military fatalities: no disaggregation (Statistique M´edicale).
• No correlation with military death rates. Boehnke and Gay (2020)
What Explains Distribution of Influenza Fatalities?
Clay, Lewis, and Severnini (2019a)
•
Focus on U.S. case: better data, no WWI on soil.
•
Total death toll: 600–700k in 1918.
•
Spread from WWI bases and through troops movements.
•
Evidence from the 438 cities >10k residents (1915–1925).
What Explains Distribution of Influenza Fatalities?
Clay, Lewis, and Severnini (2019a)
•
Focus on U.S. case: better data, no WWI on soil.
•
Total death toll: 600–700k in 1918.
•
Spread from WWI bases and through troops movements.
•
Evidence from the 438 cities >10k residents (1915–1925).
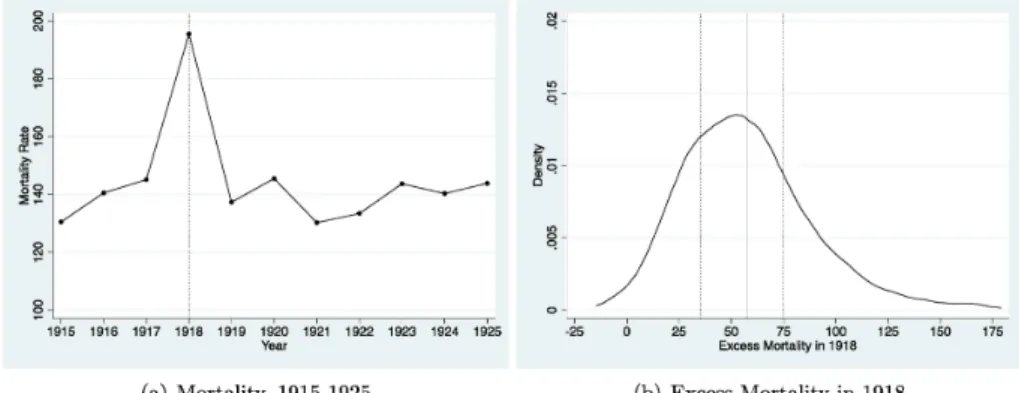
What Explains Distribution of Influenza Fatalities?
•
Measuring influenza mortality:
• Predict 1918 mortality using city linear trend over 1915–1925.
Mct = αc+ βct + εct
• αc: city-specific intercept; βc: city-specific trend; 1918 excluded.
• Excess mortality: Mc1918− bMc1918
•
Similar results if predict 1918 with 1915–1917 data.
What Explains Distribution of Influenza Fatalities?
All-age Mortality Across U.S. Cities
Figure fromClay, Lewis, and Severnini (2019a)
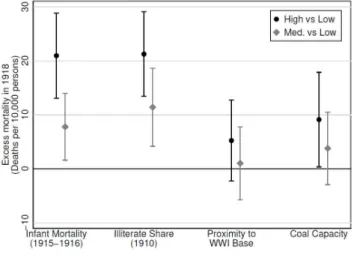
What Explains Distribution of Influenza Fatalities?
•
Pre-pandemic city-level characteristics analyzed:
• Health conditions: infant mortality (1915–1916).
• Economic conditions: illiteracy rate (1910).
• Timing of pandemic: proximity to WWI base.
• Environmental pollution: coal-fired electricity capacity.
•
Regress excess mortality on these characteristics + share of urban
population through a multivariate regression.
What Explains Distribution of Influenza Fatalities?
Determinants of Excess Mortality in 1918
Figure fromBeach, Clay, and Saavedra (2020)using estimates fromClay, Lewis, and Severnini (2019)
What Explains Distribution of Influenza Fatalities?
•
Influenza more deadly in locations with worse baseline:
• Health environmentAcuna-Soto, Vibond, and Chowell (2011) Bootsma and Ferguson (2007)
• Overall incomeGrantz et al. (2016) Tuckel et al. (2016) • Air qualityClay, Lewis, and Severini (2019b)
=⇒ Aggravated pre-pandemic socioeconomic disparities.
•
Some issues:
• Mostly focus on U.S. case.
• Few individual-level studies.
What Were the Economic Effects of Influenza?
•
Short-run macroeconomic effects
Barro, Ursua, and Weng (2020)
• Panel 43 countries (1901–1929). Flu death rates ' 2%
• Did flu deaths (and war deaths) generated differential changes across countries in rates of economic growth?
• ↑ 1pp flu death rates =⇒ ↓ 3% real GDP per K.
• In aggregate: pandemic =⇒ ↓ 6% real GDP per K.
•
Medium-run economic effects (within-country analyzes):
• Italy: ↓ 6.5% real GDP, recover by 1922. Carillo and Jappelli (2020) • Denmark: short-lived ↓ income growth. Dahl et al. (2020)
• Complicated by WWI deaths and war production (esp. in U.S.).
What Were the Economic Effects of Influenza?
•
Short-run macroeconomic effects
Barro, Ursua, and Weng (2020)
• Panel 43 countries (1901–1929). Flu death rates ' 2%• Did flu deaths (and war deaths) generated differential changes across countries in rates of economic growth?
• ↑ 1pp flu death rates =⇒ ↓ 3% real GDP per K.
• In aggregate: pandemic =⇒ ↓ 6% real GDP per K.
•
Medium-run economic effects (within-country analyzes):
• Italy: ↓ 6.5% real GDP, recover by 1922. Carillo and Jappelli (2020) • Denmark: short-lived ↓ income growth. Dahl et al. (2020)
• Complicated by WWI deaths and war production (esp. in U.S.).
What Were the Economic Effects of NPIs?
•
U.S. cities implemented non-pharmaceutical interventions (NPIs).
Markel et al. (2007)
• NPIs: school closures, quarantines, bans on public assemblies.
• Information for 43 cities with weekly influenza fatalities data.
• NPI Intensity : cumulative number of days with each NPI.
• More intensive toward the West.
What Were the Economic Effects of NPIs?
NPI Intensity Across 43 U.S. Cities
Figure fromCorreia, Luck, and Verner (2020)using data fromMarkel et al. (2007)
What Were the Economic Effects of NPIs?
Correia, Luck, and Verner (2020)
•
Health effects:
• NPIs flattened the mortality curve.
• High NPI cities: 45% ↓ in peak mortality relative to the mean.
•
Is there a trade-off between economic and health effects?
• Positive effects: mitigates transmission and lowers mortality.
• Negative effects: short-run economic disruptions while in place.
•
Impact of NPIs on city-level economic activity.
• Manufacturing employment (1904, 1909, 1914, 1919–1927).
• Total national bank assets (1910–1925, annual frequency).
What Were the Economic Effects of NPIs?
•
Dynamic difference-in-differences specification:
Y
ct= α
c+ τ
t+
X
j 6=1914β
jNPI
c1
j =t+
X
j 6=1914X
cγ
j1
j =t+ ε
ct• αc: city FE; τt: year FE.
• Xc: city-level pre-pandemic population and employment controls.
•
Control for pre-treatment differences which relationship with
outcomes might have changed over time.
•
Faster growing cities (West) were more likely to implement NPIs.
•
Discussions of pre-trends:
Lilley et al. (2020) Correia et al. (2020)
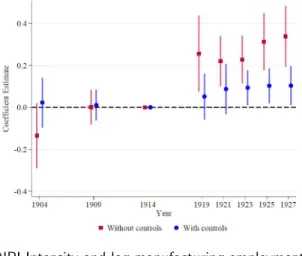
What Were the Economic Effects of NPIs?
NPI Intensity and log manufacturing employment
Figure fromCorreia, Luck, and Verner (2020)
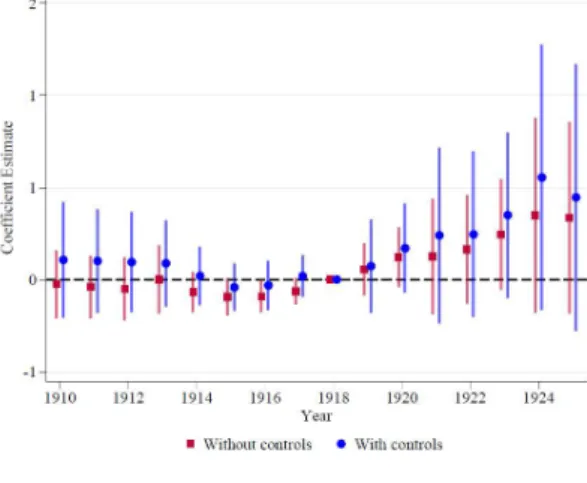
What Were the Economic Effects of NPIs?
NPI Intensity and log national bank assets
Figure fromCorreia, Luck, and Verner (2020)
What Were the Economic Effects of NPIs?
•
Little evidence for negative economic effects of NPIs.
•
NPIs did not disrupt economic activities (no business closures).
•
If anything, positive effects: through mitigating pandemics?
•
Highly dependent on context e.g., deadly to prime-age workers.
Were There Scarring Effects of Influenza?
Almond (2006)
•
Long-run scarring effects through in utero exposure (“fetal origins”)?
•
Socioeconomic outcomes in 1960–1980 depending on birth quarter.
•
Long-lasting compared to adjacent cohorts:
• Disability rates.
• Human capital accumulation.
• Income level.
Were There Scarring Effects of Influenza?
1980 Male Disability Rates by Quarter of Birth
Figure fromAlmond (2006)
Were There Scarring Effects of Influenza?
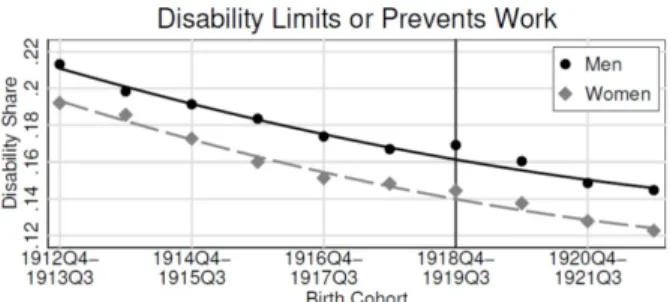
1970 Disability Rates by Year of Birth
Figure fromBeach, Clay, and Saavedra (2020)using results fromAlmond (2006)
Were There Scarring Effects of Influenza?
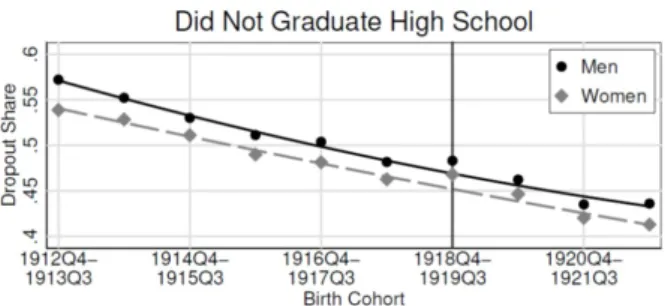
1970 High School Dropout Rates by Year of Birth
Figure fromBeach, Clay, and Saavedra (2020)using results fromAlmond (2006)
Were There Scarring Effects of Influenza?
1970 Poverty Rates by Year of Birth
Figure fromBeach, Clay, and Saavedra (2020)using results fromAlmond (2006)
Were There Scarring Effects of Influenza?
•
Causal effect from Influenza exposure?
• Resources reallocation toward healthier siblings. Parman (2015) • WWI veterans + selected =⇒ 1919 cohort from lower SES.
Brown and Thomas (2018)
• Most results hold even with linked census data + DiD strategy.
Beach, Ferrie, and Saavedra (2018)
•
Comparative evidence for Taiwan, Japan, Sweden, Switzerland, Brazil.
Lin and Liu (2014) Ogasawara (2017) Helgeretz and Bengtsson (2019)
Neelsen and Stratmann (2012) Guimbeau et al. (2020)
Other Influenza Effects
•
Fertility:
• Drop in fertility during, baby boom after (e.g., Norway, Sweden).
Mamelund (2004) Boberg-Fazlic et al (2017) • WWI as confounding factor.
Abramitzky et al. (2011) Boehnke and Gay (2020)
•
Political economy
• Increased voting for extremist parties (e.g., Germany)? Blickle (2020) • Lower trust in institutions and politicians ? Aassve et al. (2020)
•
Inequality
• Increased inequality (e.g., Italy)? Galletta and Giommoni (2020)
•
Migration
• Increased internal mobility (e.g., India)? Donaldson Keniston (2016)
Limits to Comparisons with Influenza
•
Human capital accumulation:
• School closures were less stringent than today.
• Baseline and returns to education were much lower.
•
Gender inequality:
• Female labor force participation rates were much lower.
• Indirect effects through income shocks.
•
Effects of NPIs:
• Less stringent and less disruptive.
=⇒ For economic effects, the Great Depression more useful.
Lessons from Great Depression of the 1930s
Scarring Effects of the Great Depression?
The Great Depression in the U.S.
Figure fromMoulton (2017). Lebergott vs Darby: workers in government sponsored work programs considered unemployed.
Scarring Effects of the Great Depression?
•
Long-run scarring effects through in utero exposure to negative
income shocks in Great Depression.
Fishback and Thomasson (2014)
•
Labor market entry scarring.
Moulton (2017)
• Assess long-term impact of entering labor market in 1929–1930.
• Cohorts 1911–1920.
• RDD: compare entering before/after 1930 of 8th graders.
• Running variable: birth year with cutoff = 1916 assuming entry at 14.
• Outcome: income in 1940 census.
Scarring Effects of the Great Depression?
•
RD specification:
Y
isc= α + β
1D
isc+ β
2dist 1916
isc+ β
3dist 1916
isc× D
isc+ BPL
s+ ε
isc • Disc: 1 (birth yearisc ≥ 1916).• dist 1916isc: birth yearisc− 1916.
• BPLs: birth state FE.
•
β
1: discontinuity of entering labor market in 1929 vs 1930.
•
β
2: trend in relationship between Y and birth year.
•
β
3: differences in trends across cutoff.
Scarring Effects of the Great Depression?
Discontinuity in labor market conditions
Figure fromMoulton (2017).
Scarring Effects of the Great Depression?
Regression discontinuity of log(income).
Figure fromMoulton (2017).
Scarring Effects of the Great Depression?
•
Earnings penalties (15%) for less-educated in high shock states.
•
Threats to identification: endogenous entry decision.
• Limited options to borrow and prolonging education.
• Little evidence of differences in educational attainment.
• Different to today.
•
Occupational and residential displacement of younger cohorts.
Arthi, Eriksson, and Richardson (2020)
•
Small silver-lining: move to later dynamic sectors.
Scarring Effects of the Great Recession?
•
Another historical case: 2007–2012 Great Recession.
•
No long-run perspective, but some evidence (US).
Rothstein (2020)
• 2009–2015 entrants have 2–3% lower employment rates compared to pre-crisis entrants.
• Only 2009 entrants have lower earnings (2%).
• Employment scarring permanent, wage scarring temporary.
• Employment break for entrants began in 2005.
=⇒ If health-economy trade-off, especially acute in current context.
Conclusion
•
History can be a useful guide for policy.
•
Absent of interventions:
• Low SES individuals bear disproportionate burden of health crisis.
• Labor market entrants bear disproportionate burden of economic crisis.
• Long-lasting scarring effects.
•
More historical evidence needed:
• Original features of COVID–19: combines health and economic crises. =⇒ How will these interact?
• Scarring effects for young children (school closures, distancing, masks)?
• Consequences for gender inequality, esp. working mothers?
Conclusion
•
History can be a useful guide for policy.
•
Absent of interventions:
• Low SES individuals bear disproportionate burden of health crisis.
• Labor market entrants bear disproportionate burden of economic crisis. • Long-lasting scarring effects.
•
More historical evidence needed:
• Original features of COVID–19: combines health and economic crises. =⇒ How will these interact?
• Scarring effects for young children (school closures, distancing, masks)?
• Consequences for gender inequality, esp. working mothers?
Thank you for your attention!
References
• Aassve, A., Alfani, G., Gandolfi, F., and Le Moglie, M. 2020. “Epidemics and Trust: The Case of the Spanish Flu.” IGIER Working Paper 661.
• Abramitzky, R. 2015. “Economics and the Modern Economic Historian.” The Journal of Economic History, 75(4).
• Abramitzky, R, Delavande, A., and Vasconcelos, L. “Marrying Up: The Role of Sex Ratio in Assortative Matching.” American Economic Journal: Applied Economics, 3(3).
• Acuna-Soto, R., Viboud, C., and Chowell, G. 2011. “Influenza and Pneumonia Mortality in 66 Large Cities in the United States in Years Surrounding the 1918 Pandemic.” PLoS ONE, 6(8).
• Alfani, G. and Murphy, T. E. 2017. “Plague and Lethal Epidemics in the Pre-Industrial World.” The Journal of Economic History, 77(1).
• Almond, D. 2006. “Is the 1918 Influenza Pandemic Over? Long-Term Effects of In Utero Influenza Exposure in the Post-1940 U.S. Population.” Journal of Political Economy, 114(4).
• Arrow, K. 1985. “Economic History: A Necessary Thought Not Sufficient Condition for an Economist: Maine and Texas.” American Economic Review, 75(2).
• Arthi, V. and Parman, J. 2020. “COVID–19: The View from Historical Crises.” Working Paper.
References
• Barro, R. J., Ursua, J. F., and Weng, J. 2020. “The Coronavirus and the Great Influenza Pandemic: Lessons from the ”Spanish Flu” for the Coronavirus’s Potential Effects on Mortality and Economic Activity.” NBER Working Paper 26866.
• Beach, B., Clay, K., and Saavedra, M. H. 2020. “The 1918 Influenza Pandemic and its Lessons for COVID–19.” NBER Working Paper 27673.
• Beach, B., Ferrie, J. P., and Saavedra, M. H. 2018. “Fetal Shock or Selection? The 1918 Influenza Pandemic and Human Capital Development.” NBER Working Paper 24725.
• Blickle, K. 2020. “Pandemics Change Cities: Municipal Spending and Voter Extremism in Germany, 1918–1933.” Federal Reserve Bank of New York Staff Report 921.
• Boberg-Fazlic, N., Ivets, M., Karlsson, M., and Nilsson, T. 2017. “Disease and Fertility: Evidence from the 1918 Influenza Pandemic in Sweden.” IZA Discussion Paper 10834.
• Boehnke, J. and Gay, V. 2022. “The Missing Men: World War I and Female Labor Force Participation.” Journal of Human Resources, 57(4).
• Bootsma, M. C. J. and Ferguson, N. M. 2007. “The Effect of Public Health Measures on the 1918 Influenza Pandemic in U.S. Cities.” PNAS, 104(18).
References
• Brown, R. and Thomas, D. 2018. “On the Long-Term Effects of the 1918 U.S. Influenza Pandemic.” Working Paper.
• Cantoni, D. and Yuchtman, N. 2020. “Historical Natural Experiments: Bridging Economics and Economic History.” NBER Working Paper 26754.
• Carillo, M. and Jappelli, T. 2020. “Pandemics and Local Economic Growth: Evidence from the Great Influenza in Italy.” CEPR Discussion Paper 14849.
• Clay, K, and Lewis, J., and Severnini, E. 2019. “What Explains Cross-City Variation in Mortality During the 1918 Influenza Pandemic? Evidence from 438 U.S. Cities.” Economics & Human Biology, 35.
• Clay, K, and Lewis, J., and Severnini, E. 2019. “Pollution, Infectious Disease, and Mortality: Evidence from the 1918 Spanish Influenza Pandemic.” The Journal of Economic History, 78(4).
• Correia, S., Luck, S., and Verner, E. 2020. “Pandemics Depress the Economy, Public Health Interventions Do Not: Evidence from the 1918 Flu.” Working Paper.
• Dahl, C. M., Hansen, C. W., and Jensen, P. S. 2020. “The 1918 Epidemic and a V-Shaped Recession: Evidence from Municipal Income Data.” CEPR Covid Economics, 6(17).
• Darmon, P. 2001. “Une Trag´edie dans la Trag´edie : la Grippe Espagnole en France (Avril 1918–Avril 1919).” Annales de D´emographie Historique, 2.
References
• Descars-Larrive, A., et al. 2020. “A Structured Open Dataset of Government Interventions in Response to COVID–19.” Scientific Data, 7.
• Donaldson, D. and Keniston, D. 2016. “How Positive Was the Positive Check? Investment and Fertility in the Aftermath of the 1918 Influenza in India.” Working Paper.
• Fishback, P. V. and Thomasson, M. A. 2014. “Hard Times in the Land of Plenty: The Effect on Income and Disability Later in Life for People Born During the Great Depression.” Explorations in Economic History, 54.
• Galleta, S. and Giommoni, T. 2020. “The Effect of the 1918 Influenza Pandemic on Income Inequality: Evidence from Italy.” Working Paper.
• Guenel, J. 2004. “La Grippe Espagnole en France en 1918–1919.” Histoire des Sciences M´edicales, 38(2).
• Guimbeau, A., Menon, N., and Musacchio, A. 2020. “The Brazilian Bombshell? The Long-Term Impact of the 1918 Influenza Pandemic the South American Way.” NBER Working Paper 26929.
• Grantz, K. H., et al. 2016. “Disparities in Influenza Mortality and Transmission Related to Sociodemographic Factors within Chicago in the Pandemic of 1918.” PNAS, 113(48).
References
• Helgertz, J. and Bengtsson, T. 2019. “The Long-Lasting Influenza: The Impact of Fetal Stress During the 1918 Influenza Pandemic on Socioeconomic Attainment and Health in Sweden, 1968–2012.” Demography, 56.
• Lilley, A., Lilley, M., and Rinaldi, G. 2020. “Public Health Interventions and Economic Growth: Revisiting The Spanish Flu Evidence.” Working Paper.
• Lin, M-J. and Liu, E. M. 2014. “Does in Utero Exposure to Illness Matter? The 1918 Influenza Epidemic in Taiwan as a Natural Experiment.” Journal of Health Economics, 37.
• Mamelund, S. E. 2004 “Can the Spanish Influenza Pandemic of 1918 Explain the Baby Boom of 1920 in Neutral Norway?” Population, 59(2).
• Markel, H., et al. 2007. “Nonpharmaceutical Interventions Implemented by US Cities During the 1918-1919 Influenza Pandemic.” JAMA, 298(6).
• McCloskey, D. N. 1976. “Does the Past Have Useful Economics?” Journal of Economic Literature, 14(2).
• Moulton, J. G. 2017. “The Great Depression of Income: Historical Estimates of the Longer-Run Impact of Entering the Labor Market during a Recession.” The B.E. Journal of Economic Analysis & Policy, 17(4).
• Murray, C. J. L. et al. 2006. “Estimation of Potential Global Pandemic Influenza Mortality on the Basis of Vital Registry Data from the 1918–20 Pandemic: a Quantitative Analysis.” The Lancet, 368(9554).
References
• Neelsen, S. and Stratmann, T. 2012. “Long-Run Effects of Fetal Influenza Exposure: Evidence from Switzerland.” Social Science & Medicine., 74(1).
• Ogasawara, K. 2017. “Persistence of pandemic influenza on the development of children: evidence from industrializing Japan.” Social Science & Medicine., 181.
• Parman, J. 2015. “Childhood Health and Sibling Outcomes: Nurture Reinforcing Nature during the 1918 Influenza Pandemic.” Explorations in Economic History, 58.
• Petersen E. et al. 2020. “Comparing SARS-CoV-2 with SARS-CoV and Influenza Pandemics.” The Lancet: Infectious Diseases, 20(9).
• Roshstein, J. 2020. “The Lost Generation? Labor Market Outcomes for Post Great Recession Entrants.” NBER Working Paper 27516.
• Stigler, G. J. 1984. “Economics: The Imperial Science?” The Scandinavian Journal of Economics, 86(3).
• Tuckel, P., Sassler, S., Maisel, R., and Leykam, A. 2006. “The Diffusion of the Influenza Epidemic of 1918 in Hartford, Connecticut.” Social Science History, 30(2).