RESEARCH OUTPUTS / RÉSULTATS DE RECHERCHE
Author(s) - Auteur(s) :
Publication date - Date de publication :
Permanent link - Permalien :
Rights / License - Licence de droit d’auteur :
Bibliothèque Universitaire Moretus Plantin
Institutional Repository - Research Portal
Dépôt Institutionnel - Portail de la Recherche
researchportal.unamur.be
University of Namur
Evoq
Clarinval, Antoine; Linden, Isabelle; Wallemacq, Anne; Dumas, Bruno
Published in:
Proceedings of the 2018 ACM Symposium on Document Engineering
Publication date:
2018
Document Version
Publisher's PDF, also known as Version of record
Link to publication
Citation for pulished version (HARVARD):
Clarinval, A, Linden, I, Wallemacq, A & Dumas, B 2018, Evoq: a Visualization Tool to Support Structural
Analysis of Text Documents. in Proceedings of the 2018 ACM Symposium on Document Engineering. ACM
Press, The 18th ACM Symposium on Document Engineering, Halifax, Canada, 28/08/18.
General rights
Copyright and moral rights for the publications made accessible in the public portal are retained by the authors and/or other copyright owners and it is a condition of accessing publications that users recognise and abide by the legal requirements associated with these rights. • Users may download and print one copy of any publication from the public portal for the purpose of private study or research. • You may not further distribute the material or use it for any profit-making activity or commercial gain
• You may freely distribute the URL identifying the publication in the public portal ?
Take down policy
If you believe that this document breaches copyright please contact us providing details, and we will remove access to the work immediately and investigate your claim.
Evoq: a Visualization Tool to Support Structural Analysis of Text
Documents
Antoine Clarinval
PReCISE research center, University of Namur Namur, Belgium
Isabelle Linden
FOCUS research center, University of Namur Namur, Belgium
Anne Wallemacq
CIRCE research center, University of Namur Namur, Belgium
Bruno Dumas
PReCISE research center, University of Namur Namur, Belgium
ABSTRACT
Structural analysis is a text analysis technique that helps uncovering the association and opposition relationships between the terms of a text. It is used in particular in the field of humanities and social sciences. This technique is usually applied by hand with pen and paper as support. However, as any combination of words in the raw text may be considered as an association or opposition relationship, applying the technique by hand in a readable way can quickly prove overwhelming for the analyst. In this paper, we propose Evoq, an application that provides support to structural analysts in their work. Furthermore, we present interactive visualizations representing the relationships between terms. These visualizations help create alternative representations of text, as advocated by structural analysts. We conducted two usability evaluations that showed great potential for Evoq as a structural analysis support tool and for the use of alternative representations of texts in the analysis.
CCS CONCEPTS
• Human-centered computing → Information visualization; • Applied computing → Document management and text processing;
KEYWORDS
Structural Analysis, Text Visualization, Relationships Visualization, Tool Support
ACM Reference Format:
Antoine Clarinval, Isabelle Linden, Anne Wallemacq, and Bruno Dumas. 2018. Evoq: a Visualization Tool to Support Structural Analysis of Text Documents. In DocEng ’18: ACM Symposium on Document Engineering 2018, August 28–31, 2018, Halifax, NS, Canada. ACM, New York, NY, USA, 10 pages. https://doi.org/10.1145/3209280.3209533
Publication rights licensed to ACM. ACM acknowledges that this contribution was authored or co-authored by an employee, contractor or affiliate of a national govern-ment. As such, the Government retains a nonexclusive, royalty-free right to publish or reproduce this article, or to allow others to do so, for Government purposes only. DocEng ’18, August 28–31, 2018, Halifax, NS, Canada
© 2018 Copyright held by the owner/author(s). Publication rights licensed to Associa-tion for Computing Machinery.
ACM ISBN 978-1-4503-5769-2/18/08. . . $15.00 https://doi.org/10.1145/3209280.3209533
1
INTRODUCTION
Over the past decades, the text visualization research field has been gaining increasing interest. Applications offering such visual rep-resentations are now commonplace and widely used for various concerns.
The plethora of domains benefiting from text visualization is well illustrated by the hundreds of application examples surveyed in the Text Visualization Browser (TVB) [14]. Examples in the TVB cover, among others, sentiment analysis, topic analysis and relationships analysis.
Structural analysis is a text analysis technique that falls in the latter domain. It is used especially by researchers in the field of humani-ties. It consists in matching related terms manually, as a technique that helps to uncover the relationships between the terms of a text whether explicitly stated in the text or not. For instance, when an author uses the term white to denote a color in a text, white also carries the set of its evocations (pure, bland, etc.). This allows the structural analyst to have a comprehensive vision of the evocations gravitating around the terms of the text he analyzes.
The drawback of this technique is that it is burdensome to use by hand since the aforementioned representations of terms become quickly tedious to capture from raw text annotations. Still, the place of the analyst is central to structural analysis to detect the relevant relationships that constitute the author’s representations. This tech-nique relies heavily on human serendipity and as such is hard to fully automatize. We argue that the right approach is a balance be-tween a fully-automated analysis and a fully-manual analysis, that is, a tool supporting the analyst, providing him automated features and visualizations to make his work less burdensome while giving him complete freedom as regards the relationships to be included or excluded in the analysis.
The remaining of this paper is organized as follows. Section 2 presents an overview of the related work in text visualization. In Section 3, we explain the structural approach as well as the interest of a tool to support its users. Section 4 details the functioning of Evoq, the tool we propose to support structural analysis. In Section 5, the usability of Evoq is assessed by two evaluations. Section 6 details the limitations of our work and plans future work. Sec-tion 7 closes the paper with concluding remarks and recalls the contributions.
2
RELATED WORK
There has been a growing interest for text visualization techniques in the past two decades. Recently, taxonomies have been published in order to organize the field [26][1][8][15][4]. The most complete taxonomy to this day is the aforementioned TVB [14]. The authors provide a fine-grained classification of techniques and a free-access online1tool that allows browsing a catalogue of 4002techniques that can be interactively filtered following their taxonomy. Filtering the TVB by analytic task and by data source gives an overview of the text visualization techniques existing for relation-ships visualization. A vast majority of them involves the analysis of text corpora or text streams. In the context of structural analysis, the analysis of a single text is of greater relevance. Various work on visualizing relationships between terms of a single text are brought up below.
In 1995, Hearst presented TileBars, a tile visualization showing where looked up terms appear in a text, each tile representing a text chunk. Looking up several terms at once allows observing the co-occurrence of terms in text chunks. In 2002, Paley proposed TextArc to visualize the distribution of terms in a text with a cir-cular representation. All the terms of the text are shown at once, hence allowing the analysis of co-occurrence relationships between them.
In 2003, Brandes and Corman [3] proposed a representation of dy-namic networks of words. They argued that animating between consecutive states of a network is not sufficient for a rich analysis of the changes that occurred. Thus, they proposed to "represent each step of network’s evolution as a layer in a three-dimensional visual-ization". A layer could represent a text chunk such as a paragraph or a speech turn in a conversation. The resulting representation is an overlay of all the layers. Other work such as Word Tree [30] also provide visualizations to represent consecutiveness relationships between words or groups of words.
In 2009, van Ham et al. [27] presented Phrase Net, a node-link in-teractive visualization that extracts relationships between terms with keywords such as ’s, of, etc. Keywords can be predefined or user-defined.
The same year, Rusu et al. [23] proposed Semantic Graphs, which extracts a subject-verb-object triplet from each sentence of a text and represents these triplets as relationships in a node-link visual-ization. The terms are then merged according to WordNet synsets. Collins et al. [5] proposed to use a sunburst visualization to repre-sent hyponymy relationships from WordNet. Their tool, DocuBurst, allows choosing a text and generating a sunburst with a term from the text as root. A tile visualization shows the distribution of the WordNet hyponyms in the text.
These visualization techniques involve a fully automatic relation-ship generation based on rules (e.g. consecutiveness of words [3, 30], co-occurrence of terms [11, 20], presence of keywords [27] or syn-tactic sentence structure [23]). This is a heavy limitation in our case since structural analysis sets no decision criterion stating when terms should be in a relationship [29].
Wallemacq et al. presented in [29] a tool specifically designed for structural analysis. It allows analysts to specify relationships by
1http://textvis.lnu.se/ 2As of January 23, 2018
themselves according to the rules of structural analysis and to visu-alize the relationships network on a 2D node-link or a 3D landscape interactive representation. The authors identified two important future works, namely the development of automatic relationships suggestion modules and the integration of external relationships databases such as WordNet.
The tool we propose allows structural analysts to encode associa-tion and opposiassocia-tion relaassocia-tionships in a fast way using an adjacency matrix representation. Furthermore, it provides a highly interactive node-link visualization showing the relationships chosen by the analyst. This representation can be built by interaction through-out the analysis, as the addition of relationships can done on the visualization itself. It also implements efficient automated relation-ships suggestion approaches, one of which integrating an external resource.
3
AN EXPERT-BASED APPROACH TO TEXT
DOCUMENT ANALYSIS
Structural text analysis is a qualitative text analysis technique in-troduced in [22] used by researchers in the field of humanities. Applying it, the analyst attempts to uncover the relationships be-tween terms (i.e. single words or groups of words) in a text. In doing so, he represents a text as a network of terms linked with others either by conjunction (the terms have the same connotation) or by disjunction (the terms have an opposite connotation). In the structural analysis point of view, the meaning of a term is given by the relationships it has with other terms, which are not necessarily used in the text [29].
The interest of this approach is illustrated in Critchfield [6]. Critch-field shows that understanding how one puts a term in relationship with others can explain why there can be different interpretations for a same text. He takes the example of a behavior specialist ad-dressing the parents of a child who has just been diagnosed with autism. In his discourse, he proposes extinction as a treatment. As a result, he receives a weird look from the parents. The term extinc-tion, which connotation is usually perceived as negative because it reminds of the species extinction, can also be perceived as positive since extinction (i.e. procedure to reduce the occurrence of a behav-ior) is a type of care in the field of behavioral analysis. This example illustrates well that representations of terms (that is, relationships with other terms) can be preexisting. In structural analysis, it is said that the speaker of a discourse (or the author of a text) is caught in the power of words, that is, the words carry preexisting evocations that escape his control. Another example, from the humanities field, is detailed in [29]. The authors analyze the discourse of a doctor who works in a crisis management center. In her discourse, she values the crisis center which is able to make the right decisions in hindsight. However, structural analysis helps identifying a shift in her discourse towards a powerless and frustrating vision of the cri-sis center which is not on the field and can therefore only imagine what the situation really is with its hands tied.
Researchers usually apply structural analysis manually, with a pen and the paper-printed text, working paragraph by paragraph. They annotate the text accordingly when they detect a relationship. This way of doing leads to several problems. First, the relationships can
Evoq: a Visualization Tool to Support Structural Analysis of Text Documents DocEng ’18, August 28–31, 2018, Halifax, NS, Canada
be preexisting or scattered in the text [28]. In other words, a rela-tionship can exist between two distant terms of a text which is a major threat to the legibility of the annotations. Second, it is tedious to keep an overview of the analysis undertaken, especially if the text does not fit on one page.
The pitfalls of manual structural analysis logically set the objectives of our work. We study how providing alternative visual representa-tions of the aforementioned annotated text could make structural analysts’ work less burdensome. However, we do not rely on fully-automated approaches because the place of the analyst is central to structural analysis to detect the relevant relationships that con-stitute the author’s representations. As explained earlier, a core principle of structural analysis is to rely on the serendipity of this relationships uncovering process. Furthermore, the meaning of a term is defined by the relationships it has with other terms. Thus, the meaning varies throughout the text as new relationships are uncovered by the analyst. This greatly complicates the full automa-tion of structural analysis. Thus, our work lies in the middle of a fully-automated solution where an algorithm mines the whole rela-tionships set from the text and a fully-manual approach such as the pen-and-paper way of working described earlier. While relying on visualization techniques and automated relationships suggestion, we intend to leave the analyst a complete freedom concerning the relationships to include in the analysis.
In the next section we present Evoq, the tool we propose to support structural analysts in the process of encoding the relationships and analyzing the evocation network they form with an interactive visualization.
4
EVOQ: A TOOL SUPPORTING STRUCTURAL
ANALYSIS
Evoq is the result of the iterative refinement of a prototype which was periodically assessed. The functioning and the functionality are detailed in the remaining of the present section.
4.1
Overall functioning
Technologies and High-Level Architecture. Evoq was developed using web technologies and the d3.js3library. This library allows developing dynamic visualizations in Javascript [2] and operates smoothly with other web languages. Moreover, running Evoq on a web browser allows taking advantage from the built-in features such as zooming. Finally, using web technologies eases the distribution of the tool and makes updates burdenless to the users.
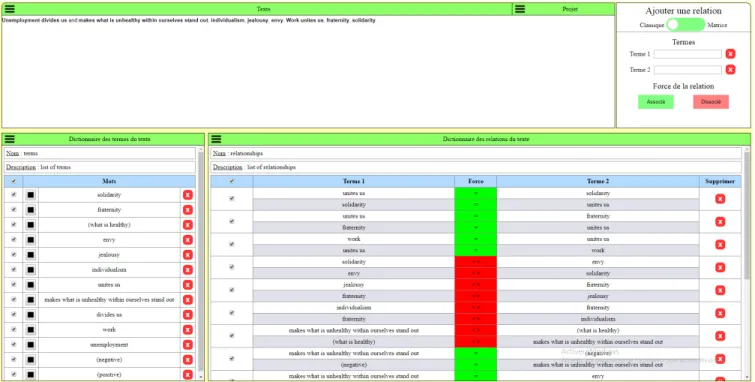
Evoq consists of one HTML page (Figure 1) from which the user can select a text to analyze, encode relationships and generate interactive visualizations which are displayed on a distinct tab of the browser.
Lemmatization. Since Evoq works with words, lemmatization is an important issue. It can indeed not be guaranteed that the users will always define relationships between lemmas. However, different inflectional forms (e.g. llama, llamas) are considered as different character strings from a computer point of view. Hence, lemmatization is needed to consider different inflectional forms as the same concept. In order to make lemmatization transparent to
3https://d3js.org/
the users, the terms are lemmatized when a relationship is defined. Regarding implementation, we chose to use the TreeTagger lem-matizer [24] for two reasons. First, it achieves high precision (more than 96%). Second, it works for the main European languages.
4.2
Encoding
The analyst can encode a detected relationship in two ways. First, the more classical way of proceeding is to enter the two terms of the relationship in input fields and specify the type (disjunction or conjunction) of the relationship. Any word or group of consecutive words can be chosen as a term. Although faster than paper annota-tions, the process can prove time consuming over the analysis. In order to accelerate the encoding, an adjacency matrix of the terms in the text (Figure 4) is provided. Instead of explicitly selecting the terms of the relationships to encode, a relationship can be added by clicking on the intersection of the relevant terms in the matrix. The advantage of this encoding method is threefold. First, it re-quires much less clicks since the user doesn’t have to select the terms. The number of clicks required for adding x relationships in the classical way is 5x, whereas it is 1+1.5x (1 click for a con-junction, 2 for a disjunction) with the matrix. Second, the matrix displays the key terms of two consecutive paragraphs, which is thoroughly consistent with the paragraph-by-paragraph working of structural analysts explained in Section 3. Third, the adjacency matrix is a visualization in itself and represents relationships with great efficiency regarding most analytic tasks [9].
4.3
Relationships Visualization
The goal of text visualizations in the context of structural analysis is to allow the analysts to get knowledge which extraction would be tedious and dull with the raw text and the table of the encoded relationships only. In other words, the added value of a computer tool lies in the provision of interactive visualizations. In this regard, Robert Kosara (quoted in [7]) insightfully writes: "Nobody wants to look at a table of data, even if it’s their own". This quote illustrates well the need for visualizations. Again, a mere list of conjunctions and disjunction is of no more help than a pen and paper for struc-tural analysts.
In the first place, it is important to understand the structure of the data to visualize. Gibson et al. define a graph as "a set of nodes and a set of edges such that an edge describes the existence of a relationship between two nodes" [10]. According to this definition, the data to visualize, that is, a set of terms and of relationships between them, is a graph.
Four visualization techniques were considered for Evoq, namely the word cloud, the node-link diagram, the chord diagram and the adjacency matrix.
Word cloud. The word cloud is a two-dimensional space where words are written in a size that reflects their frequency [17]. It is a convenient way to have a quick overview of the main terms of a text. It was considered for this reason, as a fast way for the analyst to identify the terms that are important for the text’s author. However, it does not represent relationships between terms and is consequently not further detailed here.
Figure 1: Main page
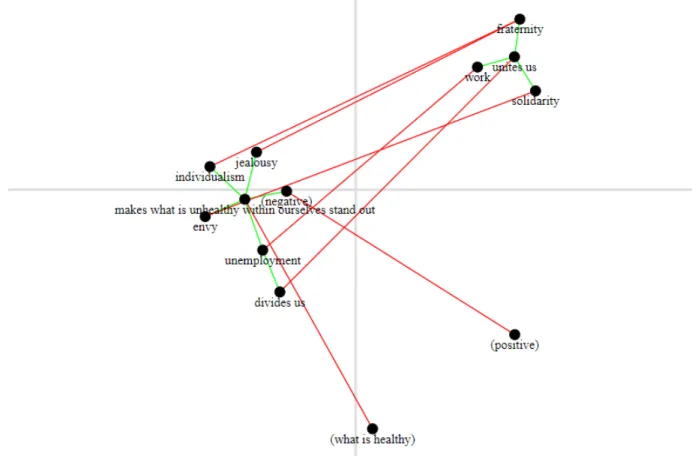
Node-link Diagram. Graph data is often represented by a node-link diagram [9]. Thus, the node-node-link diagram visualization was considered in the first place in the development of Evoq. Figure 2 shows an example of the node-link diagram as implemented in Evoq. The terms are represented as labelled black disks and the disjunctions (resp. conjunctions) are represented as red (resp. green) lines connecting the disks.
The usability evaluations showed that the node-link diagram is the visualization that offers the most added value to structural analysts, and a major contribution of our research. Therefore, it is further detailed in Subsection 4.5.
Chord diagram. The chord diagram is an alternative to the node-link diagram for representing graph data. It is a set of arcs drawing one circle and of chords connecting two arcs. An arc is a portion of the circumference of the circle corresponding to a node and a chord is a portion of the circle connecting two arcs [12]. Thus, a chord corresponds to a link. Figure 3 shows the chord diagram as implemented in Evoq.
The chord diagram was considered as a trade-off between the interactivity of the node-link diagram and the scalability of the adjacency matrix. However, it did not prove itself useful nor relevant during the usability evaluations. The chord diagram is thereby not further detailed here.
Adjacency Matrix. The adjacency matrix has the advantage of being dramatically less sensitive to the graph size than the node-link diagram [9]. Thus, it is more efficient than the node-link diagram for analytic tasks such as finding the most connected node or looking for a link between two vertices [9].
In Evoq, the adjacency matrix is used as a relationships visualization
in itself as well as a fast encoding module (Subsection 4.2). It allows keeping a view on the already existing relationships and to encode new ones in a fast way at the same time. It can also prevent mistakes such as encoding the same relationship twice. Figure 4 shows an example of the matrix visualization. Regarding interaction, users can remove terms from the matrix and build a new relationships set by selecting and deselecting relationships of their choosing.
4.4
Linking and Brushing
Wills [31] writes that visualizations are linked if "when the user interacts with one view [...], the other views will update and show the result of such an interaction". The interaction is performed with a brush, which Wills defines as "a shape dragged around the views by the user, and performs some operation on the graphical elements it passes over". Hence, linking and brushing occurs when visualiza-tions are reacting to an operation performed by a brush on another visualization. Keim [13] argues that visualizations bound with link-ing and brushlink-ing are more informative than the same visualizations considered independently.
Several interaction features in the node-link diagram have link-ing and brushlink-ing with the main page: addition and deletion of relationships and node color changing.
4.5
Node-link Diagram
The advantage of the node-link diagram is that it is fairly immer-sive for a two-dimensional visualization, which is a key feature of a visualization suited for structural analysis [28]. It represents well the field metaphor that typifies structural analysis. In this way, it al-lows meaningful interaction features such as the drag and drop of a node. The node-link diagram was implemented with the d3.js force
Evoq: a Visualization Tool to Support Structural Analysis of Text Documents DocEng ’18, August 28–31, 2018, Halifax, NS, Canada
Figure 2: Node-link diagram example. Red (resp. green) links denote opposition (resp. association) relationships.
Figure 3: Chord diagram example
Figure 4: Adjacency matrix example. Red (resp. green) squares denote opposition (resp. association) relationships.
layout. The layout has parameters than can be set to define how nodes react to each other in the initial positioning and the dragging (attraction or repulsion) [32]. In this way, the layout reflects the
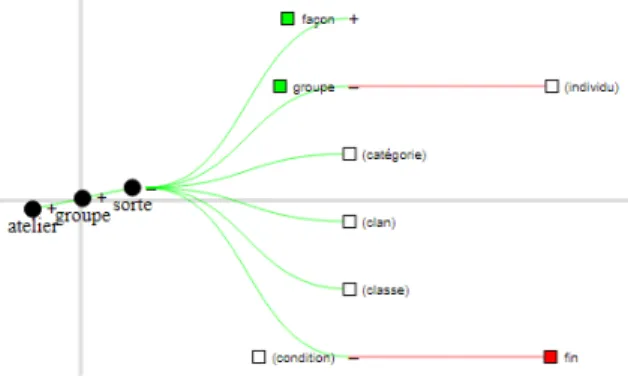
Figure 5: Synonyms/antonyms tree for the term sorte
association (resp. opposition) between terms through attraction (resp. repulsion) in the interaction.
Moreover, the node-link diagram integrates a comprehensive syn-onyms / antsyn-onyms dictionary which was kindly provided to us by the University of Caen (France)4. The synonyms and antonyms of a term up to the third order (i.e. the synonyms of the synonyms of the synonyms) are represented in the form of an interactive collapsible tree (Figure 5). The tree offers the structural analyst a convenient way to explore the set of evocations of a term. Hence, it automatically suggests opposition and association relationships. Other relationship suggestion approaches are detailed in Subsection 4.6. In order to make the node-link diagram as useful as possible, numerous interaction features were implemented:
• Drag and drop of a node
• Add a relationship between two terms on the graph • Add a relationship between a term and its synonym/antonym • Delete a relationship
• Delete a node
• Show and hide connected components
• Focus one or more terms (the unconnected nodes and links are obscured)
• Deploy a collapsible tree of synonyms and antonyms (Figure 5)
• Select and add relationships from the collapsible tree • Fix the position of a node on the diagram
• Hide all the links
• Change the color hue of a term disk (the color hue as a categorical attribute [19] provides an efficient channel to the analyst that wishes to organize the terms according to a criterion he deems relevant in his analysis)
The ability to add relationships allows us to distinguish two ways of using the node-link representation.
On the one hand, the user can generate all the synonymy and antonymy relationships between the terms of the text as well as the resulting node-link diagram. He can then select the connected components of interest and carry on his work on the representation. This use of the tool follows Shneiderman’s Information Seeking Mantra "Overview first, zoom and filter, then details-on-demand." [25]. The overview consists of the diagram presented by default to the user which represents all the relationships he has encoded or
4http://www.crisco.unicaen.fr/
Figure 6: Relationship suggestion with the counter-text ap-proach
generated. The zoom and filter consists of a connected components filtering feature which allows the user to have information about the connected components and to hide or show them in the diagram. The focus interaction also falls in this part of the mantra. Finally, the details-on-demand consists of an expandable synonyms / antonyms tree whose construction parameters (depth and number of children per node) are customizable.
On the other hand, the user can generate the node-link diagram from few relationships and add relationships using the synonyms / antonyms tree shown in Figure 5. The nodes thereby added on the representation also come with a synonyms / antonyms tree which can in turn be explored to enrich the diagram with additional relationships. In this way, the visualization is not provided to the user as such, but rather built on the go by the user by interaction.
4.6
Relationships suggestion
The objective of the relationships suggestion module is to propose potentially relevant relationships using automated rules. It supports the analyst by proposing him relationships that he possibly missed during the analysis. It is then up to the analyst to decide which relationships are relevant for his analysis and which are not. Four approaches were considered to propose relationships, namely the counter-text, the text-based, the Wikipedia-based and the syn-onymy approaches. They are detailed below.
The counter-text approach applies a rule that deducts a relationship from three others. The rule can be formally written as follows : let A, B, C and D be four terms. Let A-B, B-C and C-D be relationships already existing in the relationships set. Then the relationship A-D is proposed. The relationship A-D is suggested as a disjunction if there is an odd number of disjunctions among A-B, A-C and C-D and as conjunction otherwise. Figure 6 shows how the association between B and D can be inferred from the opposition between C and D, A and B, and the association between A and C.
The text-based and the Wikipedia-based approaches share the same line of thought. They consist in representing each term by a bag of words that can be compared two by two with the bag of other terms to compute a similarity metric between two terms. The similarity index for terms A and B is noted s(A,B) and is calculated as follows:
s(A, B) =2 × #(baд(A) ∩ baд(B))#baд(A) + #baд(B)
with bag(T) the bag of words representing the term T. The differ-ence between the text-based and Wikipedia-based approaches lies in the way the bag of words of a term is built. For the terms-based,
Evoq: a Visualization Tool to Support Structural Analysis of Text Documents DocEng ’18, August 28–31, 2018, Halifax, NS, Canada
the bag contains any word that appears in the same sentence as the term. For the Wikipedia-based approach the bag contains any word that appears in the first sentence of the Wikipedia page for A if a unique page exists, no similarity index can be computed otherwise. The Wikipedia-based approach draws from [21]. In order not to overwhelm the analyst, a relationship is suggested only for the three terms with the highest similarity index.
The synonymy approach relies on an external relationships base to suggest a conjunction (resp. disjunction) from a synonymy (resp. antonymy) relationship in the external base. This approach was im-plemented for the French language using the synonyms / antonyms dictionary from the University of Caen [16]5. This approach is highly language-dependent since it requires a synonyms / antonyms database for every language. For the English language, a well-known example of such a database is WordNet [18]. For other languages, many initiatives have emerged6.
Another approach that was thought of but not yet implemented in Evoq is the use of relationships sets generated by previous uses of Evoq to suggest relationships. This approach could supplement well the synonyms / antonyms approach. As previously explained, a core idea in structural analysis is that the terms have evocations gravitating around them. Thus, a useful relationships suggestion approach would be one that retrieves the set of evocations. Syn-onyms and antSyn-onyms are a decent approximation for which readily exploitable resources often exist, but evocations are not restricted to them. In this regard, completing the synonyms / antonyms dic-tionaries which the relationships defined by the analysts in Evoq could provide a more comprehensive view of the evocations. Reflection remains open to other approaches that could ease the work of the analysts. The automated rules defined in [5] and [23] are examples of approaches that are worth considering in the fu-ture.
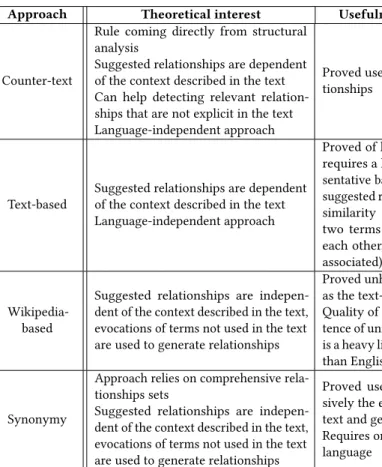
Table 1 summarizes the theoretical interest and the usefulness of the four approaches implemented in Evoq, as well as how they were integrated into the tool. The usefulness was assessed based on regular feedback received throughout the development and on the second usability evaluation.
The two approaches that have proved able to bring added value to the analysis are the counter-text and the synonymy. The former is context-dependent whereas the other is context-independent, they complement each other well in this sense.
Critchfield’s example detailed in Section 3 can be analyzed with regard to these approaches. Let us consider the following discourse, which could have been delivered by the behavior specialist in Critch-field’s example: We propose extinction as treatment to fight your child’s disorder. Manifestly, three relationships emerge: a conjuction between extinction and treatment, a disjunction between extinction and disorder and a disjunction between treatment and disorder. The synonymy approach for the English language would propose a conjunction relationship between extinction and extermination. From there, the rule of the counter-text approach suggests a con-junction relationship between treatment and extermination, which could explain the child’s parents concern. Figure 7 shows the Evoq node-link diagram of the example.
5http://www.crisco.unicaen.fr/des/
6http://globalwordnet.org/wordnets-in-the-world/
Figure 7: Evoq node-link diagram for the example described in [6]
The example illustrates well the contribution of the synonymy approach to structural analysis. Whereas classical text analysis technique tend to rule out any semantic ambiguity, structural anal-ysis considers multiple senses for the terms and advocates freedom of the analyst in the exploration of these senses. Because of its completeness, the use of a synonyms / antonyms dictionary proved especially relevant and useful in this regard.
5
EVALUATION
Two user evaluations were conducted to assess the usability of Evoq. Each involved two participants without previous experience in using the tool.
5.1
Formative evaluation
The first evaluation took place in the development stage of Evoq. Its objective was to detect interaction problems, particularly on the main page. Both users involved were students in humanities (one master student and one PhD student) who had received a brief in-troduction to structural analysis beforehand. They participated in a two-hour session during which they were asked to apply structural analysis on a text of their choosing with Evoq. Paper notes were taken throughout the session to record the problems participants stumbled upon and they were encouraged to perform think-aloud. The evaluation has led to the emergence of usability problems as well as bugs. Unclear labels and invisible features (i.e. the user did not notice that the feature existed) were especially recurrent issues. The problems were classified by severity (e.g. the extend to which the problem hindered the user’s work) and priority af-terwards. We also received feedback regarding the implemented visualizations, with the node-link diagram considered as holding the highest potential. A wrap-up discussion with the participants ended the session. Despite the identified issues, they showed great enthusiasm towards Evoq and provided valuable insight for future work.
5.2
Qualitative evaluation
The second evaluation took place after the development of Evoq. The feedback of the first evaluation had already been taken into account. The objective of this subsequent evaluation was to assess the usability of Evoq and to determine if it yields added value in comparison with manual structural analysis. It consisted of two separate one-hour sessions, one involving a professor (P3) and the other a master student (P4). The methodology was similar to the first evaluation, the participants were asked to perform structural
Table 1: Summary of the relationships suggestion approaches
Approach Theoretical interest Usefulness based on feedback Integration in Evoq
Counter-text
Rule coming directly from structural analysis
Suggested relationships are dependent of the context described in the text Can help detecting relevant relation-ships that are not explicit in the text Language-independent approach
Proved useful to uncover implicit rela-tionships
Possibility to generate visualiza-tions with or without the sug-gested relationships
Text-based
Suggested relationships are dependent of the context described in the text Language-independent approach
Proved of little help to the analysis: it requires a large text to compute repre-sentative bags of words and the type of suggested relationships is not given (the similarity index determines whether two terms have anything to do with each other, not if they are opposed of associated)
Possibility to generate an adja-cency matrix showing the sug-gested relationships
Wikipedia-based
Suggested relationships are indepen-dent of the context described in the text, evocations of terms not used in the text are used to generate relationships
Proved unhelpful for the same reasons as the text-based approach
Quality of results depends on the exis-tence of unique Wikipedia pages, which is a heavy limitation for languages other than English
Possibility to generate an adja-cency matrix showing the sug-gested relationships
Synonymy
Approach relies on comprehensive rela-tionships sets
Suggested relationships are indepen-dent of the context described in the text, evocations of terms not used in the text are used to generate relationships
Proved useful to explore comprehen-sively the evocations terms used in the text and generate relationships from it Requires one synonymy dictionary per language
Possibility to display the sug-gested relationships as collapsi-ble trees in the node-link dia-gram
analysis with a text they chose. Paper notes were taken and partici-pants were encouraged to do think-aloud.
We observed that both participants were able to explore Evoq fur-ther in comparison with the participants of the early evaluation. The results of the evaluation for the visualization techniques are detailed below.
• Word cloud : the word cloud sparked little interest because it does not represent relationships. It was unclear for P4 how the words of the cloud are determined.
• Node-link diagram : the node-link diagram was considered by both participants as by far the most useful relationships visualization technique. P4 considered the node-link dia-gram as a working environment in itself, saying that was "enjoyable to manipulate and dynamic", and that he "wants to carry on the analysis in the node-link diagram and not in the text". P3 also spent the vast majority of his analysis on the node-link diagram. Both participants enjoyed using the synonymy collapsible tree as a way to freely explore the multiple senses of terms. P3 explicitly emphasized the usefulness of the synonymy approach.
• Chord diagram : P4 showed no interest towards the chord diagram and it was considered "useless" by P3.
• Adjacency matrix : the adjacency matrix was used only as an alternative encoding module and never as separate rela-tionships visualization. P4 found this way of encoding "very
useful", but aspects of how it works were unclear to him. P3, however, preferred the classical encoding.
Regarding the relationships suggestion, the contribution of the counter-text was unclear for P4, since the relationships set he at-tempted to generate relationships from was such that no relation-ship could be proposed. The synonyms / antonyms approach and its visual integration to the node-link diagram were considered useful to explore the evocations of the terms. The other suggestion approaches were not explored by the participants. These results allowed us to assess the usefulness of the relationships suggestion approaches considered in Table 1 presented in Subsection 4.6. Overall, the participants again showed great enthusiasm towards Evoq and provided insightful improvement suggestions. For in-stance, P4 proposed to add explanatory notes to explain how visual-izations are generated and both participants suggested to improve the layout of the node-link diagram.
6
DISCUSSION AND FUTURE WORK
The usability evaluations showed that there is potential for Evoq as a structural analysis support tool. However, they also showed room for improvement of our solution.
Currently, Evoq allows encoding and visualizing relationships be-tween terms. However, they are processed as a set of independent
Evoq: a Visualization Tool to Support Structural Analysis of Text Documents DocEng ’18, August 28–31, 2018, Halifax, NS, Canada
elements. Piret [22] details how relationships can be combined to-gether to form more complex structures (e.g. hierarchically). We would like to explore how these structures are used in structural analysis and to integrate them into Evoq.
The exploration of synonymy is still in its early stages. At present, we work with a synonyms / antonyms dictionary for the French language and we have integrated the visualization of synonymy re-lationships with a collapsible tree in Evoq. However, the synonyms of a term are currently all considered as having the same weight. In the future, we plan to use the dictionary to compute synonymy scores to organize the synonyms in cliques. This approach would allow the analysts to explore the evocations of a term in a mean-ingful way.
One question that remained open throughout the development of Evoq is the layout of the node-link diagram. This issue emerged during the second evaluation with both participants. As a contribu-tion, we showed that the node-link diagram is the best approach for relationships visualization in structural analysis, but it can be improved. The main future work for Evoq is to design and imple-ment a novel graph layout algorithm better suited to the needs of structural analysis. The layout algorithm should integrate the aforementioned relationship structures, display them appropriately and provide relevant interaction features to manipulate them. The interaction should allow the user to reduce the information over-load that can occur when too many relationships are defined. Lines of thought in this regard include additional filtering features as well as relationships aggregation.
7
CONCLUSION
Structural analysis is usually performed with no other support than a pen and the text printed on paper. Still, structural analysts advocate alternative representations of the text. With Evoq, the application we propose, we explored how interactive visualizations of relationships between the terms of a text can support structural analysts in that respect. In particular, we have studied the interest of four visualization techniques (word cloud, node-link diagram, chord diagram and adjacency matrix) and of four automatic rela-tionships suggestion approaches for structural analysis.
Two usability evaluations have confirmed the high potential of Evoq as support to structural analysis. In particular, the node-link diagram with integrated collapsible trees for synonymy exploration as a dynamic analysis environment and the use of an external syn-onyms / antsyn-onyms dictionary have sparked the most interest. Our research contributes the following: 1) we have analyzed the effi-ciency of several visualization techniques as a support to structural analysts and shown that, according to our evaluations, the word cloud and the chord diagram are of little interest, whereas an inter-active node-link representation fostering freedom of exploration is the best approach, and 2) we have proposed four automated re-lationships suggestion approaches assessed by theoretical interest and usefulness in practice and shown the relevance of synonymy dictionaries for structural analysis.
In the future, we hope to refine further the node-link representation for the specific use of structural analysis and to explore its variants. We also plan to further explore how synonymy dictionaries can be leveraged.
ACKNOWLEDGMENTS
We would like to thank Prof. Michel Morel and his colleagues from the CRISCO laboratory of the University of Caen for their work on the dictionary of synonyms. This work has been partially funded by the EFFATA-MeM project from the University of Namur, and by the EFDR Wal-e-Cities project from the European Union.
REFERENCES
[1] Aretha B Alencar, Maria Cristina F de Oliveira, and Fernando V Paulovich. 2012. Seeing beyond reading: a survey on visual text analytics. Wiley Interdisciplinary Reviews: Data Mining and Knowledge Discovery 2, 6 (2012), 476–492. [2] Michael Bostock, Vadim Ogievetsky, and Jeffrey Heer. 2011. D3data-driven
documents. IEEE transactions on visualization and computer graphics 17, 12 (2011), 2301–2309.
[3] Ulrik Brandes and Steven R Corman. 2003. Visual unrolling of network evolution and the analysis of dynamic discourse. Information Visualization 2, 1 (2003), 40–50.
[4] Nan Cao and Weiwei Cui. 2016. Overview of Text Visualization Techniques. In Introduction to Text Visualization. Springer, 11–40.
[5] Christopher Collins, Sheelagh Carpendale, and Gerald Penn. 2009. Docuburst: Visualizing document content using language structure. In Computer graphics forum, Vol. 28. Wiley Online Library, 1039–1046.
[6] Thomas S Critchfield. 2017. Visuwords®: a Handy Online Tool for Estimating What Nonexperts May Think When Hearing Behavior Analysis Jargon. Behavior Analysis in Practice (2017), 1–5.
[7] Chris Culy and Verena Lyding. 2009. Visualization of linguistic information. (2009). University lecture retrieved from https://weblicht.sfs.uni-tuebingen.de/ webservices/culy_lyding_weblicht_visualization_how_to.pdf.
[8] Qihong Gan, Min Zhu, Mingzhao Li, Ting Liang, Yu Cao, and Baoyao Zhou. 2014. Document visualization: an overview of current research. Wiley Interdisciplinary Reviews: Computational Statistics 6, 1 (2014), 19–36.
[9] Mohammad Ghoniem, Jean-Daniel Fekete, and Philippe Castagliola. 2005. On the readability of graphs using node-link and matrix-based representations: a controlled experiment and statistical analysis. Information Visualization 4, 2 (2005), 114–135.
[10] Helen Gibson, Joe Faith, and Paul Vickers. 2013. A survey of two-dimensional graph layout techniques for information visualisation. Information visualization 12, 3-4 (2013), 324–357.
[11] Marti A Hearst. 1995. TileBars: visualization of term distribution information in full text information access. In Proceedings of the SIGCHI conference on Human factors in computing systems. ACM Press/Addison-Wesley Publishing Co., 59–66. [12] Amin Jalali. 2016. Supporting social network analysis using chord diagram in process mining. In International Conference on Business Informatics Research. Springer, 16–32.
[13] Daniel A Keim. 2002. Information visualization and visual data mining. IEEE transactions on Visualization and Computer Graphics 8, 1 (2002), 1–8. [14] Kostiantyn Kucher and Andreas Kerren. 2015. Text visualization techniques:
Taxonomy, visual survey, and community insights. In Visualization Symposium (PacificVis), 2015 IEEE Pacific. IEEE, 117–121.
[15] Shixia Liu, Weiwei Cui, Yingcai Wu, and Mengchen Liu. 2014. A survey on information visualization: recent advances and challenges. The Visual Computer 30, 12 (2014), 1373–1393.
[16] Jean-Luc Manguin. 2005. La dictionnairique Internet: l’exemple du dictionnaire des synonymes du CRISCO. Corela. Cognition, représentation, langage HS-1 (2005).
[17] Stanley Milgram. 1976. Psychological maps of Paris. Environmental psychology: People and their physical settings (1976), 104–124.
[18] George A Miller. 1995. WordNet: a lexical database for English. Commun. ACM 38, 11 (1995), 39–41.
[19] Tamara Munzner. 2014. Visualization analysis and design. CRC press. [20] W Bradford Paley. 2002. TextArc: Showing word frequency and distribution in
text. In Poster presented at IEEE Symposium on Information Visualization, Vol. 2002. [21] Alexander Panchenko, Sergey Adeykin, Alexey Romanov, and Pavel Romanov.
2012. Extraction of semantic relations between concepts with knn algorithms on wikipedia. In Concept Discovery in Unstructured Data Workshop (CDUD) of International Conference On Formal Concept Analysis, Belgium. 78–88. [22] Anne Piret, Jean Nizet, and Etienne Bourgeois. 1996. L’analyse structurale: une
méthode d’analyse de contenu pour les sciences humaines. De Boeck Supérieur. [23] Delia Rusu, Blaž Fortuna, Dunja Mladenic, Marko Grobelnik, and Ruben Sipoš.
2009. Document visualization based on semantic graphs. In Information Visuali-sation, 2009 13th International Conference. IEEE, 292–297.
[24] Helmut Schmid. 2013. Probabilistic part-ofispeech tagging using decision trees. In New methods in language processing. 154.
[25] Ben Shneiderman. 1996. The eyes have it: A task by data type taxonomy for infor-mation visualizations. In Visual Languages, 1996. Proceedings., IEEE Symposium on. IEEE, 336–343.
[26] Artur Šilić and Bojana Dalbelo Bašić. 2010. Visualization of text streams: A survey. In International Conference on Knowledge-Based and Intelligent Information and Engineering Systems. Springer, 31–43.
[27] Frank Van Ham, Martin Wattenberg, and Fernanda B Viégas. 2009. Mapping text with phrase nets. IEEE transactions on visualization and computer graphics 15, 6 (2009).
[28] Anne Wallemacq and Jean-Marie Jacques. 2001. Semantic Landscapes. (2001). Paper presented at the 17th Egos Conference Stanting Working Group on the Philosophy of Organization, Lyon.
[29] Anne Wallemacq, Jean-Marie Jacques, and Vincent Bruyninckx. 2004. Dans le sillage des mots...: EVOQ. Logiciel de cartographie cognitive. Presses universitaires de Namur.
[30] Martin Wattenberg and Fernanda B Viégas. 2008. The word tree, an interactive visual concordance. IEEE transactions on visualization and computer graphics 14, 6 (2008).
[31] Graham Wills. 2008. Linked data views. In Handbook of data visualization. Springer, 217–241.