HAL Id: tel-03210910
https://tel.archives-ouvertes.fr/tel-03210910
Submitted on 28 Apr 2021
HAL is a multi-disciplinary open access archive for the deposit and dissemination of sci-entific research documents, whether they are pub-lished or not. The documents may come from teaching and research institutions in France or abroad, or from public or private research centers.
L’archive ouverte pluridisciplinaire HAL, est destinée au dépôt et à la diffusion de documents scientifiques de niveau recherche, publiés ou non, émanant des établissements d’enseignement et de recherche français ou étrangers, des laboratoires publics ou privés.
Experimental Study and Multi-scale Modelling of LCF
Behaviour of Austenitic Steels Treated by SMAT
Jianqiang Zhou
To cite this version:
Jianqiang Zhou. Experimental Study and Multi-scale Modelling of LCF Behaviour of Austenitic Steels Treated by SMAT. Materials and structures in mechanics [physics.class-ph]. Université de Technologie de Troyes, 2018. English. �NNT : 2018TROY0018�. �tel-03210910�
THESE
pour l’obtention du grade de
D
OCTEUR
de l’U
NIVERSITE
DE
T
ECHNOLOGIE DE
T
ROYES
Spécialité : MATERIAUX, MECANIQUE, OPTIQUE ET NANOTECHNOLOGIE
présentée et soutenue par
Jianqiang ZHOU
le 28 juin 2018
Experimental Study and Multi-scale Modelling of LCF Behaviour
of Austenitic Steels Treated by SMAT
JURY
M. G. HENAFF PROFESSEUR DES UNIVERSITES Président
M. L. DELANNAY PROFESSEUR Examinateur
M. X. FEAUGAS PROFESSEUR DES UNIVERSITES Rapporteur
Mme P. KANOUTE INGENIEUR DE RECHERCHE ONERA Examinateur
Mme D. RETRAINT PROFESSEUR DES UNIVERSITES Directrice de thèse
M. Z. SUN ENSEIGNANT CHERCHEUR UTT Directeur de thèse
To my family, my teachers and my friends.
I
ACKNOWLEDGEMENTS
First and foremost, I would like to express my deepest gratitude to my supervisors, Dr. Zhidan Sun and Prof. Delphine Retraint, for their superior guidance, considerable support and encouragement throughout my PhD study at UTT. I would also like to extend my sincere thanks to Dr. Pascale Kanouté for her instructive advice and essential assistance of the theoretical studies in my thesis.
My sincere thanks should also go to the rest of the thesis committee members: Prof. Gilbert Hénaff, Prof. Xavier Feaugas, Prof. Lakhdar Taleb, as well as Prof. Laurent Delannay, for their patience to examine my work and giving insightful comments.
Moreover, I would like to express my special thanks to Prof. Hongqian Xue in NWPU for his kindly help and encouragement from my undergraduate study. He recommended me for this valuable opportunity of the PhD research.
I am greatly indebted to the colleagues in UTT, who gave me many help in technical support, experimental experiences, and valuable advices. They are Dr. Bruno Guelorget, Mr. François Weil, Prof. Manuel François, Prof. Xiaolu Gong, Dr. Yugang Li, Mr. Laurent Daniel, and other colleagues of LASMIS.
Besides, I would like to sincerely appreciate my friends in UTT for their company and help in both my work and daily life in France.
Last but not least, I would like to show my most sincere appreciation to my family, relatives, teachers and friends for supporting, encouraging and helping me throughout my life and career. Forever bless you!
Jianqiang Zhou April 2018, at Troyes
II
Abstract
This work focuses on experimental analysis and multi-scale modelling of LCF behaviour of 316L steels treated by SMAT. The gradient microstructure features of a 316L steel treated by SMAT are characterized by EBSD, XRD and hardness tests. Grain size gradient, residual stress and plastic deformation are evaluated. The cyclic hardening/softening behaviour of the SMATed specimens and the evolution of the microstructures during cyclic loading are studied based on LCF tests and EBSD observations. A comparison between SMAT and conventional shot peening is performed by analysing the surface topography, residual stress fields, and work hardening profiles of the treated specimens as well as their effects on LCF life.
A modelling methodology of residual stress and work hardening is developed including constitutive modelling, reconstruction technique, and cyclic loading simulation. First, a macroscopic constitutive modelling of the cyclic plasticity behaviour of a 316L steel is performed. Then, a self-consistent modelling of the cyclic hardening/softening behaviour is developed. Afterwards, a new method for reconstructing residual stress and work hardening is proposed and applied to a SMATed structure. Both of the previous macroscopic and microscopic models are used to predict the cyclic behaviour of the SMATed material.
Keywords: SMAT, Austenitic stainless steel, Low cycle fatigue, Multi-scale modelling, Residual stresses, Work hardening.
III
Résumé
Ce travail de thèse est focalisé sur des caractérisations microstructurales, des essais de fatigue et une modélisation multi-échelle du comportement en fatigue oligocyclique d’aciers 316L nanocristallisés superficiellement par SMAT. Le gradient de taille de grains superficiel, les contraintes résiduelles et l’écrouissage générés sont évalués à l’aide de différentes techniques : EBSD, DRX et essais de dureté. Le durcissement/adoucissement cyclique des éprouvettes SMATées et l'évolution de la microstructure au cours du chargement cyclique sont ensuite étudiés grâce à des essais de fatigue et des observations par EBSD. Une comparaison entre le SMAT et le grenaillage conventionnel est réalisée en analysant la topographie de surface, les champs de contraintes résiduelles et les profils d’écrouissage générés. Les effets de ces deux traitements sur la durée de vie en fatigue oligocyclique sont également étudiés.
Une méthodologie de modélisation des contraintes résiduelles et de l’écrouissage est par ailleurs développée. Elle comporte une modélisation multi-échelle, la reconstruction des contraintes résiduelles et de l’écrouissage ainsi que la simulation du chargement cyclique. Une modélisation macroscopique de la plasticité cyclique de l’acier est d’abord réalisée. Une approche auto-cohérente du durcissement/adoucissement cyclique est ensuite développée. Enfin, une nouvelle méthode de reconstruction des contraintes résiduelles et de l’écrouissage est proposée et appliquée à une structure SMATée.
Mots clefs: Nanocristallisation superficielle, Acier inoxydable, Fatigue oligocyclique, Comportement cyclique, Modélisation multi-échelle, Contraintes résiduelles, Ecrouissage
IV
CONTENTS
GENERAL INTRODUCTION ... 1
CHAPTER 1: LITERATURE REVIEW ... 3
1.1 INTRODUCTION TO SHOT PEENING TECHNOLOGIES ... 3
1.1.1 Conventional shot peening and SMAT ... 3
1.1.2 Nanostructured surface layer ... 5
1.1.3 Residual stress ... 6
1.1.4 Work hardening ... 8
1.2 EXPERIMENTAL STUDY OF SHOT PEENED AND SMATED MATERIAL ... 9
1.2.1 Gradient microstructure features ... 9
1.2.2 Mechanical properties ... 10
1.2.3 Residual stress relaxation ... 14
1.3 MULTI-SCALE MODELLING OF SHOT PEENED AND SMATED MATERIALS ... 16
1.3.1 Introduction to multi-scale modelling ... 16
1.3.2 Simulation of shot peening process ... 17
1.3.3 Modelling of residual stress and work hardening ... 20
1.3.4 Cyclic plasticity modelling of 316L ... 25
1.4 SCOPE OF THE THESIS ... 29
CHAPTER 2: EXPERIMENTAL STUDY OF LCF BEHAVIOUR OF A 316L STEEL TREATED BY SMAT... 31
2.1 MATERIAL AND EXPERIMENTAL PROCEDURE ... 31
2.2 CHARACTERIZATION OF GRADIENT MICROSTRUCTURE FEATURES ... 33
2.2.1 Metallurgical state of the SMATed material ... 33
2.2.2 Surface nanocrystallization ... 36
2.2.3 XRD patterns analysis ... 38
2.3 LCF ANALYSIS OF THE SMATED MATERIAL ... 42
2.3.1 Cyclic stress amplitude ... 42
2.3.2 Hysteresis loops ... 44
2.3.3 Cyclic hardening/softening ... 45
2.4 MICROSTRUCTURE EVOLUTION DURING CYCLIC LOADING ... 48
2.4.1 Plastic slips ... 48
2.4.2 Misorientation ... 49
2.4.3 Grain size ... 51
V
CHAPTER 3: COMPARISON BETWEEN SMAT AND CONVENTIONAL SHOT PEENING ... 53
3.1 MATERIAL AND EXPERIMENTAL PROCEDURE ... 53
3.2 SURFACE CHARACTERISTICS ... 54
3.2.1 Surface topography ... 54
3.2.2 Surface roughness analysis ... 58
3.3 GRADIENT PROPERTIES ... 61 3.3.1 Microstructure observations ... 61 3.3.2 Residual stresses ... 62 3.3.3 FWHM ... 64 3.4 NANOINDENTATION MEASUREMENTS ... 67 3.4.1 Young’s modulus ... 68 3.4.2 Hardness ... 69 3.4.3 Discussion ... 70 3.5 LCF PROPERTIES ... 73
3.5.1 Cyclic behaviour analysis ... 74
3.5.2 Fatigue life ... 78
3.5.3 Fracture surface analysis ... 81
3.6 CONCLUSIONS ... 83
CHAPTER 4: CYCLIC BEHAVIOUR ANALYSIS AND CONSTITUTIVE MODELLING OF 316L STEELS ... 85
4.1 MATERIAL AND EXPERIMENTAL PROCEDURES ... 85
4.2 ANALYSES OF MONOTONIC AND CYCLIC BEHAVIOUR ... 88
4.2.1 Monotonic behaviour ... 88
4.2.2 Bauschinger effect ... 89
4.2.3 Hysteresis loops ... 90
4.3 CONSTITUTIVE MODELLING AND PARAMETER IDENTIFICATION ... 96
4.3.1 Classical combined kinematic/isotropic hardening constitutive model ... 96
4.3.2 Strain range memory effect ... 98
4.3.3 Non-linear kinematic hardening rule ... 99
4.3.4 Identification procedure and strain range memory effect modelling ... 100
4.3.5 Summary of the constitutive modelling and the identification results ... 107
4.4 RESULTS AND DISCUSSION ... 109
4.4.1 Initial tensile behaviour ... 109
4.4.2 Cyclic behaviour ... 111
4.4.3 Discussion on the non-linear kinematic hardening rule ... 114
4.5 CONCLUSIONS ... 116
CHAPTER 5: SELF-CONSISTENT MODELLING OF A 316L STEEL ... 118
VI
5.1.1 Single crystal plasticity ... 119
5.1.2 Transition rule for the polycrystal ... 121
5.1.3 Homogenization method ... 123
5.2 NUMERICAL IMPLEMENTATION AND CYCLE JUMP METHOD ... 123
5.2.1 Numerical implementation ... 124
5.2.2 Cycle jump approach ... 124
5.3 PARAMETER IDENTIFICATION ... 126
5.3.1 Basic material parameters ... 126
5.3.2 Grain number ... 127
5.3.3 Cyclic hardening/softening behaviour ... 128
5.4 RESULTS AND DISCUSSION ... 131
5.4.1 Results of identification ... 131
5.4.2 Grain discretization effect ... 132
5.4.3 Strain rate effect ... 133
5.5 CONCLUSION ... 134
CHAPTER 6: MULTI-SCALE MODELLING OF LCF BEHAVIOUR OF SMATED MATERIALS ... 135
6.1 BASIC THEORIES AND ANALYSIS ... 135
6.2 RECONSTRUCTION OF RESIDUAL STRESS ... 140
6.3 RECONSTRUCTION OF WORK HARDENING... 143
6.3.1 Discussion element about work hardening ... 143
6.3.2 Reconstruction of work hardening at microscopic scale ... 146
6.3.3 Reconstruction of work hardening with macroscopic model ... 152
6.3.4 Discussion on the reconstruction method ... 154
6.4 MODELLING OF LCF BEHAVIOUR OF SMATED MATERIAL ... 155
6.4.1 FE modelling of the SMATed specimen ... 155
6.4.2 Results and discussion ... 157
6.5 CONCLUSION ... 163
CHAPTER 7: CONCLUSIONS AND PROSPECTS ... 165
7.1 CONCLUSIONS ... 165
7.2 PROSPECTS ... 167
RÉSUMÉ EN FRANÇAIS ... 170
APPENDIX ... 197
APPENDIX A:ELECTROLYTIC POLISHING A CYLINDRICAL STRUCTURE ... 197
APPENDIX B:CALIBRATION RESULTS FOR THE MACROSCOPIC CYCLE CONSTITUTIVE MODELLING ... 198
APPENDIX C:EULER ANGLES OF THE 50 GRAINS FOR SELF-CONSISTENT MODELLING WORK IN CHAPTER 5 ... 200
VII
List of Tables
Tab. 2-1. Nominal chemical composition (wt.%) of the studied 316L stainless steels. ... 31 Tab. 2-2. SMAT conditions for the 316L steel. ... 33 Tab. 3-1. Almen intensity and coverage of SMAT and CSP for different specimens and with
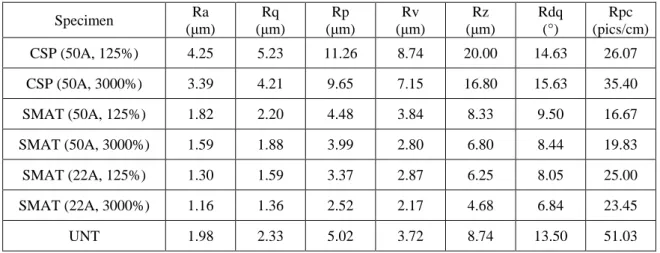
the corresponding SMAT conditions. ... 54 Tab. 3-2. Average surface roughness parameters for the specimens with different treatment
conditions. ... 58 Tab. 3-3. Nanoindentation parameters. ... 68 Tab. 3-4. Experimental conditions used for LCF tests. ... 74 Tab. 3-5. Number of cycles to failure of specimens treated by SMAT and CSP under
different strain amplitudes. ... 79 Tab. 4-1. Basic mechanical properties of the two 316L steels obtained from the monotonic
tensile curves. ... 89 Tab. 4-2. Effective stress in the tensile-going phase of the first cycle for different strain
amplitudes. ... 90 Tab. 4-3. Typical extreme values of kinematic hardening coefficient 𝜑... 104 Tab. 4-4. Summarized description of the cyclic constitutive model. ... 107 Tab. 4-5. Material parameters of the developed cyclic constitutive model identified for the
steel 316L-A. ... 108 Tab. 5-1. Typical extreme values of kinematic hardening coefficient 𝜑𝑠. ... 121 Tab. 5-2. Values of six independent constants in the interaction matrix 𝐻𝑠𝑟. ... 126 Tab. 5-3. Material parameters for the macroscopic model under strain amplitude of ±1.25%. ... 128 Tab. 5-4. Material parameters of the developed cyclic constitutive model identified for the
steel 316L-A. ... 131 Tab. 6-1. Parameters for residual stress calculation. ... 143 Tab. 6-2. Stress state of typical elements in impacted state within the sample (MPa). .... 150 Tab. 6-3. Stress state of typical elements in unloaded state within the sample (MPa). .... 151 Tab. 6-4. Three initial configurations for the FE simulation. ... 156
VIII
List of Figures
Fig. 1-1. Sketch of (a) conventional shot peening and (b) SMAT. ... 4 Fig. 1-2. Illustration of the Multi-scale nature of residual stresses in polycrystals [43,44]. . 7 Fig. 1-3. Illustration of gradient microstructure features generated by SMAT. (a): schematic
presentation of gradient microstructure; (b): typical TEM observations of ultrafine grains at the top surface for SMATed AISI 304 stainless steel [16] and (c): in depth variations of the grain/cell size and the mean microstrain from the treated surface of SMATed Fe sample [24]. ... 10 Fig. 1-4. (a) Grain size distribution in the region at about 6–8 µm beneath the polished top
surface; (b): comparison of tensile true stress–strain curves for the nanocrystalline layer and the coarse-grain 316L samples [7]. ... 11 Fig. 1-5.True stress - strain curves and the fits for the transition layer, the core material and
the nanocrystalline + transition layers of a SMATed 316L steel [61]. ... 12 Fig. 1-6. In-depth variation of hardness from the treated surface for the SMATed Fe sample
and for the SMATed-annealed (at 593K for 30 min) sample [1]. ... 13 Fig. 1-7. (a): In-depth residual stress distribution after SMAT and subsequent annealing
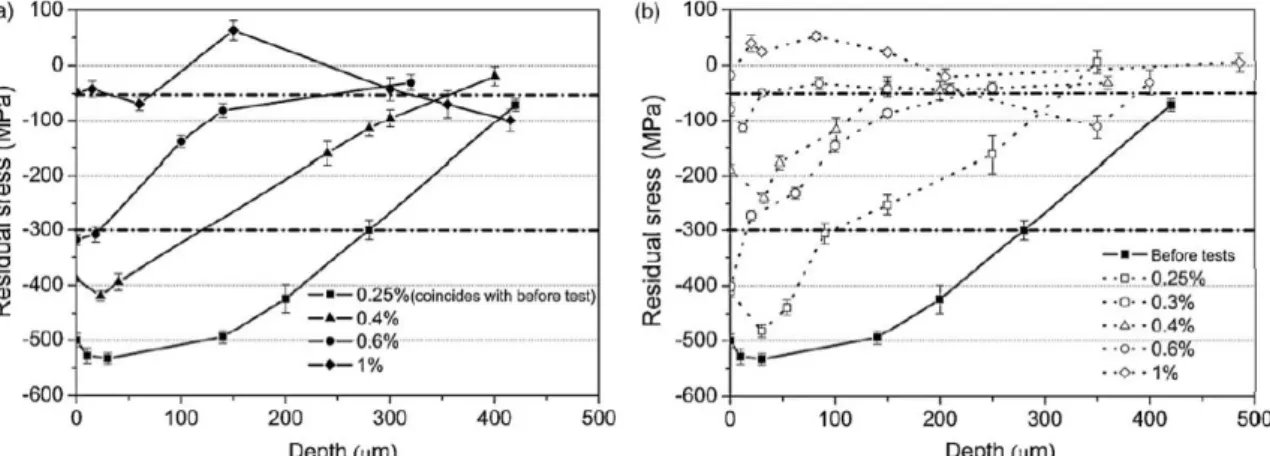
treatment ( at 400 °C ); (b) S/N curves of different conditioned samples [8]. ... 13 Fig. 1-8. Longitudinal residual stresses in depth variation obtained after different number of
cycles (a) N= 1; and (b) N=Nf/2, under different strain amplitudes [42]. ... 15 Fig. 1-9. Hierarchy of length scales in metal plasticity ranging from atomic (dislocation
cores) to macroscopic scale [82]. ... 16 Fig. 1-10. Empirical relationship between the diffraction peak width with cold work (or
plastic strain): (a) diffraction peak width to percentage of cold work for Rene 95 samples [139]; (b): diffraction peak width to true plastic strain and (c) true plastic strain distribution in a shot peened titanium alloy [43]. ... 23 Fig. 2-1. Shape and dimensions of the cylindrical specimen used for low cycle fatigue tests. ... 32 Fig. 2-2. Microstructure of the cross-section of the 316L specimen located in the surface
(left) and center (right) region. ... 32 Fig. 2-3. Presentation of SMAT treatment for a cylindrical specimen. ... 33 Fig. 2-4. Gradient distribution of metallurical observation by EBSD : (a) SLH; (b) SVH. 34
IX Fig. 2-5. In-depth variation of KAM values for SLH and SVH specimens. ... 35 Fig. 2-6. Hardness variation as function of the depth from the treated surface for SLH and
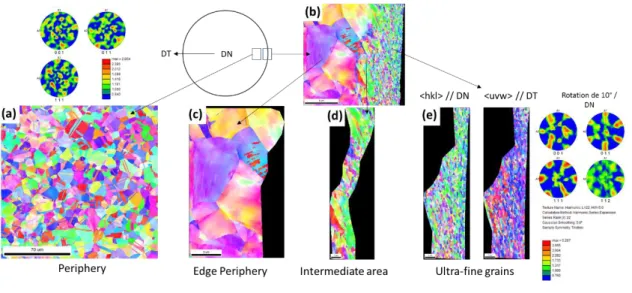
SVH specimens. ... 35 Fig. 2-7. EBSD observations performed on the cross-section of the SVH specimen: (a)
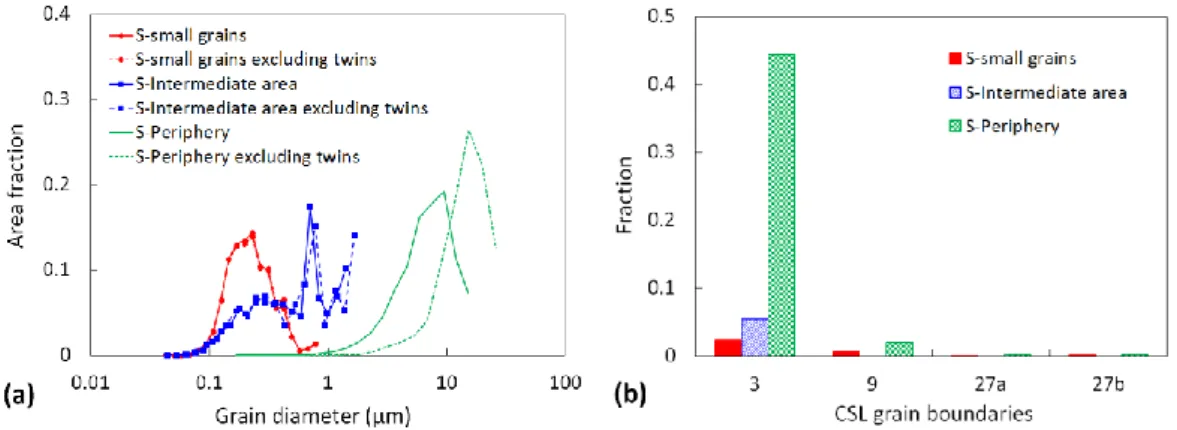
typical microstructure observed in a periphery region, and (b) mechanically affected region showing three different areas: (c) edge periphery area, (d) intermediate area, and (e) ultra-fine grain area. ... 36 Fig. 2-8. Grain diameter and grain bounday analysis for SVH specimen (S): (a) Distribution
of grain diameter evaluated in different areas with and without twins taken into account, and (b) fraction of 3n CSL (Coincidence Site Lattice) grain boundaries for different areas. Note that 3 represents twin boundaries. ... 38 Fig. 2-9. (a) GOS map from about 20 µm of the treated surface (right side of the map) for
the SVH specimen; (b) GOS map of the ultra-fine grain area (top surface, see Fig. 2-7e). ... 38 Fig. 2-10. X-ray diffraction patterns measured in different layers of the SVH specimen. . 39 Fig. 2-11. Description of XRD measurements with an iterative material removal method on
a cylindrical sample. ... 40 Fig. 2-12. In-depth variation of residual stress of SVH specimen: (a) measured stresses; (b)
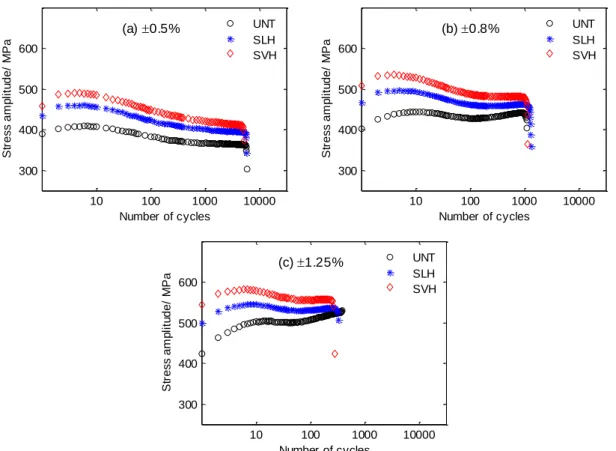
true stresses. ... 41 Fig. 2-13. In-depth variation of FWHM value measured on the SVH specimen. ... 42 Fig. 2-14. Cyclic stress amplitude curves for different material states under strain amplitudes
of: (a) ±0.5%, (b) ±0.8%, and (c) ±1.25%. ... 43 Fig. 2-15. Hysteresis loops with Δε/2 = ±1.25% for: (a) 2nd cycle, (b) 130th cycle, and (c)
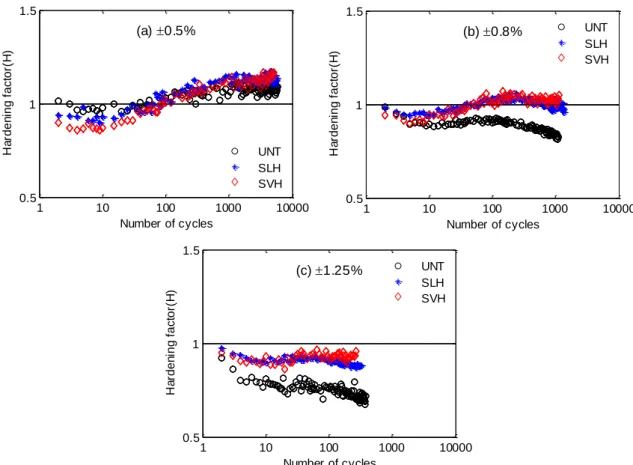
260th cycle. ... 44 Fig. 2-16. Hardening factor variation curves for different material states under strain
amplitudes: (a) ±0.5%, (b) ±0.8%, and (c) ±1.25%. ... 46 Fig. 2-17. X-ray diffraction patterns obtained for different layers of the SVH specimens and
at the surface of UNT specimen after fatigue tests under strain amplitude of ±1.25%. ... 47 Fig. 2-18. Hardness variation as a function of depth from the treated surface for SLH and
SVH specimens after fatigue tests. The curves for specimens after SMAT presented in Fig. 2-6 are also given for the sake of comparison. ... 47 Fig. 2-19. Image quality (IQ) maps illustrating (a) the absence of plastic slip lines in the
X
SMATed sample, and in (c) the edge periphery area of the SMATed sample after fatigue loading. {111} plane traces are indicated by red crosses. ... 49 Fig. 2-20. GOS distribution calculated in different areas of SVH specimen before and after
fatigue tests (Δɛ=±1.25%) corresponding to Fig. 2-7. ... 50 Fig. 2-21. GOS distribution for different areas: (a) ultra-fine grain area, (b) intermediate
area, and (c) edge periphery area, for SVH state (S) as well as SVH-fatigued state (SF).. ... 50 Fig. 2-22. Distribution of grain diameter of different areas for the specimen SMATed (S)
and the one SMATed and fatigued (SF). ... 51 Fig. 3-1. Surface topography and roughness profile of the as-received specimens. ... 55 Fig. 3-2. Surface topography of samples treated by SMAT and CSP with an Almen intensity
of 50A and different coverage: (a) SMAT with 125%, (b) CSP with 125%, (c) SMAT with 3000%, and (d) CSP with 3000%. ... 56 Fig. 3-3. Examples of surface profiles measured along the axial direction of samples treated
by: (a) SMAT, and (b) CSP, with an Almen intensity of 50A and a surface coverage of 125% and 3000%. ... 57 Fig. 3-4. Surface topography of specimens treated by SMAT with the Almen intensity of
22A and different coverage: (a) SMAT with 125%, (b) SMAT with 22A, 3000%. ... 57 Fig. 3-5. Examples of surface profiles measured along the axial direction of specimens
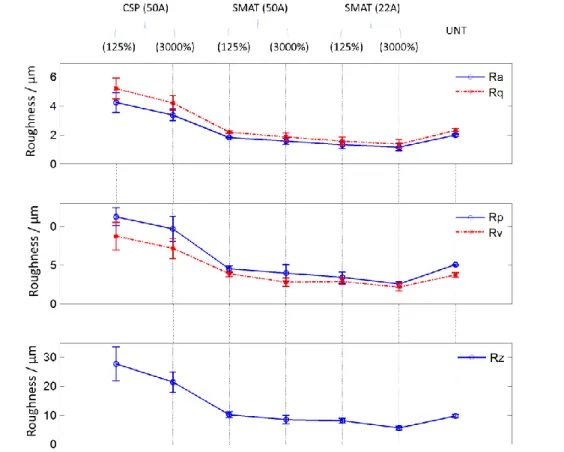
treated by SMAT with an Almen intensity of 22A and a surface coverage of 125% and 3000%. ... 58 Fig. 3-6. Schematic compariosn of surface roughness parameters (Ra, Rq, Rp, Rv, Rz) of
the specimens with different treatment conditions. ... 60 Fig. 3-7. Comparison of surface roughness parameters (Rdq, Rpc) of specimens obtained
with different treatment conditions. ... 61 Fig. 3-8. Micrography of samples treated with an Almen intensity of 50A and different
coverage values: (a) SMAT with 125% coverage, (b) CSP with 125%, (c) SMAT with 3000%, and (d) CSP with 3000%. ... 62 Fig. 3-9. In-depth variation of axial and circumferitial residual stresses for specimens treated
by SMAT and CSP with the Almen intensity of 50A and different coverage. ... 63 Fig. 3-10. In-depth variation of axial and circumferential residual stresses of specimens
treated by SMAT with an Almen intensity of 22A and different coverage: (a) axial residual stress, (b) circumferential residual stress. ... 64
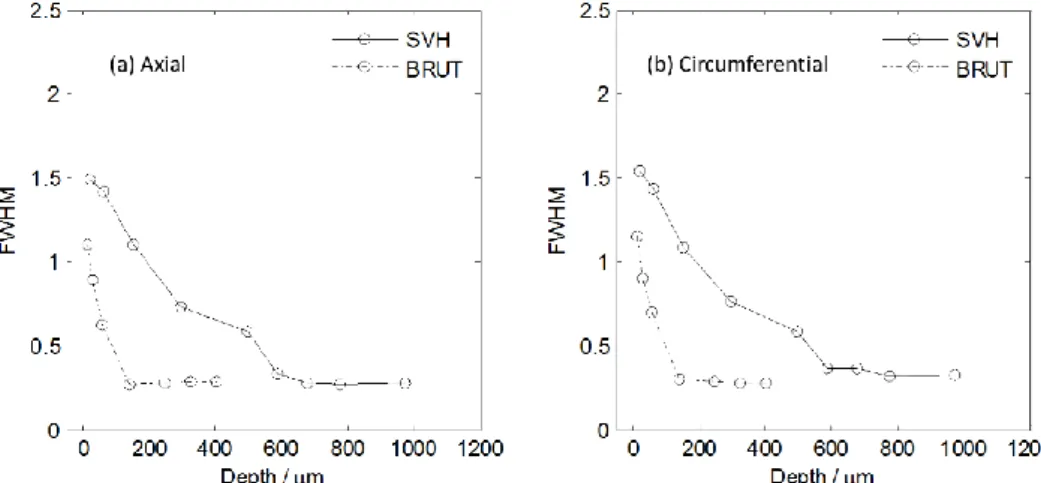
XI Fig. 3-11. In-depth variation of average axial FWHM value of specimens treated by SMAT and CSP with the Almen intensity of 50A and different coverage. ... 65 Fig. 3-12. In-depth variation of average axial and circumferential FWHM values of
specimens treated by SMAT with the Almen intensity of 22A and different coverage. ... 66 Fig. 3-13. Schematic preparation of samples for nanoindentation tests. ... 67 Fig. 3-14. Compariosn of Young’s modulus variation as a function of depth from the treated
surface for SMATed and CSPed specimens with the Almen intensity of 50A and different coverage, and in comparison with the untreated specimen. ... 69 Fig. 3-15. Hardness variation as a function of depth from the treated surface for specimens
treated by SMAT and CSP with the Almen intensity of 50A and different coverage. ... 70 Fig. 3-16. Comparison of residual stress, FWHM and hardness variations for untreated,
SMATed and CSPed specimens with the treatment condition of (50A, 3000%). ... 71 Fig. 3-17. Schematic presentation of different regions in the cross-section of SMATed and
CSPed specimens. ... 73 Fig. 3-18. Stress amplitude evolution curves of samples treated with Almen intensity of 50A
and coverage of 3000%: (a) under Δε/2 = ±0.5%, (b) under Δε/2 = ±1.25%. .... 74 Fig. 3-19. Hysteresis loops of the untreated, SMATed and CSPed specimens with the
treatment condition (50A, 3000%) under strain amplitude of ±1.25% for: (a) 2nd
cycle, (b) 10th cycle, and (c) 140th cycle. ... 75
Fig. 3-20. Estimated yield strength in-depth variation of the specimens treated by SMAT (50A, 3000%) and CSP (50A, 3000%). ... 76 Fig. 3-21. Stress amplitude evolution curves of samples treated with Almen intensity of 50A
and coverage of 125%: (a) under Δε/2 = ±0.5%, (b) under Δε/2 = ±1.25%. ... 77 Fig. 3-22. The first hysteresis loops of speicmens treated by SMAT (50A, 125%) and CSP
(50A, 125%) under strain amplitude of ±0.5% and ±1.25%. ... 78 Fig. 3-23. Linear fitting of fatigue life for untreated, SMAT and CSP processed samples
with the treatment conditions: (a) 50A, 3000% and (b) 50A, 125%. ... 79 Fig. 3-24. Residual stress profile along the axial direction measured after fatigue tests for:
(a) SMAT (50A, 3000%); (b) CSP (50A, 3000%), compared to the residual stress profile before fatigue tests (black curves). ... 80
XII
Fig. 3-25. Fracture surface for samples obtained with: (a) SMAT (50A, 3000%) under ∆𝜀/2 = ±1.25%, (b) CSP (50A, 3000%) under ∆𝜀/2 = ±1.25%, (c) SMAT (50A, 125%) under ∆𝜀/2 = ±0.5%, and (d) CSP (50A, 125%) under ∆𝜀/2 = ±0.5%. ... 82 Fig. 3-26. Observation of the outer surface of failed samples for: (a) SMAT (50A, 3000%)
under ∆ε/2= ±1.25%, and (b) CSP (50A, 3000%) under ∆ε/2= ±1.25%. ... 83 Fig. 4-1. Different parameters used to characterize a hysteresis loop. ... 86 Fig. 4-2. Monotonic stress-strain curves of the two 316L steels. ... 88 Fig. 4-3. Representation of yield points in the first hysteresis loop of 316L-A for both the
tensile and the compressive going under different strain amplitudes. ... 89 Fig. 4-4. First two hysteresis loops obtained under strain amplitudes from ±0.3% to ±1.5%
for: (a) 316L-A, and (b) 316L-B. ... 91 Fig. 4-5. Cyclic stress amplitude evolution with the number of cycles under different strain
amplitudes for: (a) 316L-A, and (b) 316L-B. ... 92 Fig. 4-6. Elastic modulus variation with the number of cycles for 316L-A under strain
amplitudes of (a) ±0.3%; (b) ±0.5%; (c) ±1.0%; (d) ±1.5%. ... 93 Fig. 4-7. Average elastic modulus of 316L-A under different strain amplitudes. ... 93 Fig. 4-8. Variations of (a) peak effective stress and (b) peak back stress with the accumulated
plastic strain under different strain amplitudes for 316L-A. ... 94 Fig. 4-9. Comparison of 𝜎(𝑖)C − 𝜎max𝑖T vs 𝜀(𝑖)pC − 𝜀max𝑖pT curves in compressive-going phase of the ith cycle under some typical strain amplitudes for 316L-A: (a), (b), (c); and 316L-B: (d), (e), (f). ... 95 Fig. 4-10. Recalculated peak back stress variation as function of accumulated plastic strain
under different strain amplitudes for 316L-A. ... 101 Fig. 4-11. Scale factor 𝛷𝑖 variation with accumulated plastic strain under different strain
amplitudes. ... 103 Fig. 4-12. (a) Scale factor 𝛷𝑖 variation and (b) its natural logarithm function variation with
accumulated plastic strain under strain amplitudes of ±0.3%, ±0.4% and ±0.5%. ... 104 Fig. 4-13. Identification procedure for the developed cyclic constitutive model (KH:
kinematic hardening). ... 107 Fig. 4-14. Comparison of initial tensile curve between modelling and experiment. ... 110
XIII Fig. 4-15. Variation of: (a) back stress 𝑋 and kinematic hardening variable 𝑋, (b) isotropic hardening variable 𝑅, and (c) kinematic hardening coefficient 𝜑 , obtained during the initial tensile simulation. ... 110 Fig. 4-16. Comparison of modelled and experimental curves of stress amplitudes as a
function of the number of cycles under different strain amplitudes (316L-A). 111 Fig. 4-17. Comparison of the first two hysteresis loops between modelling and experiment
for 316L-A under different strain amplitudes (a) ±0.3%, ±0.5%, ±1.0% and ±1.5%; (b) ±0.4%, ±0.8%, and ±1.25%. ... 112 Fig. 4-18. Comparison of 10th hysteresis loop between modelling and experiment of 316L-A under strain amplitudes of (a) ±0.3%, ±0.5%, ±1.0% and ±1.5%; (b) ±0.4%, ±0.8%, and ±1.25%. ... 113 Fig. 4-19. Comparison of stabilized cycles between modelling (red) and experiment (blue)
under strain amplitudes of ±0.8%, ±1.0%, ±1.25% and ±1.5%. The corresponding cycle number is also indicated in each figure. ... 113 Fig. 4-20. Comparison of several typical hysteresis loops between modelling and
experiment for 316L-A under strain amplitudes from ±0.3% to ±0.5% throughout the whole softening range. ... 114 Fig. 5-1. Stress-controlled loading procedure for the self-consistent model. ... 124 Fig. 5-2. Interaction matrix 𝐻𝑠𝑟 for different slip systems of FCC crystals. ... 126 Fig. 5-3. Pole figures of the aggregate with randomly generated grains for the
homogenization model. ... 128 Fig. 5-4. Comparison of stress amplitude evolution curves between experiment and
simulation for strain amplitude of 1.25% (316L-A). ... 129 Fig. 5-5. Comparison of cycles between simulation (red) and experiment (blue) under strain
amplitude of ±1.25%. The corresponding cycle number is also indicated in each figure. ... 129 Fig. 5-6. Identification procedure for the parameters involved in the self-consistent model. ... 130 Fig. 5-7. Comparison of (a) stress amplitudes and (b) maximum/minimum stresses between
the simulated results through self-consistent model and macroscopic model under strain amplitude of 1.25%. ... 131 Fig. 5-8. Comparison of the hysteresis loops: (a) 1st and 2nd, (b) 10th, (c) 180th, between the
simulated results through the self-consistent model (red curves) and the macroscopic model (blue curves) under strain amplitude of 1.25%. ... 132
XIV
Fig. 5-9. Comparison of monotonic tensile curves between the aggregates with different numbers of grains along with different randomly generated orientations for: (a) 20 grains, (b) 50 grains, (c) 100 grains and (d) 400 grains. ... 133 Fig. 5-10. Comparison of the tensile curves simulated using the self-consistent model with
different strain rates. ... 134 Fig. 6-1. Schematic presentation of (a) impacted and unloaded states, and (b) the yield
surface evolution during (n)th impacting-unloading in the deviatoric stress space. ... 137 Fig. 6-2. Several cases of elastic-plastic flow while the residual stress and hardening
variables are introduced in a material element. ... 139 Fig. 6-3. Schematic description of reconstruction procedure for residual stress and work
hardening. ... 140 Fig. 6-4. Measured in-depth variation of residual stress components. ... 141 Fig. 6-5. In-depth variation of the corrected true residual stresses components. ... 142 Fig. 6-6. In-depth residual stress variations throughout the treated sample. Experimental
data are also given for comparison. ... 143 Fig. 6-7. In-depth variation of measured FWHM of the shot peened sample. FWHM of the
untreated sample is given for comparison. ... 144 Fig. 6-8. In-depth variation of FWHM and the fitted curve. ... 145 Fig. 6-9. Schematic description of the three typical initial kinematic hardening states. ... 146 Fig. 6-10. Schematic presentation of (a) impacted and (b) unloaded states as well as the
associated stress tensors of a material point at the surface of contact. ... 147 Fig. 6-11. Simulation procedure of multi impacts. ... 148 Fig. 6-12. FE model of a cylindrical specimen with a shot and the associated boundary
conditions. ... 149 Fig. 6-13. (a) Equivalent Mises stress field and (b) accumulated plastic strain field in the
impacted state. ... 150 Fig. 6-14. Typical elements with plastic deformation during impacting on the contact
surface of the sample. ... 150 Fig. 6-15. Distribution of plastic slip (a) and shear stress (b) in a slip system with respect to
the angle between the slip direction and the positive axial direction of the whole structure. ... 152 Fig. 6-16. Schematic description of the orientation of the slip direction with respect to the
XV Fig. 6-17. In-depth variations of the residual accumulated plastic strain. ... 153 Fig. 6-18. In-depth variations of the kinematic hardening components. ... 153 Fig. 6-19. Description of the gauge section of the treated sample: (a) cylindrical coordinate
system, and (b) FEM model with the applied boundary conditions. ... 156 Fig. 6-20. Loading path for uniaxial cyclic simulation of the FE model (∆𝜀 = ±1.25%). ... 157 Fig. 6-21. Contours of axial stress 𝜎𝑍𝑖𝑛 (in MPa) of: (a) as-imposed state, and after self-equilibrium for (b) Case II, (c) Case III. ... 157 Fig. 6-22. (a) comparison of as-imposed and equilibrated stresses for Case II and Case III. ... 158 Fig. 6-23. Evolution of three stress components of the material points at the treated surface
(point A) and in the centre region (B) during the first two cycles (the black dotted curve and the blue dotted curve are nearly superposed). ... 159 Fig. 6-24. (a) Illustration of the first two loading cycles of the cylindrical structure and (b)
in-depth variation of the axial residual stress in different loading places. ... 160 Fig. 6-25. Distribution of plastic slip (a) and shear stress (b) in a slip system with respect to
the angle between the slip direction and the positive axial direction of the whole structure after cyclic loading simulation (150th). ... 160
Fig. 6-26. Comparison of cyclic stress amplitude obatined from simulations of the three cases with different initial conditions. ... 161
XVI
List of Abbreviations and Acronyms
CPFEM: Crystal plasticity finite element method; CSP: Conventional shot peening;
EBSD: Electron backscatter diffraction; FE: Finite element;
FEM: Finite element method;
FWHM: Full width at half-maximum; GAM: Grain Average Misorientation; GMF: Gradient microstructure feature; GOS: Grain Orientation Spread; HCF: High cycle fatigue;
KAM: Kernel average misorientation; LCF: Low cycle fatigue;
RVE: Representative volume element; SEM: Scanning electrical microscope;
SMAT: Surface mechanical attrition treatment; SPD: Severe plastic deformation;
XRD: X-ray diffraction; FCC: Face-centred cubic.
1
General introduction
Surface modification technology has been widely used in industry to improve in-service properties of materials through physical or chemical approaches. It is well documented that surface mechanical treatment techniques are able to generate a gradient microstructure in the near surface region of metallic materials, for example shot peening [1,2], SMAT [1] laser peening [3,4], deep-rolling [5,6]. During the process, a great number of crystallographic defects such as plastic slips could be activated. This can progressively lead to a thin ultrafine-grained or nanostructured layer at the surface of the treated metallic materials [1,2,6]. Underneath the grain-refined layer, there is an area named transition region characterized by the presence of a high strain hardening gradient and a high gradient of compressive residual stress. In the region far from the surface, the material is not affected, and the material characteristics such as grain size and dislocation density remain unchanged. These metallurgical parameters generated by surface mechanical treatment including ultra-fine grained layer, residual stress, work hardening, sometimes with phase transformation or twins together constitute a gradient microstructure feature in the near surface region of severe plastic deformed metallic materials.
In general, the mechanical properties of metallic materials with gradient microstructure features at the surface can be obviously changed with respect to their untreated counterparts. Ultra-fine grained austenitic stainless steel generated by SMAT and deep rolling manifests significant enhancement of mechanical properties such as tensile strength, fatigue limit, friction, or wear resistance [3,6–8]. Underneath the grain-refined layer is a transition region, where a high compressive residual stress field and work hardening gradient are generated due to SPD. A compressive residual stress field is able to improve fatigue life by increasing the resistance to crack initiation and reducing the crack propagation rate [9,10]. Furthermore, SPD may induce phase transformation which could lead to a significant strengthening of austenitic stainless steels processed by shot peening and deep-rolling [6,11].
The aim of this thesis is to study the LCF behaviour of 316L austenitic steels treated by SMAT through experimental analysis and Multi-scale modelling. A bibliographic study
2
of the research background is presented in Chapter 1 from the viewpoints of experimental characterization of microstructures, mechanical properties of the gradient microstructure feature, as well as multi-scale modelling approaches.
In Chapter 2, grain refinement, residual stress, and plastic deformation of a 316L austenitic stainless steel treated by SMAT are characterized using EBSD, XRD, hardness tests. The results show that cyclic stress amplitudes of SMATed specimens are significantly enhanced based on strain controlled LCF tests. The evolution of the microstructures during cyclic loading are also analysed through EBSD observations. The comparison between SMAT and CSP is performed in Chapter 3 by analysing surface topography, compressive residual stress, and work hardening of the treated specimens as well as their effects on LCF life.
In Chapter 4, the cyclic behaviour of the two studied 316L steels (316L-A in Chapter 3 and 316L-B in Chapter 2) highlighted by uniaxial strain controlled LCF tests is first analysed. Significant strain range memory effect can be observed for both the two steels according to the analysis. It is noted that the cyclic hardening/softening behaviour and the strain range memory effect can mainly be attributed to back stress. A set of constitutive relations is proposed in the combined kinematic/isotropic hardening framework to describe the cyclic behaviour of the 316L-A steel.
In order to model the cyclic behaviour of materials from more fundamental aspects, a self-consistent modelling is developed in Chapter 5. In this chapter, a crystal plasticity model is extended and coupled with a self-consistent model. For this purpose, a non-linear kinematic hardening rule is proposed at the slip system scale to model the cyclic hardening/softening behaviour induced by the back stress. The material parameters, which correspond to the cyclic behaviour of the 316L-A steel under a strain amplitude of ±1.25%, are determined by using an identification procedure developed in this work.
In Chapter 6, the LCF behaviour of the SMATed materials is studied through Multi-scale modelling. A new method of reconstruction of residual stress and work hardening is proposed and applied to a SMATed structure. Residual stress field and work hardening gradient are reconstructed for a SMATed cylindrical structure, based on XRD measurement, stress equilibrium relation, boundary conditions, as well as deformation history analysis. The reconstruction method is verified through self-equilibrium analysis with a FE model. The residual stress relaxation during cyclic loading and the strengthening effect due to SMAT are studied based on cyclic loading simulations using the FE model.
3
Chapter 1: Literature review
The as-generated gradient microstructure feature through surface mechanical treatments can have significant effects on mechanical properties of metallic material in service. Therefore, being able to thoroughly understand and precisely take into account gradient microstructure features is of great importance for material processing design and optimization. This thesis focuses on studying the fatigue behaviour of austenitic stainless steels treated by surface mechanical attrition treatment (SMAT) with experimental characterization and multi-scale modelling methods. This chapter reviews the state of the art on shot peening technologies, experimental characterization, and multiscale modelling approaches of the gradient microstructure features. At the end, the research objective, contents, and the structure of the thesis are outlined.
1.1 Introduction to shot peening technologies
1.1.1 Conventional shot peening and SMAT
Shot peening [2,4,12–14] is a mechanical surface treatment widely used to generate compressive residual stress and work hardening at the surface of metallic material so as to improve fatigue properties, reduce fretting, wear and stress corrosion cracking. Generally speaking, shot peening is based on high-speed impacts induced by spherical peening media with sufficient hardness to activate inhomogeneous plastic deformation at the surface of metallic materials. When a hard shot hits a structure or a part with a high kinematic energy and sufficient force, it can create a small dimple at the surface of the material. During this process, the surface will be indented under a tensile stress and simultaneously an opposite compressive stress can be induced beneath the dimple. If the value or the magnitude of the generated stress is higher than the yield strength of the material, a residual compressive stress will be retained due to inhomogeneous spring back and plastic deformation. After a great number of impacts, a stable distributed compressive residual stress field can be produced in the near surface region, and a tensile stress variation could be generated for the
Chapter 1: Literature review
4
sake of stress self-equilibrium through the structure. In addition, it is always inevitably coupled with work hardening/softening activities during the multi-impacts, and thus a work hardened (cold hardening) layer can be introduced and co-exists with the stress field. Both the residual stress and the work hardening could significantly influence the properties of materials.
Most of the failures in engineering materials such as fatigue fracture, wear or corrosion, are very sensitive to properties of the material surface, and in most cases, failures initiate at the surface and propagate to the interior. As mentioned above, the compressive residual stress and work hardening are able to affect crack initiation and propagation, and thus can play an important role in the fatigue properties of materials. Moreover, some other microscopic features, such as deformation-induced phase-transformation and twining, can also alter the local mechanical behaviour of metallic materials.
Conventional shot peening technologies propel the shot media mainly using air blast systems, centrifugal blast wheels or vapour blast machines. As varieties of the shot peening process, surface mechanical attrition treatment (SMAT), or ultrasonic Shot Peening technology, was developed by using high frequency ultrasonic devices to accelerate high quality spherical shot [1]. During SMAT, the shot irregularly strikes the surface of the part with high kinematic energy in an enclosed space. These strikes induce multi-directional severe plastic deformation at the surface of the material, and coarse grains can be refined down to the nanometre scale due to multi plastic slips. Fig. 1-1 illustrates schematic presentation of the conventional shot peening and SMAT.
Fig. 1-1. Sketch of (a) conventional shot peening and (b) SMAT.
In addition to a high compressive residual stress field and a work hardening gradient in the near surface region, SMAT can also generate a nanostructured layer at the treated surface[1,15,16]. Metals with ultra-fine grains, especially at the nanometre-scale, possess enhanced mechanical properties compared to their conventional coarse-grained
Chapter 1: Literature review
5 polycrystalline counterparts, such as high strength, increased resistance to tribological and environmentally assisted damage [6–8,11,17–22], enhanced fatigue life. In addition, compared to the conventional shot peening technologies, SMAT can induce a low roughness and better surface properties for future thermo-chemical treatments, for example nitriding [23]. With these remarkable advantages, SMAT has attracted a considerable attention of the academia in recent years [1,5,8,11,18]. Besides the conventional shot peening and SMAT, other technologies which don’t use shot media have also been developed, like laser shock peening for example, which can introduce a higher and deeper compressive residual stress field in the near surface region of materials [3,4,13]. This technology is based on shock wave by high power laser impulse and is out of the scope of the present work. It will thus not be further presented.
1.1.2 Nanostructured surface layer
Mechanically, the nanostructured surface layer can be generated by many surface mechanical treatment technologies, such as SMAT [24], severe shot peening [21,25], deep rolling [6], grinding [26]. All of these approaches are based on plastic deformation-induced grain refinement in the coarse polycrystalline regimes. At present, severe plastic deformation technique has gained a great interest in producing nanocrystalline materials [27–29]. Generally, several requirements should be meet in order to create nanostructures in bulk metallic materials [27], (1) prevailing high angle grain boundaries, thus a qualitative change in material properties can occur; (2) the processed material should have stable properties; (3) no mechanical damage and cracks should be generated during large plastic deformation.
SMAT has been proved as an effective method to achieve grain refinement down to nanometre scale at the surface of many metals and alloys [1,15,16,24]. Microstructure evolutions of pure Fe during SMAT [24] indicates that the grain refinement is caused by the formation of dense dislocation walls and dislocation tangles in original grains and in the refined cells (under further straining). The dense dislocation walls and dislocation tangles are transformed into subboundaries with small misorientations separating individual cells or subgrains. Afterwards, the subboundaries are changed to highly misoriented grain boundaries cells or subgrains. The subdivision takes place on a finer scale with increasing strain, and a stabilized grain size can be reached when dislocation multiplication rate is balanced by the annihilation rate so that the increase of strains could not reduce the subgrain size any longer [24]. In addition, under multi-directional peening during SMAT, the
Chapter 1: Literature review
6
dislocations not only interact with other dislocations in the current active slip systems, but also interact with inactive dislocations generated by previous deformation. Thus, the grains can be subdivided more effectively by the dislocation walls and dislocation tangles compared to other treatment technologies [24].
Materials with a nanocrystalline structure exhibit superior physical and chemical properties compared to their coarse-grained counterpart, for instance, low strain hardening [29], friction and wear [18,22,30], corrosion resistance [31,32], fatigue properties [6,8,21,33], and high yield strength [7,29] according to the well-known Hall–Petch relationship (Eq. (1-1)) [34,35].
𝜎𝑦 = 𝜎0+ 𝐴𝑑1 2⁄ (1-1)
where 𝜎y is the yield stress, 𝜎0 is the lattice friction stress, 𝐴 is the strengthening coefficient, 𝑑 is the grain size. However, several studies imply that the nanostructured layer generated by SMAT can decrease the corrosion resistance due to the presence of microstrain, defect or cracks[36,37].
In terms of fatigue properties, it has been shown that the formation of nanostructures by SPD can lead to a significant increase in fatigue strength [6,8,21,38]. However, these improvements are mostly found under high cycle fatigue tests. Under strain-controlled low cycle fatigue with high strain amplitudes, the fatigue lifetime maybe decreased due to a deleterious effect of nanostructured grains on the resistance to fatigue crack growth [38]. Studies show that the key of enhanced fatigue properties lies in the potential of nanocrystals to suppress the crack initiation, since the scale of nano grains is below the critical persistent slip bands for failure initiation [33]. However, the crack propagation resistance of materials is degraded when the grain size is reduced.
In fact, many nanostructures generated by SPD are accompanied by an increased surface roughness and defects numbers, which would promote crack nucleation. In addition, fatigue-induced grain growth [39,40], residual stress and work hardening play important role in crack initiation and propagation as well. Therefore, it could be interesting but also challenging to thoroughly understand the fatigue behaviour of nanocrystalline materials.
1.1.3 Residual stress
Residual stress is usually defined as the stress, which remains in a mechanical part not actually subjected to any external loads. It is the result of the metallurgical and mechanical history of the part during its manufacture or treatment [41]. Residual stresses inside a
Chapter 1: Literature review
7 structure can modify the theoretical stress field, and thus have a positive or negative effect on the mechanical properties of materials. For example, on the one hand, the presence of compressive residual stresses in the surface layers can increase the fatigue strength and the resistance to stress-corrosion cracking. On the other hand, the tensile residual stresses could promote the stress corrosion of materials [41]. Residual stress can be introduced in mechanical parts during nearly all the manufacturing processes through mechanical, thermal or chemical approaches. Especially, some mechanical surface treatment technologies (e.g. shot peening, case hardening) are widely used to generate a compressive residual stress field in the region close to the surface of a structure to improve its fatigue properties. This is due to the fact that compressive residual stress can increase the surface resistance to crack initiation and reduce the crack propagation rate through modifying the stress field [4,8– 10,42].
From length scale perspective, residual stresses are generally classified as Type I, II and III based on the length over which the stresses equilibrate [9], as shown in Fig. 1-2. Type I stresses self-equilibrate over macroscopic dimension of the component. It ignores the polycrystalline or multiphase nature of the material, and is often calculated using finite element tools. Type II residual stresses self-equilibrate over the dimension of several grains, and are the result of strain incompatibility between grains, created by the orientation dependent elastic and plastic anisotropy. Type III stresses exist over atomic dimensions and balance within a grain, for example, those caused by dislocations and point defects. [9,10].
Fig. 1-2. Illustration of the Multi-scale nature of residual stresses in polycrystals [43,44].
In general, the Type I residual stresses, also named as macroscopic residual stresses, are widely used to increase the mechanical properties of materials in engineering fields. The Type II and III residual stresses, as inter- and intra-granular residual stresses, are mainly
Chapter 1: Literature review
8
studied to analyse materials from a physical viewpoint, such as slip bands and defects at the grain level [44,45]. Based on stress self-equilibrium relationship, when a compressive residual stress is generated in the near surface region by surface treatment technologies, there must be a residual stress field of tensile nature to ensure the equilibrium of the stress state of the whole structure. Similarly, microscopic tensile residual stresses could also be contained between or within grains, which are more prone to damage accumulation in the form of slip or twinning, subsequent formation of defects and micro-voids that lead to crack initiation and propagation during cyclic loading [44]. Therefore, a good understanding of all the three types of residual stresses and their effect on mechanical behaviour at different scales is crucial for the prediction and the optimization of mechanical properties of materials.
1.1.4 Work hardening
In addition to the generation of residual stress through inhomogeneous plastic deformation, there is inevitably the presence of work hardening in the material. Work hardening, also known as strain hardening, is a macroscopic phenomenological description of most metals which become strengthened when they are plastically deformed. At the microscopic scale, plastic deformation occurs through dislocation generation and movement within the crystal structure of materials. As dislocations develop, they can encounter and interact with other dislocations or crystalline defects, thereby producing resistance to further development [46].
Based on the dislocation storage and recovery mechanism, the work hardening process can be divided into four stages [47]. In the early stage of plastic deformation (Stage I), only easy glide occurs during single slip in single crystals with a low work hardening rate caused by storage of dislocation dipoles and multipoles on the primary slip system. After a certain strain level, single crystals exhibit a transition from a low hardening rate to a much larger rate due to the storage of dislocation tangles on multiple slip systems. This Stage II of hardening presents an approximately linear hardening behaviour with a relatively high work hardening rate and occurs in both single crystals and polycrystals. The stage III corresponds to a monotonic decrease of the work hardening rate with an increase of the flow stress, and a saturated stress is reached by the end of this stage when recovery balances dislocation storage. When the material is subjected to large strain, the fourth work hardening stage (Stage IV) intervenes with a further decrease of hardening rate without marked changes in the character of obstacles to dislocation movement. This stage is caused by the accumulation of dislocation debris, perhaps as a by-product of dynamic recovery [47].
Chapter 1: Literature review
9 Concerning the cyclic deformation response of polycrystals, hardening / softening behaviour is rather complex and dislocations tend to move in more planar ways during cyclic loading. The internal variables (e.g. effective stress, inter/intra-granular back stresses) can be related to several types of microstructures (e.g. short- and long-range interactions of dislocations), and dislocation density as well as configuration of dislocations cycle by cycle evolvement under different loading conditions [48–53]. In addition, phase transformation induced by stress or plastic deformation could also exhibit a macroscopic hardening effect of materials [8,54,55].
Up to now, many studies have confirmed the benefits of surface mechanical treatment in improving the fatigue properties of metallic materials. Most studies focus on the effect of residual stress and its working mechanism in service, whereas the effect of work hardening is often neglected due to its difficulty to be characterized and evaluated. In fact, work hardening generated by peening technologies can also influence the local stress-strain behaviour and microstructure of materials, and should have a considerable effect on crack initiation and propagation during cyclic loading. Hence, the contribution of work hardening in fatigue properties of material treated by peening technologies should be well considered in different applicative conditions.
1.2 Experimental study of shot peened and SMATed material
1.2.1 Gradient microstructure features
As a kind of ultrasonic peening technologies, SMAT is able to project spherical shots with a high energy to repeatedly strike the surface of materials. It allows introducing a large number of dislocations and/or deformation twins, which can lead to refined grains down to the nanometre scale at the surface[1,16,24]. Underneath the nanostructured layer, there is a mixed grain size region, where a mixture of ultra-fine grains and relatively large grains co-exist. In addition, the inhomogeneous plastic deformation can generate high compressive residual stresses and work hardened region close to the processed surface, while tensile residual stresses are simultaneously introduced beneath to equilibrate the stress field for the whole structure. As the effect of multi-impacts gradually decreases from the treated surface to the bulk of the treated part, the residual stresses and work hardening should also have a gradual variation trend in the near surface layer. These elements including the nanostructured layer, the mixed grain size region, the gradual variations of residual stresses, and work hardening together constitute the gradient microstructure features of SMATed
Chapter 1: Literature review
10
materials, as shown in Fig. 1-3. Besides, for some austenitic steels, martensitic transformation can also be induced during SMAT which increases the complexity of the gradient features [8,16].
Fig. 1-3. Illustration of gradient microstructure features generated by SMAT. (a): schematic presentation of gradient microstructure; (b): typical TEM observations of ultrafine grains at the top surface for SMATed AISI 304 stainless steel [16] and (c): in depth variations of the grain/cell size and the mean microstrain from
the treated surface of SMATed Fe sample [24].
In general, with SMAT, the coarse grains can be refined down to about 10 nm at the top treated surface, and the grain size increases with the depth in a thickness of about 50-60 µm for most metallic materials as a function of the treatment conditions, such as Fe [24], austenitic steel [7,8,16], low carbon steel [18], aluminium [56], titanium [57,58]. Underneath the nanostructured layer, the obvious plastic deformation affected microstructure can be highlighted through SEM, EBSD, TEM and XRD. This gradient features can be indirectly characterized by some microscopic mechanical testing techniques, for example nano-indentation [58,59], micro-hardness testing [1,17], micro-pillar compression [59,60].
1.2.2 Mechanical properties
1.2.2.1 Monotonic behaviourAs indicated in Section 1.2.1, the gradient microstructure features can be generated by SMAT, including nanostructured layer at the treated surface, mixed grain-refined layer, residual stress and work hardening fields in the near surface region. This typical
Chapter 1: Literature review
11 microstructural gradient can significantly affect the mechanical behaviour of SMATed materials. It is well known that the tensile strength of a material is strongly dependent on the grain size, according to Hall-Petch relationship (Eq. (1-1)). Therefore, the nanostructured layer generated by SMAT at the surface can exhibit very high tensile yield strength, as shown in Fig. 1-4.
Fig. 1-4. (a) Grain size distribution in the region at about 6–8 µm beneath the polished top surface; (b): comparison of tensile true stress–strain curves for the nanocrystalline layer and the coarse-grain 316L
samples [7].
Chen et al. [7] performed an uniaxial tensile test at room temperature for a 316L nanocrystalline (mean grain size: ~40 nm, Fig. 1-4a) dog bone-shaped specimen with a thickness of 15 µm using a microforce testing system. The result presented in Fig. 1-4b shows that the nanocrystalline layer exhibits a much higher yield strength and ultimate strength compared to its coarse-grain counterpart (average grain size: 20 µm). However, the elongation-to-failure of the nanocrystalline layer (about 3.4%) is significantly reduced due to its very low dislocation storage capacity inside the grains [7].
Underneath the grain-refined layer, the effects of residual stress and work hardening can also be indirectly identified by uniaxial tensile tests using progressive material removal method. Petit et al. [61] studied the tensile behaviour of the nanocrystalline and transition layer generated by SMAT. The tensile test samples were prepared by using mechanical polishing to remove the irrelevant part of the material, as shown in Fig. 1-5. The three experimental stress-strain curves, respectively corresponding to ‘nanocrystalline + transition layer’, ‘transition layer’ and ‘core material layer’, show an obvious gradient feature of the SMATed material. The tensile strength is significantly improved in the region
Chapter 1: Literature review
12
close to the treated surface, while the hardening rate and the ductility are reduced, which is consistent with the result presented in Fig. 1-4.
Fig. 1-5.True stress - strain curves and the fits for the transition layer, the core material and the nanocrystalline + transition layers of a SMATed 316L steel [61].
In addition to the micro uniaxial tensile test, the mechanical properties of the gradient microstructures generated by SMAT have also been widely evaluated by Nano-indentation and micro-indentation. Lu et al. [1] studied the properties of a SMATed Fe sample and its annealed state. The annealed in-depth hardness variation with respect to the treated surface was measured using Nano-indenter, as shown in Fig. 1-6. It shows that there is nearly no change in hardness profile after the sample was annealed at 593 K for 1 hour. In fact, this annealing permits the residual stresses in the region from the depth of 50 µm to 200 µm to relax. This result implies that the high hardness in the surface layer does not result from the residual stresses induced by the SMAT. In addition, after the recrystallization of the nanostructures and the formation of coarse grains due to annealing, the hardness close to the surface layer drops to that of the coarse-grained matrix, which indicates that the hardness increase induced by SMAT is mainly related to the grain refinement [1].
Chapter 1: Literature review
13
Fig. 1-6. In-depth variation of hardness from the treated surface for the SMATed Fe sample and for the SMATed-annealed (at 593K for 30 min) sample [1].
1.2.2.2 Fatigue properties
Compared to monotonic deformation, the mechanical behaviour of gradient microstructure features during cyclic loading is much more complex. Little previous work was conducted to study the cyclic hardening / softening behaviour of SMATed materials, and most studies are focused on the improvement of fatigue life due to SMAT. In fact, as indicated in Section 1.2.1, the nanocrystalline structure, residual stress and work hardening significantly influence the crack initiation and propagation during cyclic loading. Roland et al. [8] studied the effect of SMAT combined with subsequent annealing on fatigue life of a 316L stainless steel under high cycle fatigue, as illustrated in Fig. 1-7.
Fig. 1-7. (a): In-depth residual stress distribution after SMAT and subsequent annealing treatment ( at 400 °C ); (b) S/N curves of different conditioned samples [8].
It can be seen in Fig. 1-7a that SMAT generated a compressive residual stress field inside the structure with a very high value close to the treated surface. The subsequent annealing treatment lead to residual stresses relaxation by more than 50% in the near surface
Chapter 1: Literature review
14
due to the annihilation of dislocations induced by the annealing [8]. The S/N diagram for different treatment conditions shown in Fig. 1-7b implies a significant increase of fatigue strength of the nanostructured stainless steel compared to the untreated material. In addition, the fatigue strength of annealed samples is improved by approximately 5–6% compared with the nanostructured state. This phenomenon might be attributed to a suitable annealing treatment leading to an enhanced ductility, which could even further improve the LCF and HCF resistance of the material [8].
Sun et al. [62] studied the low cycle fatigue behaviour of a biomedical 316L steel treated by SMAT using strain controlled tension-compression fatigue tests with a strain
amplitude ranging from ±0.3% to 1.25%. The obtained results show that the stress amplitude of the SMATed samples is significantly enhanced compared to the untreated ones, while the fatigue strength represented by the number of cycles to failure is not improved under high strain amplitudes [62]. In addition, other studies show that SMAT can also increase the fatigue life of titanium alloy [63], aluminium alloy [64,65] under low cycle fatigue tests. However, the fatigue life could be reduced when a longer treatment time duration is applied [65]. Moreover, SMATed samples could exhibit a different hardening / softening behaviour compared to the untreated ones during cyclic loading due to the gradient microstructure features [62,63].
In summary, it has been confirmed by experiments that the gradient microstructure features generated by SMAT can significantly improve the fatigue life of metallic materials under high cycle fatigue [8,33,66–68]. However, these benefits of SMAT under low cycle fatigue with high strain amplitudes seems still controversial [63–65]. In fact, the decrease of ductility of the generated nanocrystalline layer could induce a negative effect on the crack initiation and propagation. Moreover, the beneficial effect of compressive residual stresses could be much reduced due to their quick relaxation during cyclic loading with high strain/stress amplitudes. These different aspects will be discussed in the following sections.
1.2.3 Residual stress relaxation
Relaxation of residual stress can be occured during the service period due to thermal or mechanical loadings. The residual stress relaxation during fatigue has been widely investigated through various experimental approaches [42,69–77]. Results indicate that the residual stress relaxation increases with the maximum applied strain amplitude , and the residual stresses relaxation essentially occurs during the first cycle, followed by gradual relaxation during the fatigue lifetime [42]. The relaxation during the first cycle depends on
Chapter 1: Literature review
15 the monotonic yield strength of the material in tension and compression, while the relaxation during the subsequent cycles is related to the cyclic yield strength, thus dependent on the cyclic plastic strain amplitudes [42,78].
Dalaei et al. [42] investigated the residual stress stability of a shot peened micro alloyed steel under fully reversed strain-controlled push-pull fatigue tests at room temperature. The residual stress relaxation during the first and subsequent cycles under different strain amplitudes is illustrated in Fig. 1-8. It shows that the compressive residual stress in the near surface region was almost completely relaxed after the first cycle at Δε/2 = ±1%, while for Δε/2 = ±0.6%, the residual stress keeps one half of the initial values after the first cycle, and it remaines unchanged under a strain amplitude of ±0.25%. At the half fatigue lifetime, there still remains a certain amount of residual stress in the near surface region under strain amplitudes from ±0.25% to ±0.4%. Comparatively, all of compressive residual stress had been relaxed under stain amplitude of ±0.6%. Fig. 1-8 implies that the residual stress relaxation takes place mainly in the first several cycles, and then decreases gradually while the cyclic loading continues.
Fig. 1-8. Longitudinal residual stresses in depth variation obtained after different number of cycles (a) N= 1; and (b) N=Nf/2, under different strain amplitudes [42].
In addition, the stability of residual stress during fatigue loading is related to the surface treatment methods [78]. Nikitin and Besel [78] indicate that the near-surface residual stress, which is produced by consecutive deep rolling & annealing as well as high temperature deep rolling, presents more stable behaviour under strain-controlled low cycle fatigue at room temperature than is the one generated by conventional deep rolling. In order to accurately predict the fatigue behaviour of materials, the residual stress relaxation during cyclic loading is also estimated by finite element method through reconstructing an initial stress field inside the structure (e.g. [74,79–81]). This will be discussed in other next sections.
Chapter 1: Literature review
16
1.3 Multi-scale modelling of shot peened and SMATed
materials
Section 1.2 reviewed the typical gradient microstructure features of SMATed materials and their mechanical properties characterized through different techniques. Modelling and numerical simulation are also very useful approaches which allow a better understanding of deformation mechanism, process optimization as well as life prediction of materials. As indicated in Section 1.1, the characteristics of a SMATed material include a thin nanocrystalline layer and a mixed grain-refined layer at the treated surface, along with residual stress and work hardening fields present down to deeper region. Given the complexity of these parameters, it would be a great challenge to precisely consider these characteristics in predicting and optimizing the mechanical properties of SMATed materials.
1.3.1 Introduction to multi-scale modelling
Plasticity is a multi-scale, multi-mechanism phenomenon manifested of irreversible microstructure rearrangement associated with line and point defects in crystals [82]. Metal plasticity is fundamentally associated with the nucleation and migration of dislocations in crystals and polycrystals as the underlying basis for microstructure rearrangement or evolution during plastic flow [82]. From the viewpoint of length scale, it can be characterized from atomistic scale to macroscopic continuum plasticity, as shown in Fig. 1-9.
Fig. 1-9. Hierarchy of length scales in metal plasticity ranging from atomic (dislocation cores) to macroscopic scale [82].
At the macroscopic scale, the material can be considered as a homogeneous continuum body, and the elastic-plastic behaviour is studied in the continuum mechanics framework. In this case, phenomenological constitutive theories are mainly used to characterize the
![Fig. 1-6. In-depth variation of hardness from the treated surface for the SMATed Fe sample and for the SMATed-annealed (at 593K for 30 min) sample [1]](https://thumb-eu.123doks.com/thumbv2/123doknet/14527375.723106/34.892.292.663.120.391/variation-hardness-treated-surface-smated-sample-smated-annealed.webp)
![Fig. 1-10. Empirical relationship between the diffraction peak width with cold work (or plastic strain): (a) diffraction peak width to percentage of cold work for Rene 95 samples [139]; (b): diffraction peak width to](https://thumb-eu.123doks.com/thumbv2/123doknet/14527375.723106/44.892.177.749.119.371/empirical-relationship-diffraction-plastic-diffraction-percentage-samples-diffraction.webp)