HAL Id: tel-01917287
https://hal.univ-lorraine.fr/tel-01917287
Submitted on 8 Jan 2019HAL is a multi-disciplinary open access archive for the deposit and dissemination of sci-entific research documents, whether they are pub-lished or not. The documents may come from teaching and research institutions in France or abroad, or from public or private research centers.
L’archive ouverte pluridisciplinaire HAL, est destinée au dépôt et à la diffusion de documents scientifiques de niveau recherche, publiés ou non, émanant des établissements d’enseignement et de recherche français ou étrangers, des laboratoires publics ou privés.
triaxial loading in relation to the microstructure
Dan Zhao
To cite this version:
Dan Zhao. Study on the creep behavior of clay under complex triaxial loading in relation to the microstructure. Materials Science [cond-mat.mtrl-sci]. Université de Lorraine, 2017. English. �NNT : 2017LORR0372�. �tel-01917287�
AVERTISSEMENT
Ce document est le fruit d'un long travail approuvé par le jury de
soutenance et mis à disposition de l'ensemble de la
communauté universitaire élargie.
Il est soumis à la propriété intellectuelle de l'auteur. Ceci
implique une obligation de citation et de référencement lors de
l’utilisation de ce document.
D'autre part, toute contrefaçon, plagiat, reproduction illicite
encourt une poursuite pénale.
Contact : [email protected]
LIENS
Code de la Propriété Intellectuelle. articles L 122. 4
Code de la Propriété Intellectuelle. articles L 335.2- L 335.10
http://www.cfcopies.com/V2/leg/leg_droi.php
Dissertation presented to obtain the doctor’s degree of
University of Lorraine
by
Dan ZHAO
Special field: Geotechnique
Study on the creep behavior of clay under complex
triaxial loading in relation to the microstructure
To be defended on 18 December 2017 In front of the jury:
Irini Djeran-Maigre Professor INSA Lyon Reviewer Yujun Cui Professor Ecole des Ponts ParisTech Reviewer Pierre-Yves Hicher Professor Ecole Centrale de Nantes Examiner Christophe Dano MCF Université Grenoble Alpes UGA Examiner Mohamad Jrad MCF Université de Lorraine Examiner Mahdia Hattab Professor Université de Lorraine Supervisor Zhenyu Yin MCF-HDR Ecole Centrale de Nantes Co-Supervisor
Laboratoire d'Étude des Microstructures et de Mécanique des Matériaux LEM3 UMR CNRS 7239 - Université de Lorraine
par
Dan ZHAO
Spécialité: Géotechnique
Étude du comportement au fluage de l'argile sous
chargements triaxiaux complexes en relation avec la
microstructure
Soutenue le 18 Décembre 2017 Devant le jury composé de :
Irini Djeran-Maigre Professor INSA Lyon Rapporteur Yujun Cui Professor Ecole des Ponts ParisTech Rapporteur Pierre-Yves Hicher Professor Ecole Centrale de Nantes Examinateur Christophe Dano MCF Université Grenoble Alpes UGA Examinateur Mohamad Jrad MCF Université de Lorraine Examinateur Mahdia Hattab Professor Université de Lorraine Directeur de thèse Zhenyu Yin MCF-HDR Ecole Centrale de Nantes Co-Directeur de thèse
Laboratoire d'Étude des Microstructures et de Mécanique des Matériaux LEM3 UMR CNRS 7239 - Université de Lorraine
I
deformation of clay is generally very problematic due to the complex elasto-viscoplastic properties of the clayey materials. The objective of this research is to analyze the creep behavior of a typical clay along triaxial tests, moreover, to analyze the microstructural mechanisms of creep in order to provide a better understanding of this behavior.
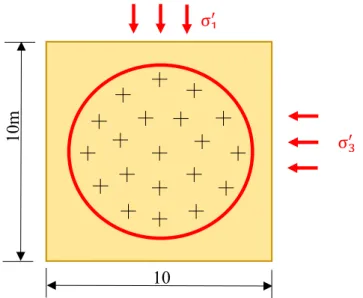
At the macroscopic scale, the method is based on a series of drained triaxial creep tests under constant mean effective stress, where the volumetric creep strain is caused by the sole deviatoric stress variation. Tests are conducted on a saturated reconstituted clayey material by the use of a GDS stress path control apparatus. The development of the axial and volumetric creep strains is studied with respect to time, stress level and overconsolidation ratio.
At the microscopic scale, the study is based on a thorough microstructure analysis using in particular scanning electron microscope (SEM), coupled to an adapted method for the identification of preferential orientations of particles, the pore area and pore shape. This microscopic study is complemented by mercury intrusion porosimetry (MIP) analysis, a method which allows quantifying the pore space and characterizing the local void ratio. The microscope research is developed on two kinds of samples after mechanical loading: one is after shear and another is after creep. Consequently, we can observe the evolution of microstructure of the soil within creep by comparing the results after shear and after creep.
Analysis on the macroscopic results ascertained that both dilatancy and contractancy phenomena could occur during creep. The magnitude of the dilatancy/contractancy during creep was guided by the test conditions: stress level (SL) and the over consolidation ratio (OCR), which specifically governed the direction of the volumetric strain variations. The position of the stress level located in different volumetric domains, defined by monotonic triaxial tests in the (p'-q) plane, controls the evolution of the creep strain and creep strain rate. The three creep
II
stages were identified in different tests. The failure (or tertiary creep) of an overconsolidated specimen could be observed for a stress level located under the maximum strength envelope, but above the critical state line in the (p′-q) plane, accompanied by a significant dilative behavior during creep.
The results of SEM indicated that the microstructural evolution of the clay after the mechanical loading depend on the stress history. Afterwards, the structural evolution in creep phase depends on the structural pattern developed in monotonic loading. The creep contractancy/dilatancy in the macroscopic level were related to the variation of pore size and pore shape at the microscope level.
Keywords: Clay, Kaolinite, Drained creep, Triaxial test, Microstructure, Mercury intrusion
III
qui se développent en fonction du temps, sont complexes et difficiles à prévoir in-situ. Cette question nécessite donc une réflexion approfondie autour des propriétés elasto-viscoplastiques des argiles, et pour leur identification, une démarche expérimentale rigoureuse.
Cette recherche vise à analyser et à identifier, par des essais, le comportement au fluage d'une argile de type kaolinite sous un état de contraintes triaxial. Une investigation fine de l’état microstructural, avant et après fluage, a par ailleurs été réalisée, ce qui a permis de fournir un éclairage complémentaire pour une meilleure compréhension du comportement.
A l'échelle macroscopique, la méthode expérimentale consiste à réaliser une série d’essai de fluage triaxial drainé, les échantillons ayant subi au préalable des chargements purement déviatoriques (sous contrainte moyenne effective constante), à des degrés de surconsolidation différents. L’intérêt de type de chargement se situe dans le fait que la déformation volumique obtenue n’est causée que par la seule variation du déviateur des contraintes.
Les essais sont réalisés sur l’argile reconstituée saturée, au moyen d’un système triaxial automatisé. Les déformations de fluage, axiales et volumiques, sont obtenues en fonction du temps, chaque essai se caractérise par un niveau de contrainte donné et à un degré de surconsolidation donné.
L'étude de la microstructure est basée sur l’analyse de photos de microscope électronique à balayage (MEB), couplée à une méthode adaptée pour l'identification des orientations préférentielles des particules argileuses, et de la distribution et orientation des pores.
Cette étude microscopique est soutenue par des résultats d’essais au porosimètre de mercure (PAM), une méthode qui permet de quantifier et de caractériser l'espace poral, et la distribution des pores.
IV
L’identification de l’état microstructural (MEB et PAM) est réalisée sur des petits échantillons extraits d’éprouvettes (centimétriques) ayant été au préalable sous chargement mécanique. L’investigation est systématiquement menée après le chargement purement déviatorique d’une part, et après le chargement purement déviatorique suivi de l’essai de fluage d’autre part. Cette méthode permet, par la comparaison des résultats, d’observer comment varie la microstructure au cours du fluage.
Les résultats macroscopiques ont permis de constater que des phénomènes de dilatance et de contractance s’amplifient pendant le fluage. Les résultats montrent également que la position, sur le plan des contraintes (p'-q), du niveau de contrainte vis-à-vis des différents domaines volumétriques, contrôle le développement de la déformation au fluage et du taux de déformation.
Ces travaux ont permis de mettre en évidence les trois modes de fluage : primaire, secondaire et tertiaire. Ce dernier apparaît sous forme d’un effondrement de l’échantillon surconsolidé, dont le niveau de contrainte se situe sous l'enveloppe de résistance maximale mais au-dessus de la ligne d'état critique dans le plan (p'-q). Ce comportement de fluage est accompagné d'une forte dilatance qui se développe avant effondrement.
Les résultats de MEB ont montré que l'évolution microstructurale de l'argile, après le chargement mécanique, dépend fortement de l'histoire du chargement.
Mots-clefs: Argile, Kaolinite, Fluage drainé, Microstructure, Essai triaxial, Prosimètre au
V Greek: δ Deformation Normal strain 1 Axial strain d Deviatoric strain v Volumetric strain z Vertical strain
1,creep Axial strain during creep phase
d,creep Deviatoric strain during creep phase
v,creep Volumetric strain during creep phase
δve, dve Elastic volumetric strain increment
δde, dde Elastic deviatoric strain increment
δvp, dvp Plastic volumetric strain increment
δdp, ddp Plastic deviatoric strain increment
̇ Strain rate ̇ 1 Axial strain rate
̇ v Volumetric strain rate
̇ d Deviatoric strain rate
φ Friction angle
σ, σ′ Normal stress, effective normal stress
σ1, σ′1 Axial stress, effective axial stress in triaxial test condition
σ3, σ′3 Radial stress, effective radial stress in triaxial test condition
σ′
z Vertical consolidation pressure
σ′z,pc Initial consolidation pressure
VI γ Unite weight
ζ The maximum strength envelope
Latin:
Cc Compression index
Cs Swelling index
Cα Secondary compression coefficient (Cα=∆e/∆lg t)
Cαe Secondary compression coefficient (Cαe=∆e/∆ln t)
e, e0 Void ratio, initial void ratio
e-creep Void ratio at the end of creep observation in triaxial test
eM Void ratio per gram in mercury intrusion porosimetry
eS Void ratio per μm2 by SEM images
e-shear Void ratio at the end of shear loading in triaxial test H, H0 Height of the soil, initial height of the soil
Ior Structural or void isotropic index
Ip Plastic index
m Slope of the lġ-lg t curve
m1 Slope of the lġ1-lg t curve
mv Slope of the lġv-lg t curve
M Inclination of critical state line
p′ Mean effective stress
p′0 Preconsolidation pressure
q Deviatoric stress
qf Deviatoric stress at failure
Rs Roundness of pores
t100 Time of the primary consolidation
tcreep Creep time
u,∆u Pore water pressure, excess pore water pressure
w Water content
wL Liquid limit
wP Plastic limit
υ Poisson’s ratio
VII OCR Over consolidation ratio PDST Purely deviatoric stress path PWP Pore water pressure
VIII
Contents
Abstract ... I
Résumé ... III
List of symbols and abbreviations ... V
General introduction ... 1
Background of this study ... 1
Objectives and organization of the thesis ... 2
Chapter 1 Literature review ... 4
1.1 Macro approach to creep of clay ... 4
1.1.1 One-dimensional creep test ... 5
1.1.2 Triaxial creep test ... 12
1.1.3 Other creep tests ... 22
1.1.4 Field creep tests... 24
1.2 Shear dilatancy/contractancy related to creep... 25
1.2.1 Typical shear dilatancy/contractancy equations ... 26
1.2.2 Evolution shear dilatancy/contractancy during creep ... 26
1.3 Micro approach to creep of clay ... 28
1.3.1 Structural mineralogy of clays ... 29
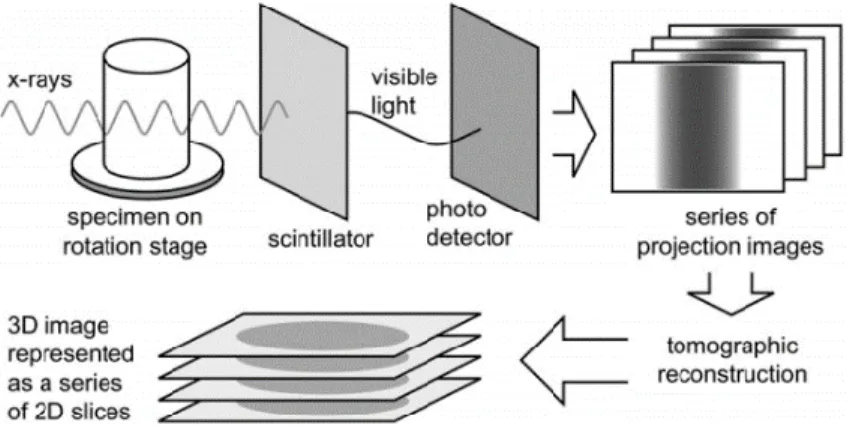
1.3.2 Methods for identification of clay microstructure ... 35
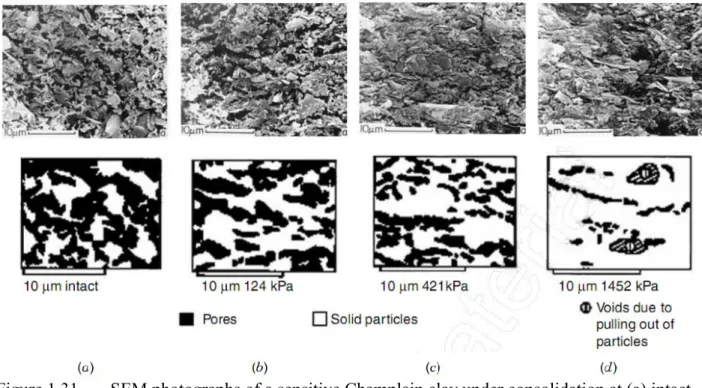
1.3.3 Evolution of clay microstructure under different stresses ... 39
1.3.4 Evolution of clay microstructure related to creep ... 44
1.4 Conclusions ... 46
1.4.1 Macroscopic study of creep ... 47
IX
2.2.1 Axisymmetric triaxial tests ... 53
2.2.2 Calculation of test parameters ... 66
2.3 Microscopic research techniques ... 68
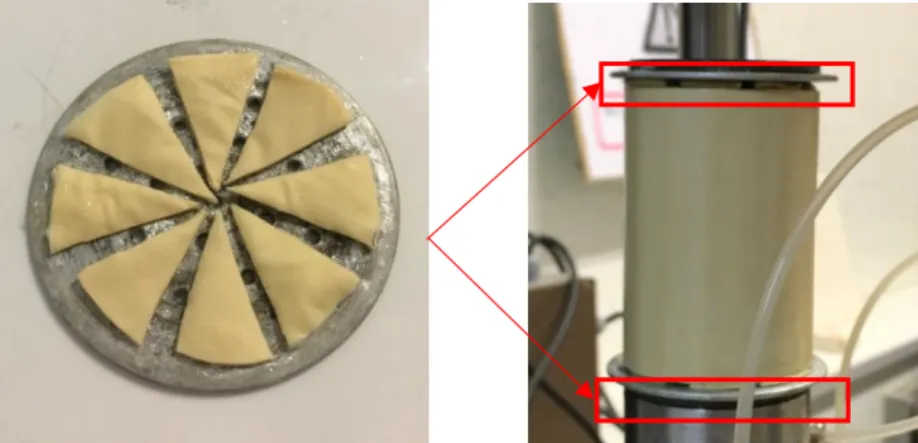
2.3.1 Preparation of specimens for MIP and SEM ... 68
2.3.2 Mercury intrusion porosimetry (MIP) ... 72
2.3.3 Scanning Electron Microscope (SEM) technique and method of analysis ... 76
2.3.4 Method of analysis of particles and void ... 79
2.4 Conclusions ... 83
Chapter 3 Creep behavior and strain mechanisms ...84
3.1 Strain mechanisms along purely deviatoric stress path ... 84
3.1.1 The 3 domains of deformation on (p′-q) plane ... 84
3.1.2 The Kaolin K13 clay behavior ... 86
3.1.3 Discussions ... 99
3.2 Identification of creep behavior related to the dilatancy phenomenon ... 100
3.2.1 Introduction of the creep phase ... 100
3.2.2 Creep analyses in (ε1- εv- q) and (e-log p′) plane ... 101
3.3 Influence of stress condition on creep evolution ... 107
3.3.1 Case of test P010 ... 108
3.3.2 Creep evolution in normalized (p′-q) plane ... 111
X
3.4 Evolution of creep strain rate ... 114
3.4.1 Axial strain rate ... 114
3.4.2 Volumetric strain rate ... 119
3.5 Evolution of deviatoric strain ... 122
3.6 Summary and discussion... 124
3.6.1 Dilatancy rate ... 124
3.6.2 Viscoplasticity evolution ... 126
3.6.3 Summary ... 127
Chapter 4 Microscopic characterization of clay related to creep ...129
4.1 Quantitative analysis of clay structure evolution ... 129
4.1.1 In contractancy domain ... 129
4.1.2 In pseudo-elastic domain ... 133
4.1. 3 In dilatancy domain... 135
4.1.4 Structure evolution with the variation of stress ... 137
4.1.5 Discussion ... 143
4.2 Evolution of the pores ... 143
4.2.1 Pore orientation ... 144
4.2.2 Pore space by SEM and MIP techniques ... 150
4.2.3 Pore shape ... 158
4.3 Conclusions ... 164
Conclusions and perspectives ...166
Summary and conclusions ... 166
Perspectives... 168
References ...170
1
General introduction
Background of this study
In fact, every soil ‘‘lives’’ in all properties undergo changes with time, this time-dependent mechanical process may lead to composition and structural changes that result in stiffening, strength gain, softening or strength loss, etc. Clayey soils are complex materials that consists of more than 30% of fine particles whose size is less than 2 μm (Lambe & Whitman, 1969) which have a great influence on the physical, mechanical and physicochemical properties inside these materials.
When soil is subjected to a constant load, it deforms over time, and this is usually called creep. Clayey soils exhibit all the time-dependent properties, where creep is the most typical, pronounced and readily observed. Clayey soils usually display large creep deformations, in the form of prolonged settlements, tilts of buildings and geotechnical structures, or slowly slippage of slopes and embankments, influenced by the composition, stress history, change in temperature, and biochemical environment of these soils.
Large amount of researches have been conducted on creep of soil since the middle of 19th
century due to the intensive building activities; the first highlighting phenomenon of the creep in clay can be found in “Bases and Foundation” by V. Karlovich in 1869. Afterwards, a lot of creep tests have been performed. Most of the previous laboratory experimental studies on creep, performed on clay, have focused on the stress-strain-time relationship through drained and undrained oedometer and triaxial tests. This time-dependent relationship should be based on drained, rather than on undrained, test results because pore water pressure build-up in an undrained creep process results in the decrease of the mean effective stress. This is contradictory to the condition of constant stress during creep. From this point of view, experimental studies on drained creep conditions can provide a better understanding of the creep phenomenon.
In reality, time-dependent deformations are significantly resulting from the time-dependent or viscous adjustment of the soil structure to reach a new equilibrium under the external stress. Microstructure of soils remained largely unknown until suitable optical, X-ray diffraction, and electron microscope techniques made direct observations possible starting in the mid-1950s. Thereafter, there are some proposed theories to elucidate the mechanisms of creep, for instance,
2
necessity. The structural interpretation of the mechanical behavior of soil may be expected to give a proper understanding of its time-dependent constitutive relation. At present, the study on microscopic mechanism of creep for soft clay is still in its infancy due to the limitations of experimental technique and a lack of experimental data.
The study on creep of soils are important not only due to the direct application of the results to solve practical problems, but also because the results can be used to obtain fundamental information about soil structure, inter particle bonding, and the mechanisms that controll the strength and deformation behavior.
Thus, attempts were made to introduce the creep mechanism of clay from first the view of phenomenological approach and macromechanics, and then the micromechanics endeavors to deduce its structural properties. Emphasis in this research is on how time under stress changes the deformation, strength and structural properties of clay, what can be learned from knowledge of these changes, as well as their quantification for predictive purposes.
Objectives and organization of the thesis
The aim of this study is to try to understand how the creep evolve, in clayey materials at macroscopic scale under a given stress path, and how the corresponding microstructural changes within time.
The investigation consists in conducting a literature review, a laboratory experimental program and an analytical program. Experimental research are conducted on normally consolidated and overconsolidated saturated reconstituted clay under different constant sustained stresses in a certain creep duration. The microscope study is based on a thorough microstructure analysis using in particular scanning electron microscope, coupled to an adapted method for the identification of preferential orientations of particles. This microscopic study is complemented by mercury
3
intrusion porosimetry analysis, a method that allows quantifying the pore space and characterizing the local void ratio.
The detailed organizational list of the thesis is as follows:
A general introduction to the time-dependent deformation of clay is provided.
Chapter 1 contains a summary of the existing state-of-the-art on the creep of clayey soils, including macroscopic studies and microscopic studies.
Chapter 2 presents the clayey materials and experimental methods that are used in this study. Chapter 3 gives the results of macroscopic experiments, which includes three groups of drained triaxial creep tests under different preconsolidated pressures (p′0=200 kPa, 800 kPa and 1000 kPa).
The evolution of creep strains as well as strain rates with respect to time, stress level and overconsolidation ratio are presented.
Chapter 4 proposes the results of the microscopic experiments of two groups of samples: six samples from creep test series with p′0=1000 kPa and six samples in conventional shear tests that
follows exactly the same stress path as in creep tests. Results of scanning electron microscopy and mercury intrusion porosimetry are compared on soils after shear and after creep.
4
mechanical characteristics of creep in the view of soil mineralogy.
A lot of creep tests have been performed (Bishop & Lovenbury, 1969; Mesri, 1973; Tavenas et al., 1978; Tian et al., 1994; Fodil et al., 1997; Yin, 1999; Zhu et al., 1999). The problem of creep in clayey soils has not been completely assessed. The treatment of creep remains problematic due to the complex elasto-viscoplastic properties of the clayey materials. The literature review given in this chapter provides some insight into the behavior of creep in soils.
1.1 Macro approach to creep of clay
When soil is subjected to a constant load, it deforms over time, and this is usually called creep. Figure 1.1 shows a schematic diagram of a typical creep curve of soil: from point A to B is the stress path, the creep starts when the soil sample is deformed to point A (Figure 1.1a), meanwhile, the stress is kept constant (Figure 1.1b). As time goes on, the strain of soil increases gradually (Figure 1.1c).
(a) (b) (c) Figure 1.1 Creep test:(a) stress-strain; (b) stress-time; (c) strain-time
Creep properties of clay under different stress conditions are summarized in the following: one-dimensional compression, triaxial shear, unconventional complex stresses, and large-scale field tests. Among which, laboratory creep tests are the main approach to understand the creep characteristics of soil. Compared with the field test, the laboratory test has characteristics of easy
5
long-term observation, strict controlling in test conditions, repeated trials and less cost. Therefore, the in-door testing methods are more used in the current research for creep.
1.1.1 One-dimensional creep test
In one-dimensional creep test, the effective vertical stress, σv′, is maintained constant, and the
vertical deformation with the development of time can be measured directly. One-dimensional creep characteristics are the simplest and most basic, which mainly answering the following questions: (1) what is the secondary compression and the secondary compression coefficient; (2) how the compression coefficient evolves; (3) how to determine the secondary compression coefficient.
1.1.1.1 Secondary compression and the secondary consolidation coefficient
In the conventional one-dimensional consolidation test, for each stage of loading, the deformation of soil is mainly due to the compression in primary consolidation, the pore water pressure dissipation and the secondary compression (Bjerrum, 1967; Graham et al., 1983; Fodil et al.,1997). Yin (1999) summarizes the volumetric creep strain mechanism under the drainage condition: (a) the primary stage, under the vertical load, the compression deformation causes the volume to decrease whereas an increase in pore water pressure. The deformation of the soil caused by the dissipation of the pore water pressure is much less than that caused by compression. (b) the secondary stage, the pore water pressure dissipated to its initial value and the volume variation of soil is mainly caused by dissipation of pore water pressure. (c) the third stage, deformation of soil after the dissipation of the pore water pressure, i.e., the pure creep stage.
Buisman (1936) pointed out that the relationship between deformation and the logarithm of time is essentially linear in the secondary compression stage, moreover, he presented that creeping of clays never ends. A 43 years’ oedometer creep test performed by Vienna University of Technology on an organic clayey silt proved his point of view (Figure 1.2). It is seen that, under a final 163 kPa constant vertical stress, the settlement of soil continued to develop within 43 years and didn't show a stable state at the end of test.
6
Figure 1.2 Relationship of settlement as a function of logt of an organic clayey silt in oedometer test by Vienna University of Technology (1971-2013), Brandl (2013) Figure 1.3 shows a typical relationship between void ratio and the logarithmic time in the one-dimensional creep test. The curve is in the S-shape, which can be divided into two parts: the main consolidation stage and the secondary consolidation stage. The time t100 (or tEOP) at the transition
is the approximate time of the end of the primary consolidation. The subsequent deformation is the secondary consolidation, that is, creep under constant effective vertical stress. In the secondary consolidation stage, the slope of the void ratio versus logarithmic time is defined as the secondary consolidation coefficient:
𝐶𝛼= −∆ log 𝑡∆𝑒 or 𝐶𝛼𝑒 = −∆ ln 𝑡∆𝑒 (1.1)
7
It is noteworthy in literatures that many attentions have been paid to the evaluation of the referenced time, t100. The concern is to decide when the creep deformation starts, and the
referenced time is especially crucial to estimate creep deformation in low permeability clay. The approaches, i.e. hypotheses A and B (Ladd et al., 1977), are as follows:
- Hypothesis A assumes that the secondary compression (creep) occurs only after the primary compression. The strain at EOP is a unique value, which means that the soil show time-independent creep behavior during dissipation of pore pressure in a manner that affects the strains at EOP. The reference time is taken as an intrinsic parameter for a given soil and independent of drainage condition and soil thickness (Ladd et al., 1977; Mesri & Choi, 1985).
- Hypothesis B assumes that creep take places within the whole consolidation process, which implies that the value of strain at EOP is not unique. The time-dependent strain occurs since the primary compression. The t100 is taken as the time at EOP, its value thus varies with the drainage
condition of the sample (Suklje, 1957; Wahls, 1962; Bjerrum, 1967; Barden, 1969; Crawford, 1986; Kabbaj et al., 1986).
The assumed strain versus time relationships based on the two hypotheses are shown in Figure 1.4, and general agreement on whether there is a combination of primary and secondary compression during the dissipation of pore pressure is still not reached (Berre & Iversen, 1972; Leroueil et al., 1985; Duncan et al., 1996). It is agreed to some extent that the real soil behavior is most likely in a middle state other than the extreme cases in the two hypotheses (Augustesen et al., 2004). Aboshi (1973) performed different scales of experimental oedometer creep tests on muddy clay, which the thickness of samples varies from 2cm to 100 cm, whose results confirmed that the strain developed at EOP gradually increased with thickness: denial of hypothesis A; meanwhile, the secondary curves do not converge to a single line: denial of hypothesis B.
8
The traditional understanding of the creep behavior within oedometer creep test in shown in Figure 1.3, i.e., the secondary compression (or creep) follows a linear function in plot of e-logt or v-log t. This type of curve may be valid for several log cycles of time, but the results of long term
(140 days) creep tests by Leroueil et al. (1985) on Batiscan clay under different vertical stress showed a general non-linear strain-time behavior. It is seen in Figure 1.5 that:
- Type I corresponds to the overconsolidated soil, the vertical stress is less than the preconsolidation stress, no significant cross-point is between the primary consolidation and secondary consolidation.
- Type II corresponds to a normally consolidated sample which the vertical consolidation pressure is close to the preconsolidation stress, and the slope of v-logt during secondary
compression is significantly larger that of type I.
- Type III is a normally consolidated sample and vertical consolidation pressure is much higher than the preconsolidation pressure, and the slope of v-logt curve is gradually reduced, showing by
an obvious anti-S shape as shown in Figure 1.3.
9
The general strain-time behavior has also been observed by Leonards & Girault (1961), Bjerrum (1967), Berre & Iversen (1972), and Yin (1999). However, Yin et al. (2013) considered that the classification method shown in Figure 1.5 is open to objection, that is, no discrimination has been made between remolded soil and the structural undisturbed soil. Only the strain-time relations of structural soil can be divided into these three types. Moreover, the v-logt curve of type
II is most likely corresponds to the destruction of soil structure and this deformation pattern is independent of the preconsolidation pressure (Yin et al., 2011; Yin & Wang, 2012). The deformation pattern of remolded normally consolidated soil should be similar to type III in Figure 1.5.
Oedometer creep tests were also performed by the author on remolded normally consolidated Kaolin and Shanghai clay (see details in Annex Chapter 1), and the strain-time relation is consistent with type III in Figure 1.5. The time note, t100 that identified by the linear part of the anti “S” shape
e-logt curve, was found to be stress-dependency (Figure 1.6), similar results were obtained for
other experimental results on Shanghai clay after Zhu (2014), Hong Kong marine deposits (after Yin J-H, 1999) and Vanttila clay (after Yin, et. al., 2011).
10
Bjerrum (1972) considered that Cαe was related to the preconsolidation pressure. Leroueil et al.
(1985) noted that Cαe was associated with vertical stress. Fodil et al. (1997) found that Cαe
increased with the increase of σ′
z. However, when σ′z was above the preconsolidation pressure the
increase was less significant, which was consistent with the conclusions of Murayama & Shibata (1961).
Mesri & Godlewski (1977) conducted one-dimensional consolidation tests of remolded soil and natural soil with different OCRs. The results indicated that Cαe was related to the state of soil:
for natural undisturbed soil, Cαe increased gradually with the increase of σ′z then decreased after
reaching a peak; whereas the parameter Cαe for remolded soil varied in a small range, thus can be
regarded as independent with vertical stress. Experimental results on remolded Kaolin and Shanghai clay (Figure 1.7) also shows the stress-dependency.
Figure 1.7 Parameter Cαe as a function of vertical stress
It can be concluded, to some extent, that Cαe depends not only on the applied effective stress
but also on the preconsolidation pressure. The value of Cαe increases while σ′z approaches initial
11
remain constant (Ladd & Preston, 1965; Tavenas et al., 1978; Graham et al., 1983; La̎nsivaara & Nordal, 2000; Augustesen et al., 2004).
Yin et al. (2010, 2011) considered that the creep behavior of a soil must be analyzed separately being intact or remolded: for natural soft clay, the analysis of Cαe should integrate the over
consolidation, density or void ratio, particularly the structure of soil and other status characteristics, the relationship of Cαe with the vertical stress is more likely superficies. They also summarized
values of Cαe for 24 typical remolded and undisturbed clays, and found that the values of Cαe varied
from 0.004 to 0.137. It is considered that the secondary compression coefficient of soft clay is associated with many factors and thus it is difficult to obtain a constant value. Therefore, a certain value of Cαe should correspond to a specific condition.
Walker & Raymond (1968) pointed out that the secondary compression rate appeared to be linearly to the compression index. Mesri (1973) have suggested to represent the results in terms of the Cαe -Cc relation, which makes it possible to highlight the relation of stress-compressibility with
time. Based on the results of 22 natural soil deposits, Mesri & Godlewski (1977) proposed that there was a unique relationship between Cαe and Cc. They found a range of values for Cαe /Cc was
between 0.025 and 0.1 and the magnitude of Cαe /Cc seems to related to the type of soil. The values
of Cαe /Cc were small for some clays and silts, medium for organic silts and clays, and in general
high for peats. For a majority of inorganic clays, the value of Cαe /Cc equals 0.04 ± 0.01, and 0.05
± 0.01for highly organic plastic clays (Mersi & Castro, 1987).
Secondary compression occurs after the dissipation of pore water pressure, and is mainly caused by un-recovered inelastic deformation of the solid skeleton due to creep. The parameter Cαe
represents inelastic deformation in secondary compression, whereas the compression index Cc
indicates both elastic and non-elastic deformations. Therefore, the ratio of Cαe/Cc may lead to
inaccurate understanding on the secondary compression behavior. Yin et al. (2011) proposed to represent the secondary compression behavior on the Cαe - (Cc -Cs) plane instead of Cαe-Cc, where
the term (Cc -Cs) only includes non-elastic deformation similar to Cαe. Yin et.al (2012) further
showed that the parameter (Cc -Cs) can be considered as constant from results on 5 types of
remolded clays, and the variation of Cαe as a function of (Cc -Cs) is considered to be caused by the
evolution of Cαe with applied stress or soil density. The experimental results performed on Kaolin
and Shanghai clay by the author of this thesis showed that the values of Cαe - (Cc -Cs) were not
12
Similar experimental results on remolded Kaolin and Shanghai clay by the author of the thesis were also obtained (Figure 1.8). It is seen that the value of Cαe shows a decrease tendency with
time, after one day, a recommended duration to perform oedometer test, the decrease tendency is slowed down but have not terminated at a constant value.
Figure 1.8 Parameter Cαe as a function of time for kaolin clay and Shanghai clay
1.1.2 Triaxial creep test
In triaxial creep test, the axial stress and radial stress are maintained constant, the evolution of deformation with time can be measured directly. According to the drainage conditions, triaxial creep test can be divided as (Figure 1.9): (a) drained creep, where the main effective stress p' and deviatoric stress q remain constant; (b) undrained creep, in which the deviatoric stress is constant while p' decreases caused by a building up of pore water pressure. Triaxial creep properties are the basis of three-dimensional constitutive model of creep, in which the main problems can be answered: strain-stress-time evolution.
13
(a) (b)
Figure 1.9 Triaxial creep tests under drained and undrained conditions (a) drained creep; (b) undrained creep
1.1.2.1 Undrained creep test
It is well-known that the typical strain-time relationship observed in triaxial creep test can be divided into three phases (Mitchell, 2003; Sheahan, 1995), as illustrated in Figure 1.10. The primary, secondary and tertiary creep, which sequentially corresponds to a decrease strain rate with time, following by a nearly constant creep rate, and then an accelerating rate eventually leading to failure of the soil (donated as creep rupture).
Figure 1.10 Definition of primary, secondary and tertiary creep
In the primary phase of creep, the strain rate decreases with time, and the relationship of loġ
14
proposed. For soils subject to failure during undrained creep, the time to failure is usually a negative exponential function of the stress. For stresses greater than some limiting values below which no failure develops even after very long times.
Many tests show that the three phases of creep are difficult to be wholly observed under single load stage. Basically, most soils have the primary creep following application of a stress, and turn to the tertiary creep directly in the case of high stress level, without showing of the secondary creep phase (Singh & Mitchell, 1968; Arulanandan et al.; 1971; Stepanian, 1975; Hicher, 1985; Vyalov, 1986; Augustesen et al.,2004). Mitchell (2003) considered that the secondary creep was rarely being observed in laboratory tests because of a true steady state can exist only within constant structure and stress conditions, which conditions are likely only for a fully destructured soil. Additionally, a constant rate of strain must be identified within the limits of the measuring instrument as well as the strain rate calculation.
Figure 1.11 Typical relationship of creep strain rate with time under different stress level in undrained creep (after Zhu, 2007)
Singh & Mitchell (1968) proposed a phenomenological equation to describe the linear relationship of creep strain rate versus time after investigating a number of creep test results, to
15
describe the primary phase of creep in the range of stress levels commonly encountered in engineering practice. They defined the creep parameter m, controlling the rate at which the strain rate decreases with time, which was the absolute value of slope of the straight line on the log strain rate versus log time plot, being
𝑚 = −∆ log 𝜀̇∆ log 𝑡 (1.2) The values of m were found to fall between 0.75 and 1.0 whatever the tests conditions of the soil: undisturbed or remolded, normally or overconsolidated, drained or undrained. Furthermore, they suggested that for a given soil, the value of m was independent of stress level. Consequently, a semi experimental equation of the interrelation among creep strain rate, stress level and creep duration was developed, being:
𝜀̇ = 𝐴𝑒𝛼𝐷(𝑡1 𝑡)
𝑚 (1.3)
where A, α and m are soil creep parameters (Singh & Mitchell,1968; Mitchell, 2003), D can be deviatoric stress or stress level. t1 is a reference time (e.g., 1 minute) and t is the elapsed time after
creep. The scope of the application of this formula was discussed by Walker (1969a), Tavenas et al.1978, Borja & Kavazanjian (1985), Li & Lin (2000) and Zhu (2007).
a) Strength softening in undrained creep
In general, during the undrained creep, the undrained strength of saturated clay is reduced within long-term test condition (Saito & Uezawa, 1961; Singh & Mitchell,1969; Hicher, 1985; Yin & Karstunen, 2011). The long-term undrained shear strength is generally lower than that obtained in conventional undrained shear test. Casagrande & Wilson (1961) showed that the shear strengths of 6 brittle undisturbed soils were found to be reduced to 40-80 percent of their normal values in 30 days, similar tendency was also reported by Goldstein & Ter-Stepanian (1957), Vialov & Skibitsky (1957) and Yin et al. (2013) on natural soft clays.
Loss of strength during creep is important in clays within undrained conditions, because it’s in connection with the stability of constructions on clay. Mitchell (2003) pointed out that the strength loss during creep may be explained as follows:
- If a significant portion of soil strength is due to cementation, and then creep deformation causes the failure of cemented bonds, thus, the strength will be lost.
- The strength depends on effective stress, if creep causes changes in effective stress then the strength changes will also occur.
16 formation of shear band.
b) Water pressure evolution
Another investigation related to the undrained creep is the excess porewater pressure. Holzer et al. (1973) preformed undrained creep test on San Francisco Bay mud, they found that the magnitude of the increased pore pressure was a function of the initial consolidation stress, except the amount that occurred immediately after the shear stress is applied. The undrained creep test on Leda clay by Walker (1969b) showed that the excess pore pressure could reached 20% of the cell pressure. Moreover, the creep strain, i.e., the secondary compression effect, and pore pressure are directly related. Two equations were derived to describe the proportional relation between pore pressure and mean effective stress. Similar result was found by Shen et al. (1973) on a soft marine clay. Arulanandan et al. (1971) pointed out that the pore pressure developed during undrained creep was due to not only the secondary compression but also to the deviatoric stress. The magnitude of pore water pressure built up in secondary compression was found to be time and structure dependent, based on the experimental results of a costal organic silt clay.
1.1.2.2 Drained creep test
Deep understanding of stress-strain-time relationship within creep phenomenon allows to enrich the constitutive models. Tavenas et al. (1978) proposed that the time dependent constitutive model should be based on drained test results rather than undrained tests, considering the decrease of p′ caused by building up of pore water pressure in undrained creep process, which conflicts with the postulate of constant stress conditions for creep. The creep behavior is required first to be understood then can be used to develop constitutive model. The experimental research on drained creep behavior is of fundamental importance for understanding and modelling the time-dependent stress strain behavior of soil.
17
One of the main acquisition in drained creep test is to reveal the evolution of creep strain and strain rate. Under the drained condition, volume change of soil is allowed within the creep process. Tavenas et al. (1978) concluded that the development of volumetric strain rate with time for a lightly overconsolidated clay could also be represented by means of parameter m with reference to the work of Singh & Mitchell (1968). For more clarity, we choose to define the creep parameter
m in the form of m1 and mv, which are the slopes of the straight lines on log axial and volumetric
strain respectively rates versus log time.
a) Axial creep strain
A general axial strain versus time behavior during drained creep is similar as within the undrained creep test shown in Figure 1.10, and the magnitude of axial creep strain is generally increased with stress level. The evolution of axial creep strain rate thus be subject to numerous investigations.
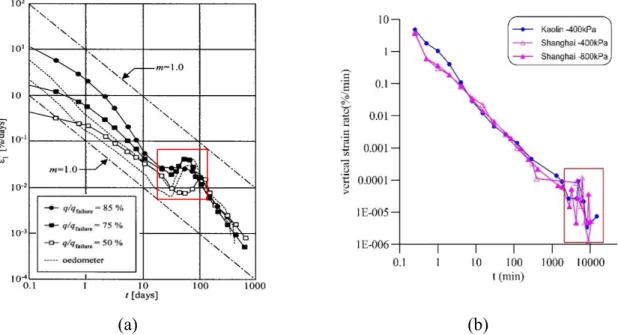
Based on the drained triaxial creep tests on intact Pancone clay, Bishop & Lovenbury (1969) noted that m1 increased with deviatoric stress level. Augustesen et al. (2004) reproduced the test
data of Bishop & Lovenbury (1969) on drained triaxial tests and oedometer tests (Figure 1.12a), an “abrupt” change in the strain rate between 20 and 100 days was highlighted, which was interpreted as a limited instability causing by a fundamental modification in soil structure. Kabbaj et al. (1986) pointed out that the abruption in strain rate within oedometer test might corresponds to a creep delay, which occurs at a transition state from overconsolidated to normally consolidated. The strain rate for remolded normally consolidated Kaolin and Shanghai clay, in drained oedometer creep tests performed by the author of the thesis, also exhibits fluctuation after 2 days.
Tavenas et al. (1978) concluded that m1 increased slightly with the shear stress with an average
value of 0.76. D’Elia et al. (1991) performed long-term drained triaxial creep tests on Santa Barbara clay, and found that the strain rate was negligible up to a stress level of 0.65, and the value of m1 was small, typically between 0.45 and 0.6. Based on drained triaxial creep tests on
undisturbed marine sediments, Tian et al. (1994) pointed out that m1 was a function of the
deviatoric stress. The authors also indicated that m1 appeared strongly dependent on the plastic
properties of the clayey material. For high-plasticity clays, the value of m1 increased with
deviatoric stress, while no significant variation was observed for low-plasticity clays. Den Haan & Edil (1994) reported that the common value of m1 was between 0.7 and 0.9, and seems to be
18
the time, and the axial strain rate increases with deviator stress or stress level.
(a) (b)
Figure 1.12 Axial strain rate as a function of time: (a) reproduced results of drained creep tests and oedometer tests on Pancone clay by Bishop & Lovenbury (1969) (Augustesen et al.,
2004); (b) oedometer tests on remolded Kaolin and Shanghai clay
b) Volumetric creep strain
It is generally accepted that under drained triaxial loading on saturated clays, the normally consolidated and lightly overconsolidated clays exhibit contractant behaviour (Bishop & Lovenbury, 1969; Shibata & Karube, 1969), whereas heavily overconsolidated clays can exhibit dilatant behaviour (Henkel, 1956; Roscoe & Burland, 1968; Shimizu, 1982; Biarez & Hicher, 1994; Hattab & Hicher, 2004). In most of the experimental approach to the creep of soil, the analyses have been focused mainly on the axial strain and axial strain rate. Little analyses have been
19
conducted on the evolution of volumetric strain, so does for the dilatant behavior, especially in large range of overconsolidation ratios.
In the conventional triaxial test, where the confining pressure σ׳3 is constant, the contractant
creep behaviour was observed by Tian et al. (1994) on normally consolidated undisturbed marine sediments. The results show that εv varied in positive correlation with different stress level (i.e., εv
increases with the increase of the stress level), and the values of parameter mv referring to
volumetric strain rate were different with m1 referring to axial strain rate. The contractant results
were also obtained by Zhu (2007) on normally consolidated remolded Hong Kong marine deposits. However, the evolutions of εv within creep were quite close in spite of variations of the stress level.
Kong et al. (2011) found that the overall volumetric creep strain for undisturbed normally consolidated Zhanjiang clay was contraction under constant σ′3 stress path, while a certain
contraction and dilatancy alternately appear during creep when σ′3 was within the material’s
structural yield stress (Figure 1.13). It can be seen that the contractant/dilatant behaviour during creep relates to the loading condition before creep and this relation was highlighted on structural soils.
Figure 1.13 Volumetric strain curves time in drained creep of Zhanjiang clay (Kong et al., 2011)
Tavenas et al. (1978) performed drained creep triaxial tests on undisturbed lightly overconsolidated Saint-Alban clay along different stress paths. The authors observed that εv was
obviously influenced by the mean effective stress p׳. Under the increased p׳ stress path (line 1 and line 2 in Figure 1.14, which line 2 translates σ′3 constant stress path) a contractive creep was
detected and the magnitude of εv increased with the stress level, whereas values of mv decreased
20
Figure 1.14 Variations of the creep parameter m for volumetric and axial strains with the stress condition, reproduced from Tavenas et al.,1978
Contraction related to creep was detected by Sekiguchi (1973) on normally consolidated remolded Fujinomori clay through constant p׳ creep tests, and the variation of εv was found to be
dependent on the increment and magnitude of effective stress level. Similar to the decrease p׳ stress path test performed by Tavenas et al. (1978), D’Elia et al. (1991) performed long-term drained triaxial creep tests on intact Santa Barbara clay under a stress path with σ׳3 decreasing and σ׳1
constant. The results show a dilatancy phenomenon for low confining pressure. The dilatant creep was observed for dense sand under high deviatoric stress by Murayama et al. (1984) under
p׳=constant loading.
The overconsolidation condition is not the only factor that influences the volumetric performance (contractancy/dilatancy) during creep, the stress path or stress condition before creep under progressive stress seem to also matter. Thus, it is necessary to develop a clear understanding on the effects of the stress conditions before creep on the volumetric behavior. Afterwards, the
21
evolution of volumetric creep strain rate can be investigated. Augustesen et al. (2004) also noted that the determination of mv was associated with some uncertainty compared with the
determination of m1. Yin et al. (2013) pointed out that the value of mv implied the concept of strain
acceleration, and the relationship between the creep rate and the characteristic parameters of clay needed to be further studied.
c) Deviatoric creep strain
Due to the known coupling effects between shearing and volumetric plastic deformations in soils, an increase in either mean pressure or deviator stress can generate both types of deformations. Creep behavior is no exception. Time-dependent shear deformations are usually referred to as deviatoric creep or shear creep. Time-dependent deformations under constant stress referred to as volumetric creep, which the secondary compression is a special case of volumetric creep. Deviatoric creep is often accompanied by volumetric creep.
The relationship between deviatoric strain, and axial and volumetric strains can be obtained: ε𝑑 = 𝜀1−𝜀𝑣
3 (1.4)
Kavazanjian & Mitchell (1977, 1980) suggested that the time-dependent strains be described by separated but not independent consideration of deviatoric and volumetric stains. Tavenas et al. (1978) confirmed the validity of the separation of volumetric and deviatoric strain components, and proposed an equation to describe the deviatoric strain with time:
𝜀𝑑̇ = 𝐴𝑔(𝜎′)(𝑡𝑡1)𝑚 (1.5)
where parameter A and m are defined as in Equation 1.3 by Singh & Mitchell (1968). The stress function g(σ′) may be expressed with the reference to the stress level.
Similar work was conducted by Tian et al. (1994), the time-dependent deviatoric strain and strain rate could be described by the power law as in Equation 1.3 by Singh & Mitchell (1968) and Equation 1.5 by Tavenas et al. (1978). The evolution of deviatoric strain and strain rate with time indicated limited variations compared with the axial strain rates for two undisturbed marine sediments. Zhu (2007) proposed an empirical hyperbolic equation to fit the development of deviatoric strain with time:
𝜀𝑑̇ =𝑀−𝜂𝜂 𝑎1 2𝑎
2
(𝑎1+𝑎2𝑡)2 (1.6)
22
1.1.3 Other creep tests
The stress states in actual projects are much more complicated than the one-dimensional and triaxial stress state. Therefore, it is necessary to perform some creep tests within other stress condition, especially under complex stress, such as unconventional laboratory test and field tests.
1.1.3.1 Direct shear creep test
Tests under direct shear are widely used in geotechnical laboratories. The special condition in which shear of soil structure is possible to be reviewed under direct shear. If the drainage conditions are maintained properly, the test results can be consisting with those obtained from compressive tests in triaxial apparatus (Maslov, 1935).
General procedure of this test on soil can be divided into the two parts: the first part is the application of stress for the consolidation of soil; after (the primary) consolidation during which the pore water pressure is supposed to dissipate, shear is gradually applied.
Under a constant shear stress τ, the general shear strain γ and time curves within direct shear creep test is shown in Figure 1.15, where the primary, secondary and tertiary parts of direct shear creep are illustrated as OA, AB and BC segments. Results of Meschyan (1995) showed that under lower shear stress mobilization τ/τf (where τf is the shear strength of the tested soil); only primary
creep phase was observed. The secondary creep phase was recorded with shear mobilization was 0.5- 0.9 with up to 60% of deformation occurred in the primary phase. The τ/τf - γ curves can be
approximated by a bilinear diagram, as suggested by Geuse & Tjong-Kie (1953). Luo & Chen (2014) performed direct sheer creep on a marine sediment and found that γ increased with τ, when τ was increased to a peak strength, the soil was damaged in quite short time. The direct shear creep failure was mainly controlled by shear stress rather than the accumulation of shear strain. Similar tendency was obtained by Zhu et al. (2014).
23
Figure 1.15 Shear strain γ and time curves under different shear stress τ in direct shear creep test (Meschyan, 1995)
Although the direct shear creep test is easy to operate, its shortcomings are also obvious. Within the direct shear condition, the shear failure surface is artificially fixed by the shear boxes, rather than the weakest damage surface of the specimen. Moreover, the shear stress distribution on the shear plane is not uniform, the drainage condition is hard to control as well as the measurement of pore water pressure, thus, limited investigations on creep behavior of soil by direct shear test have been made.
1.1.3.2 Pressuremeter creep tests
A pressio-triax creep test is performed by setting a cylindrical pressuremeter vertically into the tested material, pressure is applied into the pressuremeter resulting in the expansion of the surroundings film. Thus, the surrounding material is compressed and deformed under the stress transferred from the expanded film. The mechanical properties can be obtained through the relationship between the applied pressure and deformation of tested material.
Several methods based on pressuremeter testing have been proposed to determine the creep properties of frozen soils (Baguelin et al.,1978; Ladanyi & Johnston,1973; Kjartanson et al. 1988; Bahar et al. 1995). A research team of Hicher (Rangeard et al., 2003; Yin, 2006, Yin & Hicher, 2008) developed a laboratory pressio-triax apparatus for soils with better controlling of boundary conditions and soil uniformity than the general tightly controlled laboratory conditions by Zentar (1999) and Rangeard (2002). The pressuremeter test conditions can be reproduced in a triaxial cell, one special function is that the evolution of pore water pressure along the hole of pressuremeter
24
displacement and pore water pressure. Values of the parameters obtained from pressuremeter tests agreed with those obtained from triaxial and oedometer tests.
1.1.3.3 Rheometer creep test
The application of rheometer techniques in soil mechanics is uncommon, but they have key advantages: short test time, small size of samples and simple specimen preparation. The rheological approach is based on a mixed behavior of elasticity, viscosity and plasticity (Ghezzehei & Or, 2001).
In soil creep analyses by rheometry, the soil and its structure are possible to be changed in a certain constant stress states. The rheometer creep test on Mio-Pliocene clay performed by Kaczmarek (2016) showed that all the 3 creep stages were identified as in triaxial creep test. Soil strength during single stage rheometer creep process was reduced to 35% with respect to that under steady state stress; however, soil tended to be more resistant to shear stress in multi-stage creep, which might be resulting in shortening of the distance between clay particles and bond formation in soil structure. Similar as the direct shear creep test, one of the main disadvantages of rheometer technique is the lack of pore pressure control.
1.1.4 Field creep tests
In order to study the field characteristics of clay creep, a number of field measurements of time-displacement investigations have been made, for different structures and natural slopes. A classical one is the differential settlement of the Tower of Pisa in Italy, the tower settled about 1.5 meter and tilted to one side with an inclination of 5.5 degrees over 600 years and the settlement is still continued. The long-term settlement of buildings was also recorded by Feda (1992). He found that up to 60% of the total settlement were detected after construction, and the settlement was not
25
stabilized after 40 years of measurements. Thus, the forecasted settlement of structural building would be very inaccurate if the time-dependent compression of soil foundation was neglected.
Many experimental test embankments were constructed during the last century, among which the most famous are highway embankments at New Liskeard (Raymond, 1965), Sackville embankment in Canada with geo-reinforced (Rowe & Hinchberger, 1998), the Gloucester embankment in UK (Hinchberger & Rowe, 1998) and the Murro embankments in western Finland (Karstunen &Yin, 2010; Yin et al., 2010; 2011). The field test data show globally that: the long-term settlement of embankment is far greater than that just after construction; excess pore water pressure will exist in the embankment within quite a long time after the construction if the pore pressure is not allowed to dissipate quickly because of restricted drainage condition.
In addition, the long-term settlements of soil foundations of metro, especially soft and high compressibility soil foundations of tunnels, are also remarkable. Based on numerous investigation on the measured date of term settlement of tunnels, Shirlaw (1995) concluded that the long-term settlement took up to 30%-90% of the total settlement. Research of O’Reilly et al. (1991) confirmed this conclusion through a 11 years’ observation Grimsby tunnel in British. Apparent settlement of metro foundation in Shanghai was also found during 10 years of operating (Cui &Tan, 2014).
As illustrated by the above filed examples, the creep deformations of clays are generally in unneglectable magnitude and often continue for tens even hundreds of years. The extrapolation tests on experimental and structural interpretation of the time-dependent behavior of clay are still needed.
1.2 Shear dilatancy/contractancy related to creep
The experimental investigations on time-dependency behavior of clay aiming at mainly characterizing the stress-stain-time evolution, and then incorporating into constitutive model to fit and to predict its development. Shear dilatancy/contractancy (plastic flow or hardening plasticity) is an important characteristic and the basis for the constitutive model of soil. The relationship of shear dilatancy/contractancy for sands has been investigated by many researchers (Bishop & Henkel, 1957; Murayama et al, 1984; Mejia et al.,1988). However, few researches have been performed on clay, especially the time-dependency of shear dilatancy/contractancy.
26 mechanics under critical state, being
𝑑𝜀𝑣𝑃 𝑑𝜀𝑑𝑃=
9(𝑀−𝜂)
3𝑀−2𝑀𝜂+9 (1.7)
Where dP
v and dPd are the increment of plastic volumetric and deviatoric strain, respectively.
M and η are the slope of critical state line and stress ratio as in Cam Clay Model.
Roscoe et al. (1963) proposed a dilatancy equation based on dissipation of stress energy, i.e., the plastic incremental equals to the dissipation of friction energy, which consists with the plastic flow rule proposed by Schofield & Worth (1968), being
𝑑𝜀𝑣𝑃
𝑑𝜀𝑑𝑃= 𝑀 − 𝜂 (1.8)
Another widely used dilatancy equation was proposed by Roscoe & Burland (1968) in developing the Modified Cam Clay Model, being
𝑑𝜀𝑣𝑃 𝑑𝜀𝑑𝑃=
𝑀2−𝜂2
2𝜂 (1.9)
Wheeler et al. (2003) propose an dilatancy equation develop in anisotropic constitutive model, being
𝑑𝜀𝑣𝑃 𝑑𝜀𝑑𝑃=
𝑀2−𝜂2
2(𝜂−𝛼) (1.10)
Where α is a measure of the degree of plastic anisotropy of the soil, with α = 0 the soil behaviour is isotropic and Equation 1.10 corresponds to the Modified Cam Clay yield curve in Equation 1.9.
1.2.2 Evolution shear dilatancy/contractancy during creep
The experiments show that the nature of creep strains is similar to that of plastic strains. They may be predicted from the framework provided by the hardening plasticity theory (Lade & Liu, 1998).
As discussed in Section 1.1.2.2, deviatoric creep is often accompanied by volumetric creep, the rate of volumetric to deviatoric during creep thus follows a plastic dilatancy rule as well.
27
Walker (1969c) investigated the time-dependent interaction of these two coponents in multi-stage drained triaxial creep tests on normally consolidated kaolinite. Followed by an instantaneously increase of deviatoric stress, an immediate increase was detected for d
accompanied by a constant v (section AB in Figure 1.16a). Afterwards, under the constant
deviatoric stress, the primary compression (controlled by the dissipation of pore pressures) and then the secondary compression (creep) were observed, shown by section BD and DE in Figure 1.16a, separately.
The linear relation tendency of dv/dd implied that the dilatancy rule was time-independent,
which was similar to the dilatancy rule described in Section 1.2.1. Moreover, the strain increment ratio decreased with increasing stress ratio as shown in Figure 1.16b. A linear relationship of between v and d was proposed by Sekiguchi (1973) through drained incremental creep tests on
normally consolidated Fujinomori clay
𝑑𝜀𝑣
𝑑𝜀𝑑 = 1.21 − 0.77𝜂 (1.11)
The linear relation of dv/dd during creep was confirmed by Tian et al. (1994) through drained
creep tests on marine sediments at lower stress level, while piecewise linear relation was detected at higher stress level emphasizing a significant magnitude of microstructural adjustments.
(a) (b)
Figure 1.16 Dilatancy relationship obtained from drained creep test on kaolinite: (a) evolution of volumetric strain and deviatoric strain with time; (b) effect of stress ratio on strain
increment ratio (Walker, 1969c)
Wang &Yin (2015) performed undrained triaxial creep tests on K0-consolidated and
28 & Muir Wood, 1999).
Yin et al. (2013) reproduced the results of drained triaxial creep tests on normally consolidated Hong Kong marine sediments performed by Zhu (2007) and pointed out that dilatancy rule was not always time-independent. It can be seen in Figure 1.17 that the values of strain increment ratio
dv/dd decrease with increasing of stress ratio, which consists with the tendency described in
Equation 1.7-1.10. Nevertheless, the values of dv/dd are constant in creep condition based on
these equations, which conflicts with the fluctuating curves. The time-dependent curves in Figure 1.17 confirms that the anisotropy may be induced along the evolution of plastic strain (Yin & Chang, 2009; Yin et al., 2013). Further theoretical analysis and experimental verifications are still needed to accurately summarize its evolution.
(a) (b)
Figure 1.17 Evolution of plastic strain increment ratio with time during drained creep under different stress conditions: (a) η=0.68; (b) η=0.91 (Yin et al.2013)
1.3 Micro approach to creep of clay
Microstructural investigations are increasingly used for a better understanding of the macroscopic behavior and physical properties of clay. The microstructure of clays has been studied
29
by many researchers (Diamond, 1971; Moon, 1972; Collins & McGown, 1974; Sergeyev et al., 1980; Griffiths & Joshi, 1990; Hattab et al., 2010). These studies involve the determination of the properties of clays at microscopic level and analyzing in the arrangement and distribution of particles, particle aggregates and pores, as well as their contact and connectivity under different stress conditions. Microscopic research in the time-dependency of clay is supplemental important to understand the creep mechanism that hides behind the macro stress-stain-time behaviors.
1.3.1 Structural mineralogy of clays
Mineralogy is the primary factor that controls the size, shape, and properties of soil particles. A priori knowledge to the minerals in soil may provide a direct insight into its behavior. It is already known that clayey soil consists of mixed groups of minerals, primarily hydrous aluminum silicates, whose sizes are usually less than 2μm (Lambe & Whitman, 1969; Velde, 1995; Mitchell, 2003; Sparks, 2003). Introductions thus starts progressively from the atomic structure to crystal then to particle and its aggregations of typical clay minerals in the following.
1.3.1.1 Atomic structure and bonds
An atom may be simplified represented by a small nucleus surrounded by diffuse concentric of electrons clouds. Based on the localization of bonding electrons in space, the inter-atomic bonding can be divided into 3 categories: covalent, ionic, and metallic (Mitchell, 2003; Pacios, 1991; Gould et al., 2008).
The combination of ionic and covalent bonding is typical in most non-metallic solids. For instance, the inter-atomic bond in silica (SiO2) is about half covalent and half ionic, and silicate
minerals are the most abundant constituents of most soils (Schulten & Schnitzer, 1997).
Besides the strong ionic and covalent bonding, a weaker secondary bonds are usually formed, which probably are sources of attraction between very small particles as well as between liquids and solid particles (Horowitz &Trievel, 2012). Two typical secondary bonds are the hydrogen bond and Van der Waals bonds (Mitchell, 2003):
Hydrogen bond: if the hydrogen ions form the positive side of the dipole, then its attraction to the negative end of the adjacent molecule is called the hydrogen bond. Hydrogen bonds are important in determining the interaction between soil particle surfaces and water.
30
1.3.1.2 Crystal structures and bonds
A crystal is a homogeneous body bounded by smooth surfaces, which are the external expression of the internal atomic arrangement. The soil particles, which are the maximum proportion of soil solids, are composed of mineral crystals. Structure characteristics of crystal are used to distinguish different groups of minerals. The crystal structures do not organized by chance but in a way with stable arrangement of atoms in a crystal which minimizes the energy. Figure 1.18 gives some possible arrangements of silica tetrahedral in silicate mineral structures (Gillott, 1968). Many of the clay minerals contain silica in a sheet structure, and framework silicates are most common in quartz.
single double rings chains bands sheets frameworks
Figure 1.18 Silica tetrahedral arrangements in different silicate mineral structures (Gillott, 1968)
The sheets structure, consists of tetrahedral and octahedral units of oxygens and silicons, oxygens and aluminum etc., respectively (Grim, 1962), stack to form layers that combine to produce the different clay mineral groups (Figure 1.19).