HAL Id: tel-03203764
https://tel.archives-ouvertes.fr/tel-03203764
Submitted on 21 Apr 2021
HAL is a multi-disciplinary open access archive for the deposit and dissemination of sci-entific research documents, whether they are pub-lished or not. The documents may come from teaching and research institutions in France or abroad, or from public or private research centers.
L’archive ouverte pluridisciplinaire HAL, est destinée au dépôt et à la diffusion de documents scientifiques de niveau recherche, publiés ou non, émanant des établissements d’enseignement et de recherche français ou étrangers, des laboratoires publics ou privés.
Developing video monitoring technique in riverine
environment : automatic and continues detection
Zhi Zhang
To cite this version:
Zhi Zhang. Developing video monitoring technique in riverine environment : automatic and continues detection. Geography. Université de Lyon, 2020. English. �NNT : 2020LYSEN087�. �tel-03203764�
Numéro National de Thèse :2020LYSEN087
THESE de DOCTORAT DE L’UNIVERSITE DE LYON
opérée par
l’Ecole Normale Supérieure de Lyon
Ecole Doctorale
N° 483
Sciences sociales (Histoire, Géographie, Aménagement, Urbanisme, Architecture, Archéologie, Science Politique, Sociologie, Anthropologie)
Spécialité de doctorat : Géomorphologie fluviale
Discipline
:
Géographie
Soutenue publiquement le 11/12/2020, par :
ZHI ZHANG
Developing video monitoring technique
in riverine environment: Automatic and
continues detection
Détection par vidéo du flux de bois flotté en rivières
Devant le jury composé de :
BUFFIN-BELANGER, Thomas Professeur Univ. de Québec - Rimouski Rapporteur
GAUTIER, Emmanuèle Professeure Univ. Paris I Rapporteure
RUIZ-VILLANUEVA, Virginia Associate Prof. Univ. Lausanne Examinatrice
PIEGAY, Hervé Directeur de Recherche CNRS Directeur de thèse
Abstract
Drift wood plays a significant role both on the ecology and morphology of a river. Therefore, quantifying the amount of wood in rivers is an important issue. During recent years, streamside video monitoring has been introduced as a feasible technique to evaluate the amount of wood in riverine environment. Beside many advances, there are still many questions needed to be address concerning this technique. Therefore, in this study, I focused on three major objectives. Firstly, I studied the relation between wood flux and flow discharge in order to create a model for predicting wood flux on invisible period of camera sight. Wood in-stream can show some different characteristics in some critical events, such as in two multi-peak floods, wood flux on the first peak of discharge is more than second one, and in a flood after a stronger windy day, wood flux can be activated by water elevation arise. In addition, the second major objective was implementation and validation the application of an automatic detection software. After training the software, it is used to extract wood flux automatically by its own surveillance. The third major objective was evaluating human-based uncertainties in video monitoring due to two limitations, first time limitation which results in sampling the videos and second limitation in visibility of the operator which results in bias between different operators. I expect the results of this thesis develop the application of streamside video monitoring technique for practical concerns.
Keywords: Fluvial dynamics; Wood in river; Streamside video monitoring; Automatic detection; Uncertainty; Video sampling; Operator Bias
Résumé
Le bois flotté joue un rôle important à la fois sur l'écologie et la morphologie d'une rivière. Par conséquent, la quantification de la quantité de bois dans les rivières est une question importante. Ces dernières années, la surveillance vidéo en bord de rivière a été introduite comme une technique pour évaluer la quantité de bois en milieu fluvial. Outre de nombreuses avancées, il reste encore de nombreuses questions à résoudre concernant cette technique. Par conséquent, dans cette étude, nous nous sommes concentrés sur trois objectifs majeurs. Dans un premier temps, nous avons étudié la relation entre flux de bois et débit d'écoulement afin de créer un modèle de prévision du flux de bois sur une période durant laquelle la caméra ne peut enregistrer le flux vidéo. Le bois dans les cours d'eau peut présenter des caractéristiques différentes lors de certains événements critiques, comme par exemple, lors de deux crues à plusieurs pics, le flux de bois sur le premier pic de débit est supérieur au second, et en cas d'inondation après une journée venteuse plus forte, le flux de bois peut être activé par l'élévation de l'eau. En outre, le deuxième objectif majeur était la mise en œuvre et la validation de l'application d’un
logiciel de détection automatique. Après avoir entrainé l’algorithme de détection, il est utilisé pour extraire automatiquement les flux de bois de manière continue. Le troisième objectif majeur était d'évaluer les incertitudes d'origine humaine dans la surveillance vidéo en raison de deux principaux facteurs. La détection manuelle est extrêmement fastidieuse et longue et nécessite ainsi d’envisager une stratégie
d'échantillonnage des vidéos. Le second problème nécessitant une évaluation de l’incertitude est lié à la capacité souvent variable de l'opérateur à détecter les
flottants, qui se traduit par un biais de mesure entre les différents opérateurs. Nous espérons que les résultats de cette thèse permettront de diffuser l’usage de la technique de surveillance vidéo fluviale à des fins pratiques.
IV
bord de rivière ; Détection automatique ; Incertitude ; Échantillonnage vidéo ; Biais de l'opérateur
Acknowledgement
First of all, I would like to express my sincere gratitude to my supervisor, Professor Hervé Piégay. Thank you very much for your patiently guidance and firm support. I thank you particularly for this opportunity given to me to work for Ph.D. in our laboratory. I am really interesting and exiting about this research project. Thanks to you, like a torch, to guide me and take me into the scientific temple. These six years of study in France change my life. With your encouragement, I muster up the courage to enhance communication with everyone in our lab; with your meticulous help and concern, I can adapt to the life in Lyon rapidly and Dr Hossein Ghaffarian Roohparvar can give me a lot of help about my thesis; and with kindness and rigorous suggestions, I can improve my scientific ability step by step and I was able to learn a lot of things. Thousands thanks to him to guide me how to deal with the data and accomplish camera calibration by MATLAB, how to write an article clean, and how to express my study idea by a presentation. These skills and capability can play an important role for my research career.
I also would like to thank my responsibility teacher in China, Professor Dong Zhibao. Thanks to you to imply me as a candidate for applying funding of CSC. And thanks to Professor François Métivier, because of your invitation, I have had a chance to meet my supervisor, Professor Hervé Piégay in LanZhou, China.
I appreciated that Bruce MacVicar gives me thousands helps and suggestions about my project and supply the previous monitoring data on Ain River. Thanks to him for his very interesting idea about wood pulse. Thanks very much for checking my English express in order to make my idea clean.
I also would like to thank Pierre Lemaire for teaching me how to operate the wood flux monitoring application, and how to code all the function of this algorithm. Thousands thanks to Kristell Michel and Hervé Parmentier for kindness help. I appreciated that they gave me so many helps while I need any device, they made me
VI
working and studying fluently. I also appreciated that Lise Vaudor for teaching me how to model wood flux by Random Forest on P-program platform, and Aurelie Antonio for providing and keeping all the monitoring data to me.
I would like to thank Professor Emmanuèle Gautier, Professor Thomas Buffin-Bélanger and Professor Virginia Ruiz-Villanueva for agreeing to participate in my thesis jury, in particular the two reviewers for the time spent evaluating this manuscript.
Thanks to Benacchio Veronique, Silvia Flaminio, Emeline Comby and Ahlueng Sebastien I have had the opportunity to work in a very warm environment while I arrived at Lyon on 2014. I also would like to thank Bianca Räpple for her join Dandan and me as a squad of working at night and weekends.
I would like to thank Mathieu Cassel for his kindness help, and I felt so luck that I had an opportunity to go field with him. It was a very impressive experience and I learned so many things that I never read them on the books and articles. Thousands thanks to Baptiste Marteau for your kindness and professional suggestions about my dissertation presentation. Thanks to Ludovic Bultingaire, Frank and Cristina for the help on field work.
I would like to thank China Scholarship Council (CSC) and ShaanXi Normal University for providing the funding for my Ph.D. project during these years. I also would like to thank the Laboratory of LIA SALADYN, let me join their project as a Ph.D. candidate in ENS de Lyon, to enhance the communication between France and China.
At last, I want to thank to my family and friends. Thousands thanks to my father and mother. Thanks thousands for your love, firm support and trust me, which encourage me to accomplish and pursue my dream and my favor career. Love you three thousands! I also would like to thank my wife, Cui Dandan, thanks to you for your firm support, thanks to you that give me a very warmly and peacefully home.
Love you three thousands! I am very appreciated that my dear friends, He Qiwei and Zhao Mengzhong, who help me to check the language gramme of my thesis. I also appreciated that my dear friends Pan Cong, Zhang Lin, Huang Yuanfan, Lu Rui, Song Xue and Wang Congyang for your help and company in ENS.
Contents
Abstract ... I
Résumé ... III
Acknowledgement ... V
List of Figures ... XV
List of Tables ... XXI
CHAPTER I. Introduction ... 1
1.1 Résumé du chapitre I : Introduction ... 1
1.2 Context ... 1
1.3 Large wood in river channel ... 2
1.3.1 Importance of large wood in river ... 2
1.3.2 Problems associated with large wood in river... 4
1.4 Definitions ... 6
1.5 Quantifying in-channel wood fluxes ... 7
1.5.1 Use of imagery and video to quantifying wood flux ... 8
1.5.2 Detecting wood flux from a stream-side video camera. ... 10
1.5.3 Challenges in video-monitoring of wood discharge ... 12
1.6 Objectives ... 13
CHAPTER II. Video monitoring of in-channel wood fluxes: critical events, flux prediction, and sampling window ... 15
X
2.2 Abstract ... 16
2.3 Introduction ... 17
2.4 Study site ... 20
2.5 Material and Methods ... 22
2.5.1 Stream-side video camera ... 22
2.5.2 Monitored events ... 23
2.5.3 Monitoring process ... 24
2.5.4 Observer bias ... 25
2.5.5 Modeling wood flux ... 26
2.5.6 From wood flux to wood discharge ... 27
2.5.7 Sampling strategy ... 28
2.6 Results ... 30
2.6.1 Estimate of wood fluxes during critical events ... 30
2.6.2 Predicting wood fluxes during night time ... 32
2.6.3 Validation optimal wood flux estimate from sampling ... 36
2.7 Discussions and conclusions ... 38
2.7.1 The link between flow pattern and the wood fluxes ... 38
2.7.2 Continues modeling of wood fluxes ... 40
2.7.3 Selecting an optimized framerate ... 41
2.7.4 Wood pulses ... 43
video monitoring: a new software tool and validation. ... 45
3.1 Résumé ... 45
3.2 Abstract ... 46
3.3 Introduction ... 47
3.4 Methodological procedure for automatic detection of wood ... 52
3.4.1 Wood probability masks ... 53
3.4.2 Wood object identification and characterization ... 55
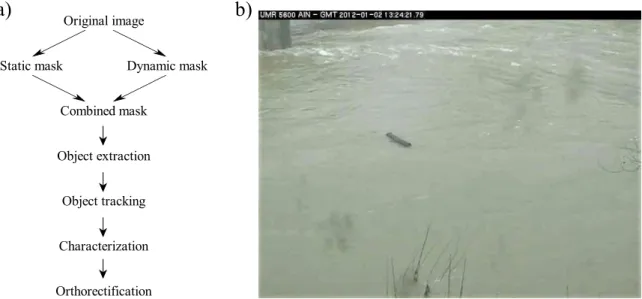
3.4.3 Image rectification ... 57 3.5 User interface ... 59 3.5.1 Detection ... 60 3.5.2 Annotation ... 61 3.5.3 Learning ... 63 3.5.4 Performance ... 64 3.6 Performance assessment ... 65
3.6.1 Material and methods ... 65
3.6.2 Detection performance ... 71
3.6.3 Post-processing ... 76
3.7 Conclusion ... 82
CHAPTER IV. Operator based uncertainties in streamwise video monitoring technique 85 4.1 Résumé ... 85
XII
4.3 Introduction ... 86
4.4 Study site ... 89
4.5 Materials and methods ... 91
4.5.1 Stream-side video camera ... 91
4.5.2 Studied events ... 92
4.5.3 Piece number and volume ... 93
4.5.4 Sampling time window (𝑻𝑾) ... 94
4.6 Results ... 96
4.6.1 Uncertainty on piece number and volume ... 96
4.6.2 Sampling time window (TW) ... 98
4.7 Discussion ... 101
4.7.1 Bias of operator ... 101
4.7.2 Sampling videos ... 102
4.8 Conclusions ... 103
CHAPTER V. Summary and outlook ... 105
5.1 Summary ... 105
5.1.1 Characteristic of wood flux in critical flood events ... 105
5.1.2 Implementation and validation of wood automatic detection software ... 106
5.1.3 Evaluate observer-based and sampling uncertainties in video monitoring ... 107
5.2 Outlooks ... 107
5.2.2 Present wood study in China ... 108
5.2.3 Applying different steps of video monitoring technique together to calculate wood budgeting... 109
5.2.4 Finding the source of wood pieces by analyzing wood pulses. ... 109
List of Figures
Figure I-1: Wood accumulations on the river channel, a) in Everett, USA, wood jam at the bridge on the Snohomish River (2019); b) In Soquel, USA, after January 1982 storm, logjam obstructed the bridge (Lassettre et al., 2012). ... 5 Figure I-2: Illustration of variables used in wood budgeting analysis (Martin and
Benda, 2001) ... 7 Figure I-3: Wood detection procedure showing: a) definition of a region of interest
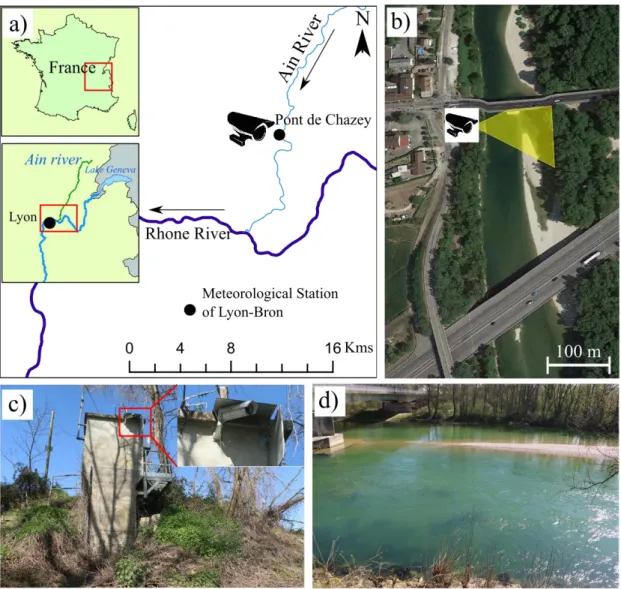
(ROI) based on a visual detection of wood including measurement of data and time from time stamp, b) precise location of end and side points to define the piece length, diameter, and first position, c) definition of second position after advancing a number of frames to allow calculation of velocity and angular velocity (MacVicar and Piégay, 2012). ... 11 Figure II-1. Study site at Pont de Chazey: a) Location of the Ain River course in
France and location of the gauging and meteorological stations, b) camera position and its view angle in yellow, c) overview of the gauging station with the camera installation point, d) view of the River channel from the camera . 22 Figure II-2. Monitored events a) the daily mean discharge series monitored by
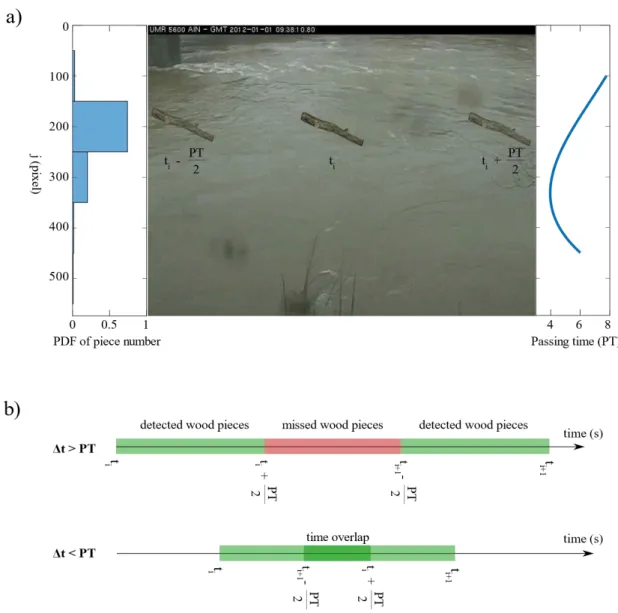
MacVicar & Piégay (2012) (red lines) and monitored in this work (blue lines) on the discharge series from 2007 to 2014. b) The daily mean wind velocity series from 1977 to 2013. ... 24 Figure II-3. Wood discharge as a function of wood flux ... 27 Figure II-4. a) wood flux position on video frame b) link between video time laps
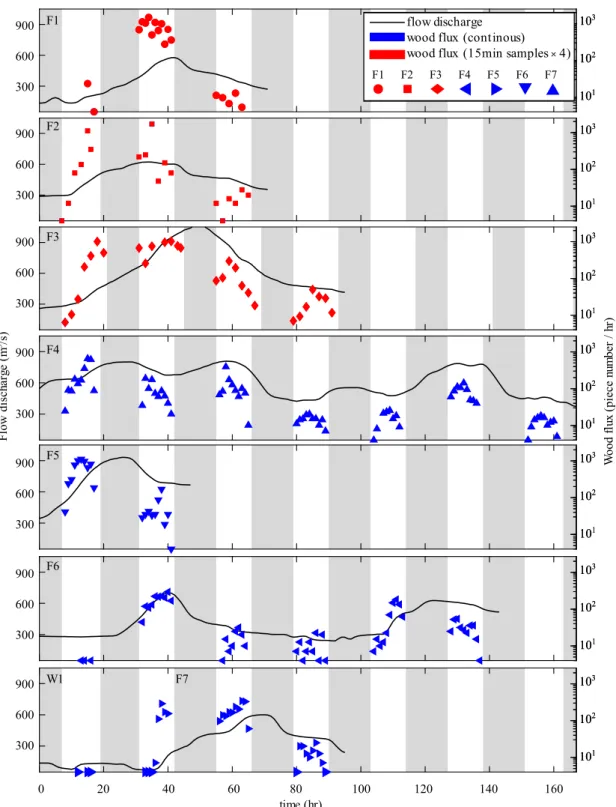
∆𝐭 and the passing time 𝑷𝑻 ... 29 Figure II-5. Comparison between wood flux based on sampling (red) and continuous
(blue) monitoring and flood hydrograph (black line). The gray boxes show the night time when video monitoring was impossible. Different symbol shapes show different events. ... 31
XVI
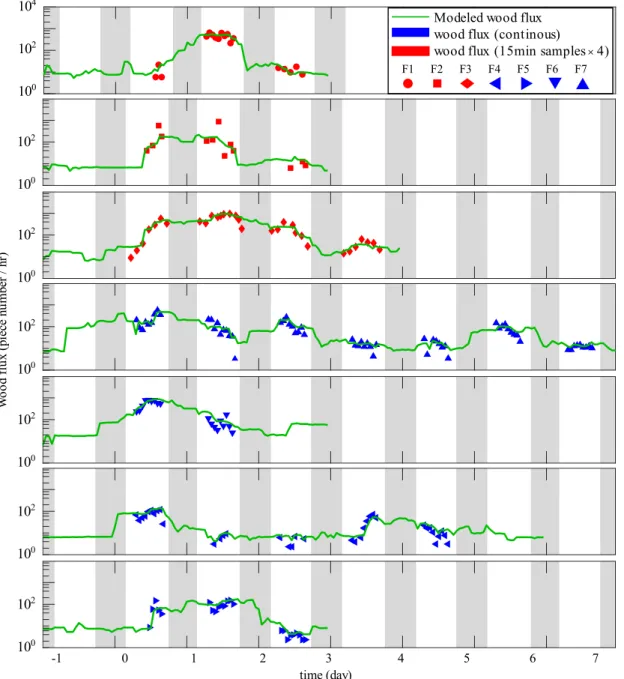
Figure II-6 Predicted value of wood flux (in red) as a function of a) flow discharge 𝑸 (m3/s), b) discharge gradient 𝐝𝑸𝒅𝒕 (m3/s/1hr) and c) the time elapsed since the last time that 𝑸 was higher or equal to 𝑸(𝒕), 𝑻𝑸 (days). Dashed lines indicate the 90% and 10% quantiles of the data. ... 33 Figure II-7. Wood fluxes based on continuous (blue) and sampled (red) videos and
modeled wood fluxes (green line) using RF model as a function of time. ... 34 Figure II-8. Comparison between observed and modeled piece number: filled and
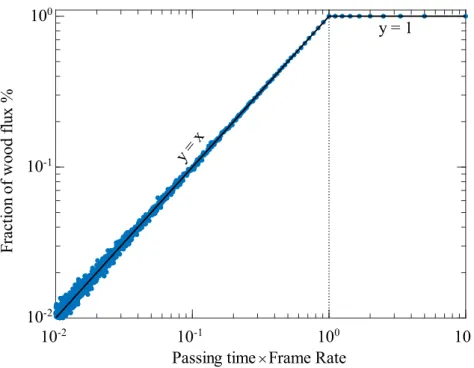
empty scatters show data on the rising and falling limbs of the hydrograph, respectively. Data are compared with a 1:1 line. There are 3 points for F4 and 2 points for F6 due to multiple pick floods. ... 35 Figure II-9. Effect of framerate and passing time on the fraction of detected wood
pieces. ... 36 Figure II-10. a) Wood fluxes as observed in 1-minute intervals. Beside short
fluctuations of wood flux, pulses of wood can be defined qualitatively as the delivery of large amount of wood in a short period of time. The gray boxes show the night time when video monitoring was impossible. b) Effect of the temporal resolution on detecting short time events (a wood pulse). ... 37 Figure II-11. Fraction of detected woods based on passing time in different rivers. . 41 Figure III-1 a) Flowchart of the detection software and b) an example of frame on
which these different flowchart steps are applied. ... 53 Figure III-2 Static probability mask, a) Gaussian distribution of light intensity range for
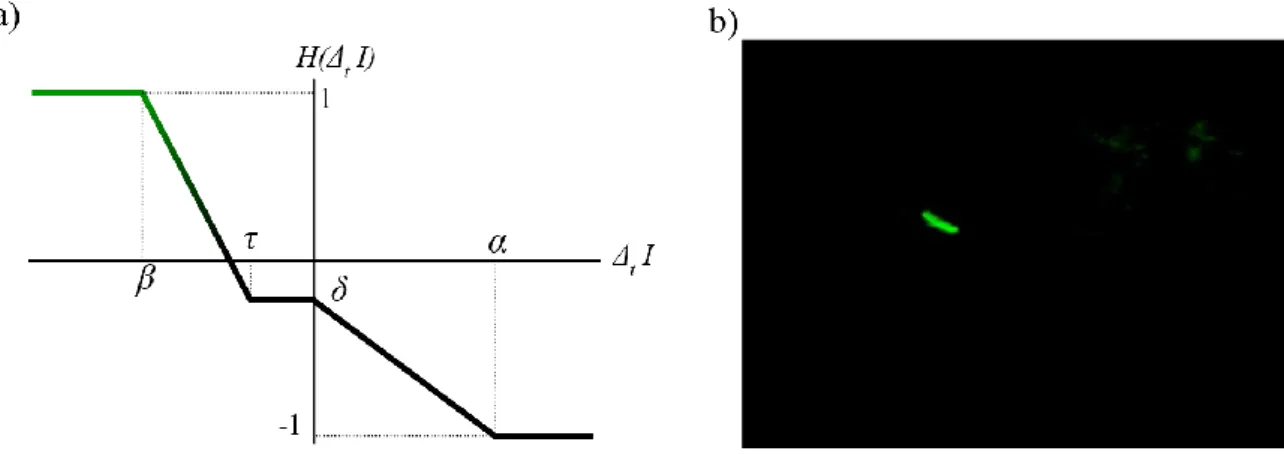
a piece of wood, b) employment of probability mask on the sample frame. ... 54 Figure III-3 Dynamic probability mask, a) updating function 𝑯∆𝒕, 𝑰 adapted from Ali et
al. (2011) and b) employment of probability mask on the sample frame. ... 55 Figure III-4 a) Object extraction by (i) combining static and dynamic masks and (ii)
applying a threshold to retain only high-probability pixels. b) Object tracking as a filter to deal with partly immersed objects and to distinguish between moving objects from static waves. ... 57
Figure III-5 Image rectification, process. 3D view of non-colinear GCPs in metric coordinates (a), their corresponding localization within the image (b), and the relative 2D metric coordinates for a given water level (c). (b,c) A practical example of the transformation of the coordinates is presented. The different solid lines represent the successive detection in a set of consecutive frames. ... 59 Figure III-6 User interface of the detection software. ... 60 Figure III-7 User interface of the detection module of automatic detection software. 61 Figure III-8 User interface of the annotation module of automatic detection software. ... 63 Figure III-9 Study site at Pont de Chazey: a) Location of the Ain River catchment in
France and location of the gauging and meteorological stations, b) camera position and its view angle in yellow, c) overview of the gauging station with the camera installation point ... 66 Figure III-10 Rectifying transformation matrix at low flow level with camera at (0,0,0). ... 67 Figure III-11 Daily mean discharge series for monitoring period from 1st to 7th
January and in 15th December. ... 67 Figure III-12 Different light conditions during (a) morning, (b) noon and (c) late
afternoon, results in different frame roughness’s and different detection
performances. ... 69 Figure III-13 Wood position can highly affect the quality of detection. Pieces that are
passing in front of the camera are detected much better than the pieces far from the camera. ... 71 Figure III-14 Correction matrices: a, b, c) light and dark roughness’s, d, e, f) flow
discharges during the daytime, g, h, i) detection position and j, k, l) wood lengths as a function of the distance from the camera. The first column shows number of pieces as 𝑻𝑷 + 𝑭𝑵 (all annotated pieces), 𝑻𝑷 (correct detections)
XVIII
and 𝑭𝑷 (wrong detections). Second and third columns show Precision and Recall rates of the software respectively. ... 74 Figure III-15 Effect of using different combinations of 𝑷𝑹 matrices on precision
improvement compared with 1:1 line(no improvement), 10% and 20% improvement lines. ... 79 Figure III-16 a) Steps to post-process software automatic detections: (i) raw
detections ( 𝑻𝑷 + 𝑭𝑷 red line), (ii) Only true positives using the 𝑷𝑹 improvement process (𝑻𝑷 blue dashed line), and (iii) modeling false negatives (blue line). Operatorannotation (green line is used as a benchmark). b) The correlation coefficient between operator annotation and modeled 𝑻𝑷 to find an optimum threshold length for 𝑹𝑹 improvement. ... 80 Figure III-17 Comparison of the total volume of wood between operator annotation as
the benchmark and raw data (red scatters) and post-processed data (blue scatters), compared with a 1:1 line. ... 82 Figure IV-1. Study site at Pont de Chazey: a) Location of the Ain River course in
France and location of the gauging station, b) camera position and its view angle in yellow, ... 90 Figure IV-2. Study site at Châtel-de-Neuvre a) Location of the Allier River course in
France, b) camera position and its view angle in yellow. ... 91 Figure IV-3. Comparison of the wood length distribution on two sites. ... 94 Figure IV-4. Schematic view of the sampling time window (𝑻𝑾) ... 95 Figure IV-5. Comparision of the results of different operators for a) cumulative
distribution function of wood length and b) probability distribution function of transversal position of wood pieces on the Ain River, compared with the validated data (dashed line) from MacVicar & Piégay, (2012), Ghaffarian et al. (2020a). ... 96 Figure IV-6. Classification of results based on piece length; a) the difference between
number (𝝈𝒊/𝝈𝒊), b) probability distribution function of piece number and c) volume. ... 97 Figure IV-7. Effect of applying a truncation length (𝑳𝒕𝒓) on piece number and volume:
a) truncated piece number (𝑵𝒕𝒓) normalized by total piece number (𝑵𝒕), and b) truncated piece volume (𝑽𝒕𝒓) normalized by total piece volume (𝑽𝒕). Solid and dashed lines represent mean and standard deviation for the results of different operators. ... 98 Figure IV-8. Link between time window 𝝉 and the fraction of detected wood pieces. 99 Figure IV-9. Error due to time excluded from sampling as a function of time
window 𝑻𝑾. Solid and dashed lines represent the mean and maximum errors for different monitored floods respectively. ... 99 Figure IV-10. Relative error due to the sampling with 𝝉 = 𝟓𝟎% for different discharges
as a function of flow discharge. Solid line shows the linear interpolation and dashed lines show the 95% confidence boundes on the Ain (red) and Allier (blue) Rivers. ... 100 Figure IV-11. Relative error due to the sampling as a function of flow discharge. a, b)
The errors on pieces number ;c, d) the errors on wood volume on two rivers. ... 101 Figure IV-12. An optimum timeline for sampling based on different accuracies (from
0.5 to 2%) both for a) piece number and b) piece volume on the Ain (solid line) and Allier (dashed line) Rivers. ... 103 Figure V-1 The wood hazard with flood in China: a)&b) The flood and wood crush
the building of village and wood push down a car into pool during flood, Sichuan, China (2012) (The news is reported by following link: http://news.cnr.cn/tttp/201008/t20100817_506906910_3.shtml); c)&d) flood broke the bridge and destroyed the road with wood and sediment, Shandong, China (2018) (The home-photo is caught by following link: https://dy.163.com/article/DPONQIDO0537094R.html?referFrom=) ... 108
List of Tables
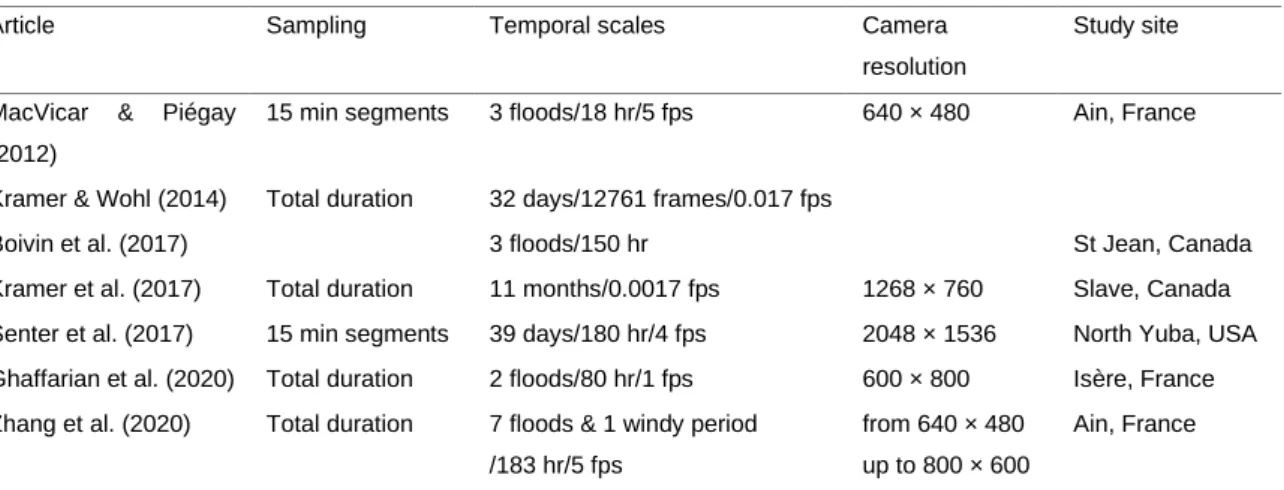
Table II-1 Wood sampling statistics at the Pont de Chazey for different events. ... 24 Table II-2 Wood flux in multi peak floods F4 and F6 ... 32 Table II-3 Wood volume and threshold of wood motion, modeled (M) or observed (O). ... 36 Table III-1 Characteristics of streamside video monitoring techniques in different studies. ... 50 Table III-2 Summary of automated and manual detections ... 72 Table III-3Correlation between each pair of parameters ... 72 Table III-4 Precision rate (PR) before and after post-processing ... 78 Table IV-1. Sampled videos statistics ... 93 Table IV-2. Continuous monitoring statistics ... 93
CHAPTER I. Introduction
1.1 Résumé du chapitre I : Introduction
Dans ce chapitre, nous définirons d'abord le bois des rivières comme un élément important pour la nature et les êtres humains. Nous introduire du bois dans les rivières est également une composante essentielle des systèmes fluviaux qui peut influencer l'écologie des rivières et la géomorphologie des chenaux. Sur cette base, nous savons que le bois dans les rivières peut également intensifier les risques lors du transport de bois de gros diamètres en cas de crue énorme. Par conséquent, nous étudions plusieurs approches pour quantifier le transport du bois dans les cours d'eau. Dans la dernière section de ce chapitre, nous présentons les objectifs de ce travail d'étude et nous guidons à travers la structure du manuscrit.
In this chapter, we shall first define wood in rivers as a significant element to nature and human beings. Introducing some wood in rivers is also an essential component of river systems that can influence river ecology and the channel geomorphology. Based on this, we know that wood in rivers can also intensify hazard during the transport of large wood in huge flood. Therefore, we investigate several approaches to quantify transport of wood in streams. In the final section of this chapter, we will introduce the objectives of this study work, which will guide us through the structure of the manuscript.
1.2 Context
Rivers are the natural flowing watercourse on the earth which play a significant role on the hydrological cycle. Along the river’s erosion and sedimentation process transport and deposit sediments (rocks and sands) as well as the pieces of wood which are provided by shrub and tree growing on vegetated bars, fluvial islands and
Introduction 2
floodplains. These in-stream wood pieces can significantly influence over river morphology, sediment dynamics and fluvial ecosystems, which is a beneficial factor in context of natural cycle.
Wood in rivers can also be a crucial element to human. Many civilizations have been built around the rivers. However, during recent decades, these rivers are stressed by human activities such as the control of the river banks, the construction of bridges, dams and other hydraulic structures along the rivers. Moreover, during the last few decades, forest cover has generally increased in many European regions due to the widespread abandonment of agricultural surfaces and changes in framing practices. This phenomenon within global climate change enhances wood supply and entrainment to the rivers. Therefore, over the last 40 years, as the role of wood in river ecosystems has become an increasingly important focus for research, the video monitoring of the rivers has been known as a feasible method to quantify the amount of wood in rivers. Though, video monitoring, by itself is an inexpensive and practical technique in riverine environment, however, annotating wood piece is still a time-consuming process. Therefore, the aim of this thesis is to introduce some protocols and techniques to quantify the amount of wood in rivers by using the video monitoring technique which enables us to be able to monitor wood pieces in rivers automatically and all along the day time.
1.3 Large wood in river channel
1.3.1 Importance of large wood in river
In-stream wood can be as important as sediment for channel change (e.g., Massong and Montgomery, 2000; Brooks and Brierley, 2002; Abbe and Montgomery, 2003; Le Lay et al., 2013). In-stream wood is also a significant and essential component of river systems that has a strong influence on stream and aquatic ecology, sediment transport, and the channel geomorphology along all along the river continuum (Montgomery et al., 1996).
The interactions between large wood and fluvial processes have significant implications for the ecology of river systems. Wood influences the functioning of aquatic and riverine ecosystems, enhances the biogeochemical cycling of carbon in ecosystems (Battin et al., 2008; Skalak and Pizzuto, 2010; Wohl et al., 2012), and provides food for invertebrate, fish communities and habitats during different stages of their life cycles (Sedell et al., 1984; Inoue and Nakano, 1998; Piégay et al., 2005). There are complex feedbacks between green wood, living trees and other riparian and aquatic plants. Living wood pieces transported by flowing water are deposited in and around wood logjam, which would create local regeneration niches for riparian vegetation (Steiger et al., 2001; Pettit and Naiman, 2006; Osei et al., 2015) and biogeochemical hotspots for microbial activity (Krause et al., 2014; Grabowski et al., 2019). Furthermore, wood accumulated in-stream may play an important role in regulating water quality and in sustaining refuge habitats to protect biota during pollution episodes and floods (Gurnell et al., 2002).
Large wood (LW) in rivers also facilitates diversification of river morphology and sediment dynamics (Montgomery et al., 2003; Wohl et al., 2012; Wohl and Scott, 2017). The stable accumulation of wood has a direct influence over channel anabranching, platform geometry and floodplain topography. Some types of wood accumulation can also form stable in-stream which affects alluvial morphology (Abbe and Montgomery, 2003). Wood accumulation or large wood pieces in streams can bring more stabilization or mobilization to the river bed, bank or floodplain, it can also induce deposit of sediment and organic matter (Grabowski et al., 2019). Wood along the river corridors creates hydraulic resistance that can decrease flow velocity and transport capacity in the vicinity of the wood (Shields and Smith, 1992; Davidson and Eaton, 2013; Wohl et al., 2016). It can also provide surface roughness which declines floodplain surface flows, retains floating wood and deposits fine sediment (Dosskey et al., 2010).
Introduction 4
of the rivers, invites us to consider it as a key component in river restoration and the production of a variety of physical habitats (Gurnell, 2012, 2013). River restoration and management aim to improve physical natural form and processes of a river. The techniques to monitor and to manage large wood can reshape the natural habitat, control the riverbed, stabilize channel alignment and protect stream banks, these features are the important part of river restoration method (Pagliara and Kurdistani, 2017; Cashman et al., 2019; Grabowski et al., 2019). For instance, Wohl and Scott (2017) indicated that more abundant in-stream wood and beaver populations can be used to restore rivers ecologically, due to the fact that they could accumulate more sediment within river corridors and maintain more residual pool volume.
1.3.2 Problems associated with large wood in river
Although wood in stream has an undeniable positive effect on river morphology and restoration, improving ecosystems, , it can also be an exacerbating hazard factor during the transport of large wood material in huge flood (Diehl, 1997; Comiti et al., 2006; Lassettre and Kondolf, 2012; Ruiz-Villanueva et al., 2014a). The presence of wood in a river can increase flow stage, alter movement of sediment and patterns of erosion and deposition. Its transportation during the flood events, threatens not only human activities on rivers but also the populations and infrastructures (Lyn et al., 2003; Piégay, 2003; Comiti et al., 2006; Wohl et al., 2016; De Cicco et al., 2018), especially in or near urban settings (Mazzorana et al., 2011; Ruiz-Villanueva et al., 2014a; Wohl et al., 2016). Moreover, in the past few decades, the development of the urbanization has occupied massive infrastructures in endangered zones of mountain areas, such as the recreation areas, ski resorts, hiking paths, as well as buildings, roads and bridges. These infrastructures are totally exposed to the impact of flood event (Comiti et al., 2006; Versini et al., 2010; Mazzorana et al., 2011; Tacnet et al., 2012; Mazzorana et al., 2018).
Dead and living wood incorporated into the floodplain (e.g. Arseneault et al., 2007) can form ‘hard points’ that are resistant to erosion, supports the
longer-term development of riparian vegetation, especially those large trees that provide a future wood supply to the river system (Collins et al., 2012). Finally, sustained floodplain inundation induced by large wood accumulations can lead to tree mortality and subsequent enhanced wood delivery to the river (Brummer et al., 2006). It could increase the potential hazard for downstream bridge, river channel and infrastructures along the river.
As mentioned above, wood transported in the river channel is a threatening process due to its progressive increase of flood hazard. Log jams are often a major element of stream morphology, and floating logs may generate a natural hazard (Manga and Kirchner, 2000; Kraft and Warren, 2003; Comiti et al., 2006; Mao et al., 2008; Curran, 2010; Mazzorana et al., 2011; Turowski et al., 2013a). As shown on Figure I-1, the main potential hazard damage is logjam at the bridges, it reduces flow openings, causes blockage and inundation of nearby areas, which lead to infrastructures collapsing during floods (Ruiz-Villanueva et al., 2014a; Wohl et al., 2016; De Cicco et al., 2018). By increasing resistance and obstructions to flow, large wood accumulations along one bank can deflect flow toward the opposite bank and accelerate bank erosion (Montgomery, 1997).
Figure I-1: Wood accumulations on the river channel, a) in Everett, USA, wood jam at the bridge on the Snohomish River (2019); b) In Soquel, USA, after January 1982 storm,
logjam obstructed the bridge (Lassettre et al., 2012).
To predict in real system risk associated with wood, MacVicar and Piégay, (2012) emphasized the need to develop new approaches for documenting and monitoring fluvial wood transport. A better understanding of LW (Large wood) supply, transfer,
Introduction 6
and deposition is necessary in order to balance the positive ecological factors of LW against the risks of increased flooding (Piégay and Gurnell, 1997). Therefore, it is necessary to detect and to monitor the amount of in-stream wood in a quantitative manner, to be able to evaluate the LW-related hazards.
1.4 Definitions
In this section, we introduce some parameters of in-stream wood. Firstly, the wood pieces, which refer to the objects whose size spans from tiny pieces to entire trees. In terms of different types of floating objects, we can distinguish them such as leaves, needles and wood fragments to twigs, branches and even entire trees with leaves and mud. Large wood in streams generally refers to wood pieces that have the size of at least 10 cm in diameter and 1 m in length, it could be utilized by various wood size on different river forms (Gurnell et al., 2002).
Wood flux is the number of wood pieces that pass an observe point on the river per unit time. The wood flux is different from the wood discharge. The first one is a statistic for gathering the number of wood pieces, while the second one is defined by the volume of wood flux, it is the volume of transported wood per unit time. Wood budget is a quantitative framework for analyzing the mass budget of the pieces of wood. Wood budgeting at annual timescales encompasses several key elements, wood volumes and wood flux transport rate being crucial ones.
Bankfull discharge (Qbf) is the flow that reaches the threshold between the channel and river floodplain and is thus a significant morphological parameter (Leopold et al., 2020). Bankfull discharge is usually estimated by 1 to 2 years peak flow (Dunne and Leopold, 1978; Harman et al., 1999), or 1.5 years on average (Rosgen, 1994; Castro and Jackson, 2001; Ghaffarian et al., 2020a). However, the use of Qbf for weighing the flood event often applies variable measurements, depends on different river channel scenario.
1.5 Quantifying in-channel wood fluxes
Figure I-2: Illustration of variables used in wood budgeting analysis (Martin and Benda, 2001)
As mentioned on section 1.3.2, it is necessary to detect and monitor in-stream wood to be able to quantifiably evaluate the interaction between wood and river system, such as how wood decay and deposition could influence ecological habitat, how wood transportation and deposition influence river morphology, and how LW could relate with the natural hazard.
Both Martin and Benda (2001), and Benda and Sias (2003) indicated a quantitative framework for evaluating fluvial transport of wood. The fluvial transport of wood has consistently identified three essential processes, namely wood recruitment (I), transport (QI and QO) and storage (D) (Figure I-2). Therefore, over 20 years of research into LW in streams, many different techniques were used to measure and monitor wood. These field data can lead the researchers to understand and quantify the three essential processes of wood transport in streams.
Introduction 8
Turowki et al. (2013) used a bedload traps which consist of an aluminum frame and the automatic basket samplers which consist of metal cubes with 1 m edges to sampling wood flux during flood event. After the samples were classified and oven-dried, the mass of wood flux can be as a non-linear function of discharge on Erlenbach Steam, Switzerland. Turowki et al.(2013) also suggest that the wood flux export for all size fractions can be estimated from the volumes of LW debris exported in a large event, for example by measuring piece sizes trapped in a reservoir or by video monitoring the passage of wood pieces (e.g., MacVicar and Piegay, 2012). To be more clear; while in the case of coarse wood, the wood discharge has a direct relation with Qf (Turowski et al. 2013), for the large woods Macvicar et al. (2012) found a big non-monotonic behavior at Qbf for large wood discharge.
1.5.1 Use of imagery and video to quantifying wood flux
Optical imagery is one of the most common remote sensing tools installed on different platforms and acquiring different combinations of spatial resolution area. The increasing spatial, temporal and spectral resolutions of imaging technologies are improving our ability to monitor river forms and processes. In the meantime more sophisticated analysis of the imagery obtained is providing new insights and understanding for river scientists (MacVicar et al., 2012). Aerial imagery allows larger reaches to be surveyed and could determine the changes in storage of wood in river channel on annual or decades (Lassettre et al., 2008). MacVicar et al., (2009) repeated wood surveys which were made from low-elevation high-resolution aerial images by using a drone aircraft on the Drôme River, France. These aerial imagery with high resolution could detect wood as small as 0.10 m in diameter. It allows us to calculate the change in wood deposition between flight dates and lateral outputs as a result of floodplain advancement. Boivin et al. (2015) estimated a wood raft volume in channel by using a planimetric analysis of aerial photos. Using decadal and annual intervals, this study aims to examine the accumulation of wood in a large raft of the
Saint-Jean River and to conclude that the relationship between river discharges and wood volumes was not simple, explaining the river network can store or deliver wood in a variable manner during each of the flood events.
Wood removal records from reservoirs are a significant data for the quantification of wood transport. Benacchio et al. (2017) have installed a camera to obtain ground camera images with 10 minutes interval on Génissiat Dam, located in the upstream reach of the Rhône River, France. A random forest algorithm makes a distinction between wood and water surface so as to extract automatically a wood raft area. Although it has provided a high accuracy classification rate and has established a good relationship between wood weights which based on mechanical wood extractions and wood raft surface area monitoring just before the extraction, it is not possible to apply this method to detect wood delivery, because changes in raft density and form are very significant so that the conversion of wood area into wood weight or wood discharge is not direct.
Direct observation of wood movements is rare, the tracing of large wood movements is even less common. The first attempt at creating a wood transport curve used video monitoring of floods on the Ain River in France (MacVicar and Piégay, 2012). Researchers installed a video camera at the Pont de Chazey gauging station. The camera was located on one side of the river. The video feed was transmitted via remote servers to a computer at the University of Lyon and saved in movie jpeg format. For image processing, a semi-manual logging algorithm was written in MATLAB to extract the information of in-stream wood occurence from the videos. A rectification algorithm applying mapping coefficients was developed to transform the pixel coordinates of the wood into real coordinates. The wood length and diameter were calculated from real coordinates as a cylindrical shape for wood. Kramer et al. (2014) set a standard camera on the outside of a band, beyond the Slave River in Canada. On high-discharge and low-gradient River, monitoring LW transport with coarse interval (≥1 min) time-lapse photography enables the
Introduction 10
deployment of monitoring cameras at large spatial and long temporal scales.
Studying the wood flux by very high temporal resolution (in number of pieces per second) is a fairly recent method and there are only a few study-cases which consider such an issue. Video monitoring is a technique that provides continuous monitoring on rivers with a very high temporal resolution, which is applicable for monitoring wood fluxes, especially during the times when access to the river is difficult or even dangerous (e.g., during a flood event) (Kramer et al., 2017; Senter et al., 2017; Ruiz-Villanueva et al., 2019). Wood flux can be studied accurately during single, multi peak and flash floods by high temporal resolution. Especially in high gradient rivers, it is necessary to monitor wood fluxes in high temporal resolution e.g. 1 frame per second (fps) or even more. Lyn et al. (2003) first time used two stream-side video cameras for observing and detecting dramatic wood debris accumulation on bridge pier in the Eel River, USA. Due to storage issues, Lyn et al. (2003) decrease frame rate to 0.1 fps and also apply image compression by decreasing the quality of recorded frames during monitoring period. In more recent works, MacVicar et al. (2009), and MacVicar and Piégay (2012) recorded wood transport during floods in the Ain River (France). They compare LW dynamics with flood hydrograph and develop a quantitative relationship between wood and water discharges using data from a stream-side video camera. The monitoring results were found that a wood transport threshold occurs at 0.67% Qbf. MacVicar and Piégay (2012) and Ghaffarian et al. (2020a) provide some recommendations about using stream-side video cameras in rivers within different situations. By comparing the data provided by MacVicar and Piégay (2012) on the Ain River and two monitored floods on the Isère River (France), they have not only demonstrated the feasibility of the video monitoring approach in the riverine environment but has also showed its limits and constraints.
1.5.2 Detecting wood flux from a stream-side video camera.
capture the movement of objects within the image frame to be distinguished (MacVicar et al., 2012). This technique can be practiced either manually (known as annotation) or automatically (known as detection).
A semi-manual logging algorithm is used to record the position, velocity, dimensions, and other details about detected wood pieces in the video (MacVicar et al., 2009; MacVicar and Piégay, 2012). This algorithm advances the video one frame at a time. The observer manually marks the endpoints and the edges of the wood. The time is then read from the image, and the coordinates of the wood are transformed using a rectification algorithm to obtain the size of wood (Figure I-3). However, there is a weakness for detecting wood manually in the rivers. Since the video is advanced frame by frame to detect wood flux in front of the camera, the observer is obliged to check more than 150 thousand frames per day, which is a huge piece of work. Although Kramer and Wohl (2014) increased sampling interval to monitoring large volume in a low gradient river, it still costs a long time for annotating wood flux on long-term survey.
Figure I-3: Wood detection procedure showing: a) definition of a region of interest (ROI) based on a visual detection of wood including measurement of data and time from time
stamp, b) precise location of end and side points to define the piece length, diameter, and first position, c) definition of second position after advancing a number of frames
to allow calculation of velocity and angular velocity (MacVicar and Piégay, 2012).
Ali and Tougne (2009) developed an unsupervised method to identify floating wood in videos by applying intensity, gradient and temporal masks and then tracked
Introduction 12
the objects through the frame to ensure that they followed the direction of flow. An analysis of about 35 minutes of video showed that approximately 90% of the wood was detected (i.e. about 10% of detections were missed), which confirmed the potential utility of this approach. An additional set of false detections related to surface wave conditions amounted to approximately 15% of the total detections. However, the developed algorithm was not always stable, and was found to perform poorly when applied to a larger data set.
1.5.3 Challenges in video-monitoring of wood discharge
Despite the advantages of video monitoring techniques, there are always some gaps. The first one is about the visibility of the camera (e.g., lack of light during the night time or in cloudy weather or connection lost in case of online cameras (Muste et al., 2008; MacVicar et al., 2009; MacVicar and Piégay, 2012; Ghaffarian et al., 2020a). Although the stream-side camera can monitor wood flux with high temporal resolution, visual detection is still limited to wood pieces that can be clearly distinguished on an annotated frame. Conditions such as night time, cloudy weather, fog, rainfall, snow or dirty lens, affect monitoring quality for several hours. In these cases, modeling wood fluxes would be an effective and low-cost solution so as to get a good estimate of wood flux per contributing event.
The second challenge is about the complexity of the natural environment that has many constraints constantly. The flow of water in rivers contains turbulences and waves which could influence the precision of automatic function. In addition, the cloud movement in sky could alter the luminosity of the river surface. The difference of the brightness plays an important rule of unsupervised monitoring as well. Then, our aim is to overcome these gaps by using models and reduce uncertainties in wood piece censing.
1.6 Objectives
As mentioned above, to be able to quantify wood flux, it is important to detect the huge number of wood pieces for a long-term. Therefore, here study follows three main objectives:
1- Create a model to predict wood flux during entire flood events.
The current study aims to find the relation between wood flux and flow discharge to simplify the monitoring procedure, and to verify whether or not the wood transport threshold is influenced by other weather conditions beside floods. Moreover, we need to explore wood flux in darkness or lens blocked period, in order to estimate whole wood discharge during flood events.
2- Implementation and validation of wood automatic detection software
Although methods for monitoring and tracking wood are progressing rapidly (MacVicar and Piégay, 2012; Ravazzolo et al., 2015a), the temporal dynamics of in-stream wood and long-term observations are extremely rare (Iroumé et al., 2014; Ruiz-Villanueva et al., 2016a). Therefore, the implementation and validation of wood monitoring application are very necessary for detecting wood fluxes continuously.
3- Evaluate human-based uncertainties in video monitoring
We still need manually collected wood flux data to train the automatically wood detection algorithm, and to compare them with different river monitoring data. Analyzed operator bias is very important for considering a patch on the video frames as wood piece is different.
CHAPTER II. Video monitoring of in-channel wood
fluxes: critical events, flux prediction, and sampling
window
2.1 Résumé
Le flux de bois (nombre de pièces par intervalle de temps) est un paramètre clé pour comprendre la budgétisation du bois, déterminer les facteurs de contrôle et gérer le risque d'inondation dans un bassin hydrographique. Des données quantitatives sur les flux de bois sont indispensables pour améliorer la compréhension de la dynamique du bois dans les rivières et estimer le débit de bois dans les cours d'eau. Dans cette étude, la technique de vidéographie en bord de rivière a été appliquée pour détecter le passage du bois et mesurer les taux instantanés de transport du bois. L'objectif était de mieux comprendre comment les flux de bois réagissent aux inondations et aux vents. Au total, un vent exceptionnel et 7 crues ont été surveillés sur l'Ain, en France, et environ 24 000 morceaux de bois ont été détectés manuellement. Nous trouvons une relation empirique entre la fréquence du bois et le rejet de bois, qui est utilisée pour simplifier la procédure de suivi. Il existe un lien univoque entre la fraction de morceaux de bois détectés et le paramètre adimensionnel «temps de passage × framerate», qui fournit une ligne directrice générale pour la conception des stations de surveillance. Il est confirmé qu'en général, il existe un seuil de mouvement du bois dans la rivière égal à 60% du débit à pleine rive. Cependant, lors d'une inondation suivant une journée venteuse, aucun seuil évident de mouvement du bois n'a été observé, ce qui confirme que le vent est important pour la préparation du bois pour le transport entre les crues. Lors de deux crues à plusieurs pics, environ les deux tiers de la quantité totale de bois ont été livrés au premier pic, ce qui confirme l'importance du temps entre les crues pour prédire les flux de bois. L'ensemble de données est utilisé pour développer un
Critical events, flux prediction, and sampling window 16
modèle de régression forestière aléatoire pour prédire la fréquence du bois en fonction de trois variables d'entrée dérivées de l'hydrogramme d'écoulement. Le modèle calcule le volume total de bois pendant la journée ou la nuit en se basant pour la première fois sur la technique de surveillance vidéo, ce qui élargit son utilité pour la budgétisation du bois dans un bassin versant.
2.2 Abstract
Wood flux (piece number per time interval) is a key parameter for understanding wood budgeting, determining the controlling factors, and managing flood risk in a river basin. Quantitative wood flux data is critically needed to improve the understanding of wood dynamics in rivers and estimate wood discharge in streams. In this study, the streamside videography technique was applied to detect wood passage and measure instantaneous rates of wood transport. The goal was to better understand how wood flux responds to flood and wind events. In total, one exceptional wind and 7 flood events were monitored on Ain River, France, and around than 24000 wood pieces were detected manually. We find an empirical relation between wood frequency and wood discharge, which is used to simplify the monitoring procedure. A one-to-one link exists between the fraction of detected pieces of wood and the dimensionless parameter “ 𝑝𝑎𝑠𝑠𝑖𝑛𝑔 𝑡𝑖𝑚𝑒 × 𝑓𝑟𝑎𝑚𝑒𝑟𝑎𝑡𝑒 ”, which provides a general guideline for the design of monitoring stations. It is confirmed that, in general, there is a threshold of wood motion in the river equal to 60% of bankfull discharge. However, in a flood following a windy day, no obvious threshold for wood motion was observed, confirms that wind is important for the preparation of wood for transport between floods. In two multi-peaks floods, around two-thirds of the total amount of wood was delivered on the first peak, which confirms the importance of the time between floods for predicting wood fluxes. The data set is used to develop a random forest regression model to predict wood frequency as a function of three input variables that are derived from the flow hydrograph. The model
calculates the total wood volume either during day or night based on the video monitoring technique for the first time, which expands its utility for wood budgeting in a watershed.
2.3 Introduction
Floating wood in rivers, known as driftwood is a significant component of catchments, notably in forested temperate regions (Ruiz-Villanueva et al. 2016a; Wohl, 2013). It is delivered in the rivers by a set of processes (landslides, debris flows, blowdown, bank erosion and so on) which vary from upstream to downstream (Nakamura and Swanson, 1993; Montgomery et al., 1996; Abbe and Montgomery, 2003; Gurnell and Petts, 2006). Among different recruitment processes, bank erosion probably delivers most of the large organic material into larger lowland rivers (Keller and Swanson, 1979). These large pieces of wood (i.e., 1m length, 10cm diameter), in a river induce variations in hydraulic and sediment dynamics, and contribute flow resistance and obstructions within the channel (Young, 1991; Gippel, 1995; Shields and Gippel, 1995; Wilcox and Wohl, 2006; Comiti et al., 2008). Especially during a flood, the transport and deposition of large wood pieces could represent a potential increase in the destructive power of floods, which increases the potential risks to human populations and infrastructures ( Lassettre and Kondolf, 2012; De Cicco et al., 2018; Mazzorana et al., 2018). For instance, a flow obstruction due to wood accumulation can lead to upstream bed aggradation, channel avulsion, and local scouring processes, which can in turn cause embankment or bridge collapse and floodplain inundation (Diehl, 1997; Lyn et al., 2003; Fischer, 2006; Waldner et al., 2007; Mao et al., 2008; Mazzorana et al., 2009; Comiti et al., 2012; Ruiz-Villanueva et al., 2014a). Therefore, quantifying wood inputs, transport, deposition, and budgeting in general is crucial for understanding and managing wood risk in rivers.
Understanding the variability and the process-scale dynamics which control wood delivery and transport rate is also a critical challenge (Martin and Benda, 2001;
Critical events, flux prediction, and sampling window 18
Benda et al., 2003; Marcus et al., 2011; Schenk et al., 2014; Boivin et al., 2015). Wood budgeting can be explored at different time scales. The wood recruitment sites are often observed close to the preferential sites of deposition (Schenk et al. 2014; Ravazzolo et al. 2015), but not systematically, as shown along the Isère River, France (Piégay et al., 2017). Some pieces of wood can be transported over very long distances during a single flood (Gurnell et al., 2002; Gurnell, 2012; Comiti et al., 2016; Kramer and Wohl, 2017). Moreover, the amount of wood can be documented at multi-annual and annual time intervals over long time periods by historical data (Seo et al., 2008; Seo and Nakamura, 2009; Ruiz-Villanueva et al., 2014b). Based on this long time scale, however, it is not possible to record continuous series and study wood transport processes during shorter but critical hydrological events such as floods, exceptional wind events, and landslides, which are known to drive wood fluxes in rivers (Lassettre and Kondolf, 2012; Ruiz Villanueva et al., 2014a).
To generate wood input series in shorter time scales, Moulin and Piégay, (2004) used weekly time steps to measure the wood stored in a reservoir. The results quantified the timing and magnitude of Large Wood (LW) export during flood events in the reservoir and allowed the recruitment and transport processes of LW at the watershed scale to be better understood. Benacchio et al. (2017) monitored wood delivery and calculated wood weight in a reservoir by an automated image processing technique using much finer time intervals (10 min). In addition to the reservoir-based monitoring, Kramer and Wohl, (2014) showed that in high-discharge, low-velocity rivers, the deployment of monitoring cameras with coarse frame rates (≥
1 min) enables monitoring of LW transport at large spatial and long temporal scales. However, in smaller and steeper rivers the velocity of wood pieces is higher or the field of view is too small such that low frame rate photography cannot provide accurate estimates of wood delivery.
Video monitoring of the water surface can be used to continuously monitor wood flux at a high temporal resolution. Lyn et al., (2003) were the first to apply this
technique, using two stream-side video cameras to observe and detect wood accumulation on bridge pier in the Eel River, Unites States. Due to data storage issues, Lyn et al., (2003) downgraded the frame rate to 0.1 fps (frame per second) and applied image compression to the recorded frames through the monitoring period. Such issues were overcome by MacVicar et al. (2009), and MacVicar and Piégay (2012) who established a monitoring station at the Ain River, France, but transferred the full resolution images recorded at 5 fps to a remote server for analysis. The high quality and frequency of the data, which is likely necessary in high gradient rivers, allowed them to compare LW dynamics with flood hydrograph and develop a quantitative relation between wood and water discharges. Other studies have implemented similar approaches (Boivin et al., 2015; Kramer et al., 2017; Senter et al., 2017; Ruiz-Villanueva et al., 2018; Ghaffarian et al., 2020a) but overall the technique remains undersubscribed and models of the wood flux as a function of the flow hydrograph remain poorly parameterized.
Overall, the success of a particular monitoring station will be determined by issues of wood size and image resolution (MacVicar and Piégay, 2012; Ghaffarian et al., 2020a). Ghaffarian et al. (2020a) monitored floods on the Isère River (France) and demonstrated the generalizability of technique to other rivers along with some limits, constraints, and methodological recommendations. The oblique angle of the camera means that it is particularly important to understand where wood will pass relative to the camera position (Ghaffarian et al., 2020a). Moreover, a problem remains that there are gaps within the data. Such gaps can occur due to the poor visibility in low light or cloudy weather, lost connections where data is transferred to a remote server for storage (Muste et al., 2008; MacVicar et al., 2009; MacVicar and Piégay, 2012; Ghaffarian et al. 2020a), or simply to the time required to extract information about floating wood from videos. Despite some efforts at automatic extraction (Ali and Tougne, 2009; Lemaire et al., 2014), the procedure to date remains predominantly manual. Improved modeling of wood fluxes as a function of
Critical events, flux prediction, and sampling window 20
flow hydrographs or other environmental conditions could be an effective strategy to reduce sampling effort and fill in missing data such that wood fluxes could be integrated over time to support wood budgeting in watersheds.
The aim of the current study is to advance the video monitoring technique for wood flux measurement by addressing the following questions: i) Is wood transported only during floods (approximately two thirds of the bankfull discharge (MacVicar and Piégay, 2012)) and, if so, is the transport threshold discharge a function of antecedent conditions? ii) Can wood flux be modeled as a function of the flood hydrograph? and iii) Can we accurately estimate wood flux from sampling? The analysis uses the database assembled by MacVicar and Piégay (2012) of sampled periods during three floods on the Ain River but significantly adds to this work by performing a complete analysis of the daytime videos from four new flood events and one period with the low flow but an exceptional wind condition, which was then followed by a flood event. This much larger database comprises nearly 180 hours of annotated videos or around than 24,000 annotated wood pieces including 18 hours videos and 7800 wood pieces monitored by MacVicar & Piégay (2012). The windy day event with 35-year return period allowed us to address the first research question. A random forest (RF) model was used to answer the second question.
2.4 Study site
The study site is located on the lower Ain River, a sixth-order piedmont river flowing through a forested corridor in France. The channel is typically single thread with occasional islands, and a wandering system with prominent meander scrolls and cutoff channels (Figure II-1.a) (MacVicar et al., 2009). The hydrograph shows a strong seasonal pattern, with low flows in the summer and most of floods occurring between October and April. Bed material sizes are gravel–cobble mix with a median
size of 2.5 cm. The unvegetated channel width is 65 m in average at the study site, actively shifting so that significant amount of wood is delivered by bank erosion. Tree
species established in the floodplain are a mix of soft and hardwood species dominated by black poplar (Populus nigra) that can reach up to 75 cm in diameter and 25 m in height (MacVicar and Piégay, 2012). Along the study site, wood influx has been estimated over several decades from the analysis of aerial photographs at 18 to 38 m3/km/yr (Lassettre et al., 2008).
Floating wood was counted on the river at Pont de Chazey, where a stream gauge is maintained by a regional authority (Figure II-1.b, c). Along the river, the characteristic discharge of 1.5-year return period was 𝑄1.5= 840 m3/s (Ghaffarian et al., 2020a), and at this study site, an estimated bankfull discharge (𝑄𝑏𝑓) of 530m3/s
was confirmed by visual observation (MacVicar and Piégay, 2012). At this point the flow discharge is calculated based on the water elevation measured at the gauging station. These data are available online from 1959 at (www.hydro.eaufrance.fr). Mean daily wind speed is also available from the Meteorological Station of Lyon-Bron (1949-2020) (see Figure II-2).
Critical events, flux prediction, and sampling window 22
Figure II-1. Study site at Pont de Chazey: a) Location of the Ain River course in France and location of the gauging and meteorological stations, b) camera position and its view angle in yellow, c) overview of the gauging station with the camera installation
point, d) view of the River channel from the camera
2.5 Material and Methods
2.5.1 Stream-side video camera
Wood pieces were monitored at Pont-de-Chazey gauging station using an AXIS P221 Day/Night™ fixed network camera installed in the spring of 2007. Figure II-1.d
shows the camera field of view on the river surface. The video camera can supply high resolution (HDTV720P) surveillance even in extreme low-light, though not at night time. The camera was located on the side of the river closest to the thalweg to provide a maximum resolution where the majority of wood pieces are observed. The camera elevation is 9.84 m above the base flow surface at a sufficiently wide angle to
afford a view of the entire river width during most periods. Ethernet connectivity enables the automatic transfer of recorded videos to a central server where located at CNRS UMR 5600 – Environment Ville et Société, Site of École Normale Supérieure, Lyon, France. Videos were recorded continuously at a maximum frequency of 3 to 5 fps. Data was recorded with this camera from 2007 to 2011 at a resolution of 640×480 pixels and from 2012 to 2016 at 768×576 pixels. The first three floods (events F1 to F3) thus have a lower resolution than the final four floods and windy period (events F4 to F7 and W1). At minimum compression, each video segment occupied approximately 94Mb of memory and approximately 15 minutes so that a 4TB hard drive stored approximately one year of video. Flood levels were reviewed every few days and videos of interest were saved for later analysis.
2.5.2 Monitored events
In total, 7 flood events were monitored in this study (Table II-1). Three flood events from 2007 to 2008 were collected from MacVicar & Piégay (2012), referred to herein as events F1 to F3 (Figure II-2.a, red lines). A video camera has been recorded video at this location more or less continuously from 2007. For the current work, four additional flood events between 2012 to 2014 were selected for study and sampling and are referred to as events F4 to F7 (Figure II-2.a, blue lines). The floods range from 578 m3/s (≅ 𝑄
𝑏𝑓) to 1020 m3/s (≅ 2𝑄𝑏𝑓). Event F7 was selected to assess whether wind has an effect on the wood delivery because it occurred just two days after an exceptional windy day. The windy day occurred on December 24, 2013 and is referred to herein as event W1 (Figure II-2.b). The average daily wind speed on this day was 13.6 m/s, which is considered to be a one in 35 year event based on a Gumbel distribution of the over 70 years of record (Yue et al., 1999).
Critical events, flux prediction, and sampling window 24
Table II-1 Wood sampling statistics at the Pont de Chazey for different events.
Flood periods E v e n ts Peak flows (m3/s) D a ily w ind v e loc it y (m/ s ) A n a ly z e d v ide o ( h r) Mon it o re d fr a c tion
* Number of floating woods
total daylight Rising limb falling limb
22 to 24-Nov-2007 F1 578 576 6.6 06:15 09% 2800 38 10 to 12-Dec-2007 F2 616 616 6.3 03:45 05% 968 93 10 to 13-Apr-2008 F3 1050 1007 3.8 07:45 08% 3331 584 01 to 07-Jan-2012 F4 808 807 4.9 57:00 34% 3681 1641 15 to 16-Dec-2012 F5 932 821 4.9 17:15 36% 6901 798 01 to 06-Feb-2013 F6 701 701 8.5 56:30 39% 1040 473 24 to 25-Dec-2013 W1 134 134 13.6 08:45 37% 8 - 25 to 27-Dec-2013 F7 600 580 5.6 25:45 36% 1443 43
* Monitored fraction = monitored duration / total duration of an event
Figure II-2. Monitored events a) the daily mean discharge series monitored by MacVicar & Piégay (2012) (red lines) and monitored in this work (blue lines) on the discharge series from 2007 to 2014. b) The daily mean wind velocity series from 1977 to 2013.
2.5.3 Monitoring process
In total 183 hours of video were analyzed, including 18 hours monitored by MacVicar & Piégay (2012) (Table II-1). After detecting each piece of wood in a video frame, the position of wood was annotated manually frame by frame.