MÉMOIRE PRÉSENTÉ À
L'UNIVERSITÉ DU QUÉBEC À TROIS-RIVIÈRES
COMME EXIGENCE PARTIELLE
DE LA MAÎTRISE EN SCIENCES DE L'ENVIRONNEMENT
PAR
RABAH MAZOUZ
ANAL YSE DE LA VARIABILITÉ INTERANNUELLE DES CARACTÉRISTIQUES DES DÉBITS DE FORTES CRUES PRINTANIÈRES
AU QUÉBEC MÉRIDIONAL
Université du Québec à Trois-Rivières
Service de la bibliothèque
Avertissement
L’auteur de ce mémoire ou de cette thèse a autorisé l’Université du Québec
à Trois-Rivières à diffuser, à des fins non lucratives, une copie de son
mémoire ou de sa thèse.
Cette diffusion n’entraîne pas une renonciation de la part de l’auteur à ses
droits de propriété intellectuelle, incluant le droit d’auteur, sur ce mémoire
ou cette thèse. Notamment, la reproduction ou la publication de la totalité
ou d’une partie importante de ce mémoire ou de cette thèse requiert son
autorisation.
Je tiens à remercier vivement:
Mon directeur de recherche, le professeur Ali Assani, pour son professionnalisme, ses conseils précieux et ses directives qui m'ont éclairé et orienté pour ce projet de recherche;
Mon codirecteur de recherche, le professeur Marco A. Rodriguez, pour avou suscité mon intérêt pour les méthodes statistiques multidimensionnelles et pour ses conseils utiles;
Les professeurs Jean-François Quessy et Mhamed Mesfioui pour avoir accepté de faire partie de mon comité d'orientation et m'avoir assisté à l'utilisation et l'interprétation des méthodes statistiques multidimensionnelles.
Merci également à tous ceux qui ont été impliqués de près ou de loin à l'élaboration de mon projet de recherche et surtout le groupe du LIAGE pour son soutien moral après avoir vécu des moments difficiles à la suite de mon accident survenu le 23 mai 2010.
Ce document s'inscrit conformément à l'article 138.1 du règlement des études de cycles supérieurs permettant de présenter les résultats obtenus dans le cadre d'une maîtrise de recherche en sciences de l'environnement sous forme d'article scientifique plutôt que sous forme de mémoire traditionnel.
Ce mémoire est composé de trois chapitres. Le prelTIler consiste en une introduction.
Les chapitres II et III de ce mémoire sont présentés sous forme d'articles scientifiques. Je confmne avoir travaillé en tant que premier auteur sur ces deux chapitres. Les données ayant servi à la réalisation de cette recherche proviennent du professeur Ali A. Assani.
L'article qui constitue le second chapitre de ce mémoire a été publié dans la revue Advances in Water Resources (Mazouz R., Assani A. A., Quessy JF. and Légaré G. 2012) sous le titre suivant: Comparison of the interannual variability of spring heavy floods characteristics oftributaries of the St. Lawrence River in Quebec (Canada).
L'article qui constitue le troisième chapitre (Mazouz R. , Assani A. A. and Rodriguez M 2013) Application of redundancy analysis to hydroclimatology: A case study of spring heavy floods in Southern Québec (Canada) a été publié dans la revue Journal of Hydrology en mai 2013.
REMERCIEMENTS ... li AVANT-PROPOS ... üi CHAPITRE 1
IN'TRODUCTION ... 1
1.1 Contexte de recherche ... 1
1.2 Problématique, objectifs et hypothèses de recherche ... 2
1.3 Méthodologie de recherche... 3
1.3.1 Méthode de Lombard... 3
1.3.2 Méthode canonique de redondance... 4
1.4 Résultats de recherche... 5
1.4.1 Résultats de la méthode de Lombard... 5
1.4.2 Résultats de la méthode canonique de redondance... 6
CHAPITRE II COMP ARISON OF THE IN'TERANNUAL V ARIABILITY OF SPRING HEA VY FLOODS CHARACTERISTICS OF TRIBUT ARIES OF THE ST. LAWRENCE RIVER IN' QUEBEC (CANADA) ... 8
Résumé... 10
Abstract ... Il Introduction... 12
Methodology ... 13
Choice of rivers and composition of hydrologic series of spring maximum flow characteristics ... 13
Statistical analysis... 16
Detection ofbreakpoints in a univariate series ... 16
Detection ofbreakpoints in the dependence of a bivariate series ... 18
Results... 19
Detection of breakpoints in a univariate series... 19
Detection ofbreakpoints in the dependence of a bivariate series... 21
References... 25
List of figures ... 39
CHAPITRE III APPLICATION OF REDUNDANCY ANALYSIS TO HYDRO-CLIMATOLOGY: A CASE STUDY OF SPRING HEA VY FLOODS IN , SOUTHERN QUEBEC (CANADA) ... S3 Résumé... 55
Abstract ... 56
Introduction... 57
Methods... 59
Choice of rivers and climate indices... 59
Composition of hydrologic series of spring maximum flow characteristics ... 61
Statistical Analysis ... 62
Results... 65
Discussion and Conclusion... 67
References... 73
List of figures... 85
CHAPITRE IV , , CONCLUSION GENERALE ... 88
INTRODUCTION
1.1 Contexte de recherche
Les impacts réels ou potentiels du réchauffement climatique sur les débits des rivières suscitent encore beaucoup de controverse. Cette controverse s'explique en partie par la difficulté des modèles climatiques à simuler adéquatement les précipitations qui génèrent les débits en raison de la diversité des sources d'incertitude dans les simulations climatiques (p. ex. Koutsoyiannis et al., 2008; Kundzewicz et al., 2008; Riiisanen, 2007; Sun et al., 2007). Ainsi la prédiction des précipitations demeure encore incertaine. De plus, d'autres facteurs comme l'évapotranspiration, susceptibles d'influencer significativement la variabilité interannuelle des débits, ne sont pas pris suffisamment en compte par les modèles climatiques dans la prédiction des débits.
La prédiction des débits au Québec sous l'influence du réchauffement climatique fait aussi l'objet de controverse. Certains chercheurs prédisent une baisse des débits (p. ex. Croley, 2003); d'autres prédisent au contraire une hausse des débits (p. ex. Dibike and Coulibaly, 2005; Kundzewicz et al., 2008; Labat et al., 2004; McBean and Motiee, 2008; Roy et al., 2001; Singh, 1987). Entre ces deux positions opposées, certains chercheurs prédisent une alternance des périodes de hausse et de baisse des débits (p. ex. Minville et al., '2010). Enfin, d'autres chercheurs soutiennent que les changements des débits vont varier en fonction des saisons (p. ex. Boyer et al., 2010) : une hausse des débits en hiver, consécutive à une augmentation de la fréquence des précipitations sous forme de pluies, mais une baisse des débits au printemps en raison de la diminution de la quantité de neige qui tombe en hiver.
1.2 Problématique, objectifs et hypothèses de recherche
Pour contribuer à clarifier le débat sur la prédiction des débits au Québec, il devient important d'analyser la variabilité interannuelle des débits sur une période suffisamment longue afin de pouvoir détecter les effets du réchauffement climatique. Cette approche a été utilisée récemment par Assani et al. (2010) en ce qui concerne les débits maximums printaniers. Ces auteurs ont conclu que la variabilité interannuelle de ces débits n'est pas influencée par le réchauffement climatique. De plus, ces auteurs ont aussi démontré que la variabilité interannuelle des débits maximums printaniers n'est pas influencée par les mêmes indices climatiques. En effet, en Rive-Nord, les débits sont corrélés à l'oscillation atlantique multidécennale (OAM) et en Rive-Sud, ils le sont respectivement à l'oscillation australe (OAU) au nord du 47eparallèle nord et à l'oscillation arctique (OA) au sud de ce parallèle. Bien que cette approche soit couramment utilisée dans la littérature scientifique, force est cependant de constater qu'elle présente une faiblesse: elle ne tient pas compte de toutes les caractéristiques fondamentales des débits (magnitude, durée, période d'occurrence, fréquence et variabilité). En effet, chacune de ces cinq caractéristiques joue un rôle important dans le fonctionnement des écosystèmes fluviaux. De plus, on doit admettre le fait que les impacts du réchauffement peuvent ou ne pas affecter, de manière uniforme, les cinq caractéristiques fondamentales. Certaines caractéristiques fondamentales seraient plus sensibles au réchauffement climatique que d'autres. Par conséquent, les études basées sur l'analyse de la variabilité temporelle d'une seule caractéristique fondamentale, en l'occurrence la magnitude, peuvent être considérées comme incomplètes pour détecter le signal du réchauffement climatique sur la variabilité interannuelle des débits.
À la lumière de ces considérations, notre projet de recherche poursuit les trois objectifs suivants:
1. Comparer la variabilité interannuelle des cinq caractéristiques fondamentales des débits de fortes crues printanières des 17 affluents naturels ou subnaturels du fleuve Saint-Laurent au Québec. Cet objectif repose sur l'hypothèse
suivante: la variabilité interannuelle n'est pas unifonne pour les cinq caractéristiques, car certaines caractéristiques seraient plus sensibles au réchauffement climatique que d'autres.
2. Analyser les changements qui affectent le lien entre les cinq caractéristiques des débits dans le temps. Cet objectif se fonde sur l'hypothèse suivante: les changements des moyennes et/ou des variances de certaines caractéristiques fondamentales des débits de fortes crues printanières dans le temps affectent peu le degré de dépendance entre ces caractéristiques.
3. Comparer les facteurs climatiques qui influencent la variabilité temporelle de ces cinq caractéristiques. L'hypothèse qui sous-tend cet objectif est la suivante: la variabilité interannuelle de ces cinq caractéristiques n'est pas influencée par les mêmes facteurs (indices) climatiques en raison de leur sensibilité différente à la variabilité climatique.
En ce qui concerne le dernier objectif de notre étude, nous avons proposé une méthode qui pennet d'analyser simultanément la relation entre toutes les caractéristiques fondamentales des débits de plusieurs rivières et les indices climatiques.
1.3 Méthodologie de recherche
1.3.1 Méthode de Lombard
Le test de Lombard (1987) a été effectué à l'aide d'un programme en langage MatLab. Dans ce test, on compare les valeurs de la série (Sn) avec celle de la valeur critique (VC), dans le cas de notre étude, la valeur critique est égale à 0.0403 «seuil critique de significativité du test de Lombard de 5 % (Lombard, 1987) », les valeurs Sn supérieures à cette valeur critique de 0.0403 sont statistiquement significatives.
Deux étapes sont à suivre pour compléter le test de Lombard, la première étape consiste à tester la moyenne, et la seconde étape, à tester la variance. La rupture sera détectée entre les temps (tl,t2) dans le cas où la valeur de la série statistique (Sn) calculée sur la série est supérieure à la valeur critique de 0.0403.
1.3.2 Méthode canonique de redondance
Pour corréler les cinq caractéristiques des débits (magnitude, durée, période d'occurrence, fréquence et variabilité) aux cinq variables climatiques (OAM, OA, ONA, OPD et OAU), on a appliqué la méthode d'analyse canonique de redondance. Celle-ci a été développée par Rao (1964). Elle est une version canonique de l'analyse en composantes principales (ACP) des variables dépendantes Y (caractéristiques des débits) effectuées sous les contraintes imposées par les variables indépendantes X (indices climatiques). L'objectif de l'analyse est de chercher la combinaison des variables indépendantes (indices climatiques) qui explique le mieux la variation (ou dispersion) des variables dépendantes (caractéristiques des débits). L'Analyse canonique de redondance trouve les axes d'ordination des nuages de points qui sont les plus fortement linéairement liés à l'ensemble des variables explicatives. Selon Makarenkov et Legendre (1999), il existe deux approches pour effectuer une analyse canonique de redondance, mais elles conduisent aux mêmes résultats. La première approche est fondée sur l'utilisation de l'algorithme itératif de calcul des axes principaux. La seconde approche, utilisée notamment par Makarenkov et Legendre (1999), consiste au calcul d'une série de régressions linéaires multiples des variables dépendantes Y sur les variables indépendantes X, suivies d'une analyse en composantes principales de la matrice des valeurs ajustées.
On calcule la régression linéaire multiple de chaque variable dépendante centrée Y, à tour de rôle, sur toutes les variables indépendantes centrées X.
1.4 Résultats de recherche
1.4.1 Résultats de la méthode de Lombard
En ce qui concerne les deux premiers objectifs de notre recherche, les résultats obtenus par la méthode de Lombard pour la moyenne et la variance pour les 17 rivières analysées sont les suivants:
Un changement de la moyenne de la magnitude a été détecté seulement pour trois rivières (De la petite Nation, Matane et Ouelle). Il se traduit par une hausse de la magnitude de crues printanières. Mais cette hausse n'est pas survenue la même année pour les trois rivières. De plus, aucun changement de la variance de la magnitude n'a été détecté même pour ces trois rivières.
- Un changement de la durée de la magnitude n'a été observé que pour une seule rivière (Eaton). Cette durée a diminué dans le temps. Deux rivières (Beaurivage et Ouelle) ont connu un changement significatif de la variance de la durée.
- Six rivières ont connu un changement significatif de dates moyennes d'occurrence de crues (De la petite Nation et en Matawin 1975, Du loup, Matane et Rimouski en 1978, et Vermillon en 1974). Pour ces rivières, le changement se traduit par une occurrence précoce de crues. En ce qui concerne la variance, une seule rivière (Nicolet du sud-ouest en 1958) a connu un changement significatif de la variance des périodes d'occurrence de crues. Toutefois, pour cette rivière, la moyenne des périodes d'occurrence n'a pas significativement changée. Par ailleurs, contrairement aux autres caractéristiques, tous les changements de la moyenne de période d'occurrence sont quasi synchrones. En effet, ils sont tous survenus durant la décennie 1970.
- Deux rivières (De la petite nation et Matane) ont connu un changement de la moyenne de la variabilité de la magnitude et deux autres (Blanche et Du Sud), celui de la variance de la variabilité de la magnitude. La variabilité de la magnitude de deux premières rivières augmente dans le temps.
- L'analyse de la variabilité interannuelle de la fréquence des débits de crues au moyen de la régression linéaire a révélé une hausse significative de la fréquence pour trois rivières (Blanche, Nicolet du sud-ouest et Trois-Pistoles) mais une baisse significative de la fréquence pour la rivière Rimouski. De plus, cette méthode a confirmé les changements observés par l'application de la méthode de Lombard en ce qui concerne les moyennes des séries.
1.4.2 Résulta.ts de la méthode canonique de redondance
En ce qui concerne le troisième objectif de notre recherche qui consiste à comparer les facteurs climatiques qui influencent la variabilité temporelle de ces 5 caractéristiques des 17 rivières, les résultats obtenus par la méthode canonique de redondance sont les suivants:
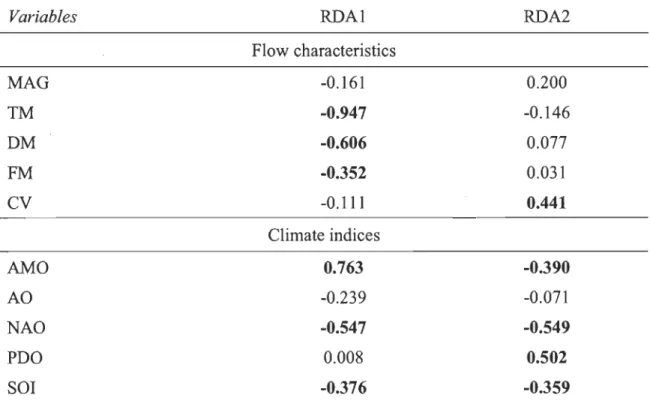
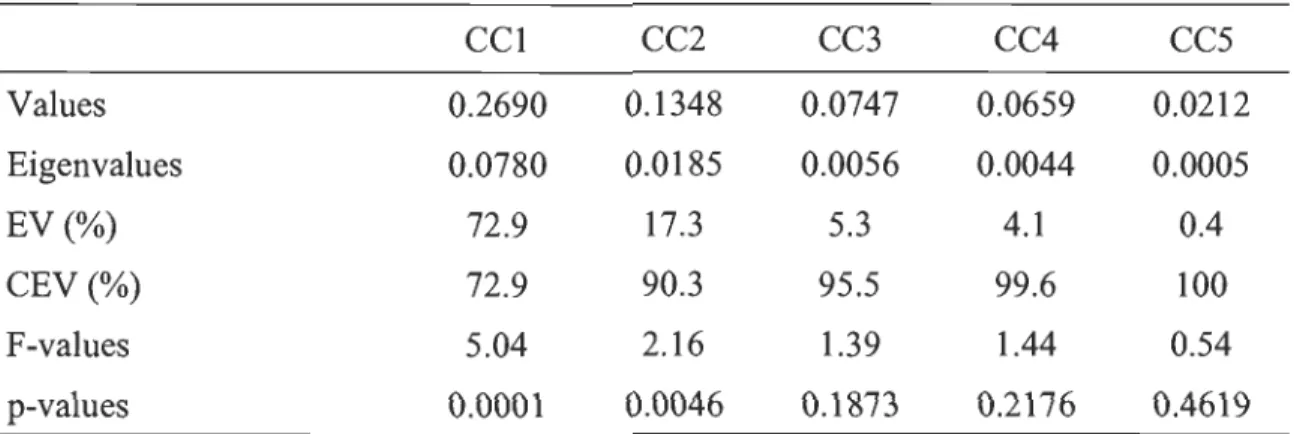
Les variances expliquées cumulées de deux premiers axes canoniques calculés au moyen des indices climatiques hivernaux et printaniers sont respectivement de 78 % et 92 %. Ceci traduit en fait une meilleure corrélation entre les caractéristiques des débits et les indices climatiques printaniers.
En ce qui concerne les axes calculés au moyen des indices climatiques hivernaux, le score de la durée est corrélé négativement au premier axe tandis que celui de la caractéristique fréquence est corrélé positivement au second axe canonique. Quant aux indices climatiques, les scores d'OAM (Oscillation atlantique multi-décennale) et d'OAU (Oscillation australe) sont bien corrélés sur le premier axe canonique alors que ceux d'OA (Oscillation arctique) et ONA (Oscillation nord-atlantique) le sont sur le deuxième axe canonique.
Au niveau des indices climatiques printaniers, la période d'occurrence et la durée sont corrélées négativement au premier axe canonique tandis que la variabilité CV (Coefficient de Variation) est corrélée positivement au second axe. Quant aux indices climatiques, les scores (OAM) et (ONA) sont corrélés au premier axe canonique alors
que les indices ONA et OPD (Oscillation Pacifique Décennale) sont corrélés au second axe canonique.
Il ressort de cette analyse que la caractéristique de la durée des débits est corrélée aux indices hivernaux d'OAM et d'OAU et la caractéristique fréquence est corrélée aux indices hivernaux d'OA et d'ONA. En ce qui concerne les indices printaniers, les indices OAM et ONA sont corrélés à la période d'occurrence et à la durée de fortes crues printanières. Cette corrélation est positive entre ONA et les deux caractéristiques, mais négative entre celles-ci et OAM. Enfm, la caractéristique CV est corrélée négativement à ONA, mais positivement à OPD. Ces corrélations sont confirmées par la longueur des flèches associées aux caractéristiques des débits et aux indices climatiques.
Les notes factorielles des stations sur les axes canoniques n'ont pas révélé une organisation spatiale bien précise sur les axes canoniques calculés au moyen des indices climatiques hivernaux. En revanche, en ce qui concerne les indices climatiques printaniers, les notes factorielles de toutes les rivières situées dans les régions hydroclimatiques est et sud-est sont toutes négatives alors que celles des rivières de la région hydroclimatique sud-est sont positives à l'exception d'une seule rivière.
COMP ARISON OF THE INTERANNUAL V ARIABILITY OF SPRING HEA VY FLOODS CHARACTERISTICS OF TRIBUTARIES OF
THE ST. LAWRENCE RIVER IN QUEBEC (CANADA)
Ce chapitre est présenté sous forme d'article, en anglais, et a été publié dans la revue Advances in Water Resources sous la référence:
Mazouz R., Assani A.A., Quessy JF. and Légaré G. 2012. Comparison of the interannual variability of spring heavy floods characteristics of tributaries of St. Lawrence River in Quebec (Canada). Advances in Water Resources, 35, 110-120.
Comparison of the interannual variability of spring heavy floods characteristics of tributaries of the St. Lawrence River in Quebec (Canada)
Rabah Mazouz*, Ali A. Assani*, Jean-François Quessy** and Guillaume Légaré*
*Section de Géographie (Geography Section), Laboratoire d'hydroc1imatologie et de Géomorphologie fluviale et Centre de recherche sur les interactions bassins versants-écosystèmes aquatiques (RIVE), Pavillon Léon-Provencher, Université du Québec à Trois-Rivières, 3351 Boulevard des Forges, Trois-Rivières, Québec, G9A 5R7, Canada.
**Département de mathématiques et d'informatique (Department of Mathematics and Computer Science), Université du Québec à Trois-Rivières, 3351 Boulevard des Forges, Trois-Rivières, Québec, G9A 5R7, Canada.
Corresponding author
Ali A. ASSANI
Section de Géographie (Geography Section), Laboratoire d'hydroc1imatologie et de Géomorphologie fluviale et Centre de recherche sur les interactions bassins versants-écosystèmes aquatiques (RIVE), Pavillon Léon-Provencher, Université du Québec à Trois-Rivières, 3351 Boulevard des Forges, Trois-Rivières, Québec, G9A 5R7, Canada. Tel. 819-376-5011; Fax: 819-376-5179; Email: Ali.Assani@uqtr.ca
Résumé
Nous avons comparé la variabilité interannuelle de cinq caractéristiques fondamentales (magnitude, durée, période d'occurrence, fréquence et variabilité) des débits maximums printaniers de 17 rivières naturelles au Québec pendant la période 1934-2004 afm de détecter l'impact de réchauffement climatique sur ces caractéristiques. L'analyse a été effectuée au moyen des méthodes de Lombard et de la régression linéaire. Peu de changements significatifs ont été observés sur les séries de magnitude, de durée, de fréquence et de variabilité des débits de crues printanières. En revanche, nous avons détecté un changement significatif de la période d'occurrence de crues printanières (occurrence précoce) pour 35 % de rivières analysées. Ce changement, survenu de manière quasi synchrone .durant la décennie 1970, a été interprété comme un signal de réchauffement climatique.
Mots clés: Caractéristiques des débits, variabilité interannuelle, crues printanières, changement climatique, Méthode de Lombard, Régression linéaire, Québec
Abstract
Comparison of the interannual variability of five characteristics (magnitude, duration, timing, frequency, and variability) of spring heavy floods was carried out for 17 natural rivers in Quebec for the period from 1934 to 2004 to detect any effect of climate warming on these characteristics. This was done using the Lombard method and Copula. Changes in the mean and variance of aIl characteristics of streamflow were observed, and aIl these changes are abrupt. Whereas little significant change was observed in the magnitude, duration and variability (CV) series of spring flood flows. A significant change was noted in the frequency (diminution) for five rivers and in the timing of spring floods for six rivers. However, the change in mean timing is the only one that has a hydroclimatic significance in time and space. This change was observed, on the one hand, in the Eastern hydrological region, located on the south shore of the St. Lawrence River, north of 47~, and characterized by a maritime climate and, on the other hand, in the South-west hydrological region, located on the north shore and characterized by a continental climate. In both cases, the change took place after the second half of the 1970's and is characterized by the early occurrence of spring floods. In addition, in both hydrological regions, the timing of spring floods is correlated with the same hydroclimatic indices, showing a positive correlation with the North Atlantic Oscillation (NAO) and a negative correlation with the Atlantic Multidecadal Oscillation (AMO). Frequency is the only characteristic for which mean and variance changed significantly over time for the same rivers (4), aIl located north of 48~, on both shores of the St. Lawrence. For aIl flow characteristics, the change in variance can predate, postdate or be synchronous with the change in mean. Finally, the dependence between the various characteristics of spring floods as determined using the Kendall tau statistic remained constant in time for most of the rivers.
Keywords: flow characteristics, spnng floods, Lombard method, linear regression, Kendall tau, Quebec
Introduction
A consensus is growing regarding the fact that climate wanning might, to sorne extent, affect flood flows throughout the world. Thus, a growing number of studies attempts to constrain the effect of this wanning on the interannual variability of flood flows (e.g. Assani et al., 2010a; Bhutiyani et al., 2008; Burn, 2008; Burn et al., 2004; Carson, 2007; Cayan et al., 2001; Cunderlik and Burn, 2002, 2004; Cunderlik and Ouarda, 2009; Douglas et al., 2000; Jiang et al., 2005; Déry et al., 2009; Dettinger, 2011; Hannarford and Marsh, 2008; Hodgkins et al., 2003; Hodgkins and Dudley, 2006; Leclerc and Ouarda, 2007; Lindstrom and Bergstrom, 2004; Petrow and Merz, 2009; Robson, 2002; St George, 2007; Villarini et al., 2009; 2011a, 2011b; Villarini and Smith, 2010; Vogel et al., 2011; Whitfield, 2007; Whitfield and Cannon, 2000; Whitfield et al., 2003; Zhang et al., 2001). Although the most widely accepted notion is that the intensity (magnitude) of flood flows should increase (Kundzewicz et al., 2010), such an increase is still rarely observed. In spite of the increasing global temperature, analysis of many hydrological series of flood flows has revealed no significant change in their mean or variance (e.g. Assani et al., 201Oa; Bum and Hag Elnur, 2002; Kundzewicz et al., 2005).
However, aU these studies generaUy deal with peak magnitude and not with other characteristics of floods (frequency, duration, timing, and variability). It is therefore important to determine which flow characteristic is most sensitive to climate variability or climate change in order to monitor its effect on flood conditions. Thus, this study has four objectives:
1. To compare the interannual variability of aU fundamental characteristics of spring maximum flows in southem Quebec. The hypothesis to test is the unifonnity of the interannual variability of aU five fundamental characteristics of spring flood flows. 2. To detennine which characteristics of spring maximum flows aremost sensitive to
climate wanning in Quebec. These characteristics can then be used to detect and monitor the climate warming signal and the effect of climate indices.
3. To use the copula method to analyze the dependence between spring maximum flow magnitude (primary characteristic) and the other fundamental characteristics, to see if climate warming has any effect on this dependence. This issue has not yet been addressed in the scientific literature.
4. To determine whether the mean and variance of hydrological series show a similar sensitivity to climate change or climate variability.
Methodology
Choice of rivers and composition of hydrologic senes of spring maxImum flow characteristics
The St. Lawrence River watershed in Quebec covers a 673,000 km2 area. Tributaries of the St. Lawrence for which a continuous record of flow measurements over at least 50 years is available and which are not significantly affected by dams or other major human activity were selected for the study. In total, 17tributaries were selected (Fig. 1 and Table 1). On the south shore, many gauging stations on these rivers are located near their confluence with the St. Lawrence River. The 17 rivers were subdivided into three homogeneous hydrological regions with respect to the interannual variability of flow at the annual, seasonal and daily scales (Assani et al., 201Oa, 2010b; 2011a; 2011b). The Eastern region (E), located on the south shore north of 47~, is characterized by a maritime climate, whereas the South-west region (SW), located on the north shore, is characterized by a continental climate. Finally, the South-east hydrological region (SE) is characterized by a climate that is somewhere a mix between maritime and continental, but with a heavy maritime trend. This region is located on the south shore south of 47~, and unlike the other two regions, is characterized by extensive agriculture (Table 2).
Assani et al. (201 Oa and 201 Ob) showed that streamflow IS correlated with the ENSO climate index (El Nifio/Southern Oscillation) in the Eastern region, to AO (Arctic Oscillation) in the South-east region and to AMO (Atlantic Multidecadal
Oscillation) in the South-west region: In the present study, two other indices were also correlated with streamflow characteristics, namely the Pacific Decadal Oscillation (PDO) and the North Atlantic Oscillation (NAO). The data for these five indices were extracted from the following websites:
http://www.cdc.noaa.gov/ClimateIndices/List(AMO.SOI. NIN03.4 and PDO, extracted
2006 May 15), http://www.cgd.ucar.edu/cas/jhurreIVindices.data.html (NAO, extracted 2006 May 15) and http://jisao.washington.edu/data/ao/ (AO, extracted 2006 May 15). For each index, we calculated the seasonal means (seasonal climate indices) for the following two seasons: winter (January to March) and spring (April to June).These various climate indices affect the interannual variability of winter and spring temperature and precipitation in North America, which therefore affects the five characteristics of spring heavy floods. Numerous authors have described the physical mechanisms underlying the impact of these climate indices on the interannual variability of climate and streamflow (e.g. Curtis, 2008; Enfield et al., 2001; Kingston et al., 2006; McCabe et al., 2004; Sutton and Hobson, 2005; Tootle and Piechota, 2006).
For ease of comparison of the interannual variability of the characteristics of these tributaries, a common time interval over which flows were measured was selected, from 1934 to 2004 (70-year span). Daily flow data were taken from the Environment Canada website (http://www.wsc.ec.gc.ca/hydat/H20/index f cfm?). In Quebec, the hydrologic year begins in October and ends in September. The highest flow is measured during spring snowmelt (April to June).
The procedure developed by Assani et al. (201 Ob) was used to make up the hydrologic series of spring maximum flow characteristics. This procedure is based on the ecological concept of the natural flow regime (Richter et al., 1996; Poff et al., 1997), according to which streamflow can be decomposed into five characteristics, namely magnitude, frequency, duration, timing, and variability. These five characteristics were subdivided into three categories: primary (magnitude), secondary (duration and timing) and tertiary (frequency and variability) (Assani et al., 2010b). A characteristic is secondary when it serves to define a primary characteristic (e.g., duration or timing of magnitude), and a
characteristic is tertiary (frequency, variability and distribution curve shape) when it serves to define the primary and secondary characteristics. Each characteristic may be defined by at least one hydrological variable. Assani et al. (2006a, 2006b) have shown that the number of characteristics to be defined depends on the scale of analysis (annual, seasonal, monthly, or daily) and the hydrologic series type (annual or partial). At the daily scale, these five characteristics can ooly be detined for a partial series. Definition of the five characteristics involved the following steps (Assani et al., 201Oa):
In the frrst step, we constructed a spring seasonal streamflow senes (series constructed by the highest streamflow values measured each year between April and June).
- In the second step, for each year, we selected aIl streamflow values equal to or greater than Qm, Qm being the lowest value of the seasonal series constituted in Step 1. Thus, for each year, we have at 1east one streamflow value 2:: Qm. Parallel to the streamflow magnitude series, we also constructed the series of four other characteristics, namely timing, duration, frequency and variability, this latter characteristic being defined with the coefficient of variation. The dates of occurrence of the flood were converted into Julian days (from January 01). Duration was defmed as the number of days during which streamflow magnitude remained 2:: Qm during a spring season. It is expressed as a percentage of the total number of days in the spring season. This type of transformation had no effect on the long-term trend of the hydrologic series. In fact, the original and the transformed series yielded the same results. The values of the coefficients of variation were calculated based on the flood magnitude values. Frequency was defined as the number of times streamflows
2:: Qm were measured during a spring season. Frequency data were converted to probabi1ity and expressed in percent using the following formula: FMi = Nix1 OOlNt,
where FMi is the frequency expressed in percent, Ni is the number of events 2:: Qm observed during a given year, and Nt is the total number of events 2:: Qm observed over the 1934-2004 period. An event is a flood with flows equal or greater than Qm during one or more consecutive days.
In the last step, when several floods occurred in the same season (from April to June), we calculated their average duration and timing. However, concerning the magnitude and coefficients of variation, this average was ca1culated when the streamflow 2: Qm lasted more than one day. In aIl, we constituted five series of fundamental spring flood characteristics during the period from 1934 to 2004 (Table 3).
Statistical analysis
Detection of breakpoints in a univariate series
As previously mentioned, linear regression and the Mann-Kendall test, the two methods commonly used in hydrology, are not capable of detecting the nature (abrupt or smooth), nor the exact timing (year) of changes in the mean or variance of a hydrological series. Instead, the method developed by Lombard (1987) was used.
Let Xl, ... , Xn be a sequence of independent observations, where
Xi
is the observation taken at time T=
i. These observations are supposed to be independent. One question of interest is to see whether the mean of this series has changed. If Jli refers to the theoretical mean of Xi' then a possible pattern for the mean is given by Lombard's smooth-change model, where{
e
l
(i -T )
«() -e )
I l = + 1 2 1 , r i elT
2 -T
I
e
,
if 1 5, i 5, T t; if T t< i 5, T 2; if T 2< i 5, n. (1)In other words, the mean changes gradually from BI to B2 between times
1;
and T2 • As a special case, one has the usual abrupt-change model when1;
=
1;
+
1.In order to test formally whether the mean in a series is stable, or rather follows model (1), one can use the statistical procedure introduced by Lombard (1987). To this end,
define Ri as the rank of Xi among Xl,... Xn. lntroduce the Wilcoxon score function tjJ(u) = 2u -1 and define the rank score of J( by
i E
{1
,
...
,n},
(2) where ::mo l n { •}2
2 1 -O'"~= -
l
tjJ- - tjJ n i;1 n + 1 (3)Lombard's test statistic is
(4)
where
(5)
At the 5% significance level, one concludes that the mean of the senes changes
significantly according to a pattern of type (1) whenever Sn> 0.0403. At the 10%
significânce level, the mean of the series changes significantly whenever Sn> 0.0287
(Lombard, 1987). The test is suitable for the detection of aIl kinds of patterns in
equation (1), including abrupt changes. It is also possible to test whether the variance of
the series changes by using the so-called Mood score function, namely tjJ(u )
=
(2u - 1y
.
A complete investigation of the power and robustness of Sn and of five other test
Lombard (1987) also proposed another test which allows detection of multiple changes in the mean of a hydrological series. However, because graphical analysis of the data did not reveal the presence of multiple changes in the mean values of streamflow characteristics, this test was not used. This was confirmed by separately analyzing sub-series ofthe main series (before and after the year a change took place).
Duration and frequency data were also analyzed with the classic Mann-Kendall test,
using the graphical approach proposed by Sneyers (1975). This test yielded similar results to those obtained with the Lombard method.
Detection of breakpoin ts in the dependence of a bivariate series
The copula is increasingly used in hydrology to describe the dependence between two variables to get around the limitations of conventional methods which consist in characterizing the individual behaviour of the two variables by the same parametric family of univariate distributions (e.g., De Michele and Salvadori; Favre et al., 2004; Genest and Favre, 2007; Genest et al., 2007; Grimaldi and Serinaldi, 2006; Renard and Lang, 2007; Salvadori and De Michelle, 2004; 2007). It is now well-established that the dependence in a random vector (X, Y) is contained in its corresponding copula function C. Specifically, the celebrated theorem of SkIar (1959) ensures that there exists a unique
C: [0, 1] 2 ---+ [0, 1 ]such that
p(X
~x,Y
~y)= C{p(X
~x),p(Y
~y)}.
(6) Quessyet aL (20 Il b) developed a testing procedure to identify a change in the copula (i.e. dependence structure) ofa bivariateseries(X
pY;),
...
,
(X
n,y").
The idea is based onKendall's tau, which is a nonparametric measure of dependence; see Lee (1990) for more details. Let ~:T be Kendall's tau measured for the first T observations and TT+l:n be
Kendall's tau for the remaining n - T observations. The proposed test statistic is
T(n -
t)
1~
~
1 M n=
maxl<T<n 1 T..:T - TT+l:nn"l/n
i.e. a maximum weighted difference between the Kendall tau.
Since Mn depends on the unknown distribution of the observations, the so-caIled multiplier re-sampling method is used for the computation of p-values. SpecificaIly, for n sufficiently large (n> 50), this method yields independent copies M~l) , ••. M~N) of Mn.
Then, a valid p-value for the test is given by the proportion of M~i) 's larger thanMn•
For more details, see Quessy et al. (20 Il b). Usually, one can expect that the series Xl, ... ,
Xn and YI, ... , Yn are subject to changes in the mean and / or variance foIlowing, e.g. the
smooth-change mode1 (1). If such changes are detected, the series must be stabilized in order to have (approximately) constant means and variances. The procedure is shown to be valid by Champagne et al. (2010).
Results
Detection ofbreakpoints in a univariate series
Results obtained using the Lombard method is presented in Table 4 for mean and Table 5 for variance values. Although the mean value of aIl five characteristics analyzed shows a significant change over time, this change does not affect aIl rivers. A change in magnitude was only observed for three rivers, two of these (Ouelle and Matane) being located in the Eastern hydrological region, and the third (De la Petite Nation), in the South-west region. This change consists in an increase in the magnitude of spring floods (Fig. 2). A significant change (decrease) in the mean duration of spring floods over time is observed for a single river (Eaton), located in the South-east hydrological region (Fig. 3). Six rivers show a significant change in the average date (timing) of spring flood occurrence (Fig. 4). Three of these rivers are in the South-west region, and the other three, in the Eastern region. This change corresponds to earlier spring floods over time (decrease in the mean of the dates of change). Five rivers show a change in the mean of the frequency of spring heavy floods (Fig. 5a, 5b). For aIl five rivers, this change is an increase in frequency. Three of the five rivers are located in the Eastern hydrological region, while the other two rivers are located respectively in each of the other two
reglOns. Finally, two rivers (Beaurivage and Matane) show a change in the mean coefficient of variation (CV), variability of magnitude (Fig. 6), which increases significantly in both cases.
As for variance, no change in that of the magnitude is observed (Table 5). The variance of spring flood duration for the Beaurivage and Ouelle rivers (Fig. 7) and of the timing of spring heavy floods in the Nicolet SW River decreased significantly over time (Fig. 8a). And although the variance of the frequency of spring heavy floods in four rivers (Trois-Pistoles, Rimouski, Blanche and Vermillon) also decreased significantly over time, that change did not take place synchronously in the four rivers. Finally, the variance of CV for the Du Sud River increased, while for the Blanche River, this value decreased (Fig. 8b, 8c). For none of the rivers analyzed is a change in the mean or the variance of all five characteristics observed. Four rivers (Trois-Pistoles, Rimouski, Blanche and Vermillon) show a change in mean and variance of the same characteristic, namely frequency.
Changes in mean and variance are abrupt for all rivers. The dates (timing) of these changes depend on the actual statistical variable (mean or variance) and streamflow characteristic (magnitude, duration, timing, frequency or variability). For the four rivers which show a change in the mean and variance of the same characteristic (frequency), the change in variance occurred before the change in mean for two rivers (Blanche and Vermillon), and after the change in mean for the Trois-Pistoles river. The Rimouski River is the oilly one for which changes in the mean and variance of spring flood timing is synchronous.
Of all changes in mean and variance values, the change in mean timing is the only one which is more spatially and temporally coherent. Thus, the change in mean timing took place during the second half of the 1970's for six rivers (Table 4). From a spatial standpoint, the timing of floods changed significantly in two hydrological regions, the Eastern region (3 out of 6 rivers) characterized by a maritime c1imate, and the South-west region (3 out of 5 rivers) characterized by a continental c1imate. The change
took place earlier in the latter region than in the fonner. However, in each of these two regions taken individually, the date of the change in mean timing is the same for all rivers in which this change is observed. Finally, the four rivers for which the mean and variance of frequency have changed significantly are all located north of 48~ on either shores of the St. Lawrence.
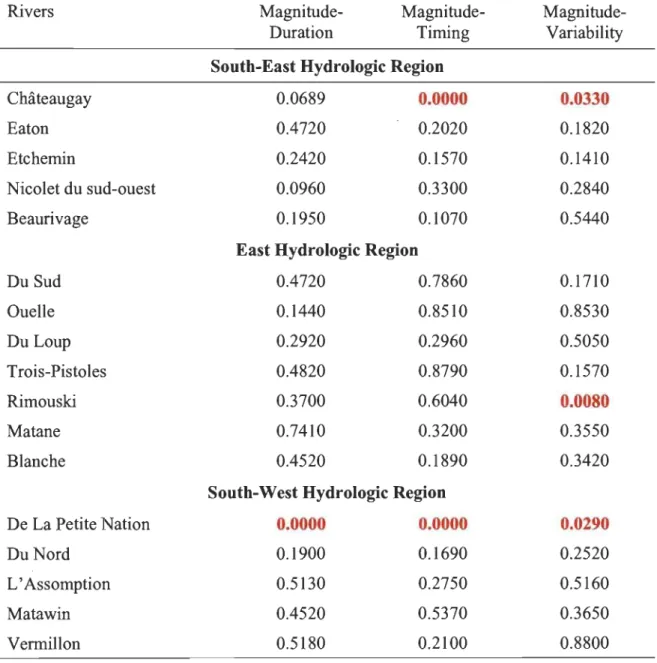
Detection of breakpoints in the dependence of a bivariate series
The dependence between the primary flood characteristic (magnitude) and other characteristics (duration, timing, frequency and variability) was the only dependence relationship analyzed. A change in the dependence between magnitude and the other three fundamental characteristics was observed for only two rivers (Châteauguay and De la Petite Nation) (Figs. 9-11 and Table 6). For the fonner, the change occurred in 1963, whereas for the De la Petite Nation River, a change in the dependence between magnitude and variability took place in 1960, and a change in the dependence between magnitude and the other two chani.cteristics (duration and timing) occurred in 1976 (Figs. 10, Il and Table 7). The Nicolet du Sud-Ouest River shows a change in the dependence between magnitude and duration, but this change, which took place in 1982, is only significant at the 10% level. Finally, for the Rimouski River, a significant (at the 1 % level) change in the dependence between magnitude and variability occurred in 1988.
Comparison of Kendall' s tau values before and after the date of a change in dependence between flood flow characteristics reveals that, for the Châteauguay River, this value increased after that date (Table 7). This means that the level of dependence or link between magnitude and the other flood characteristics increased over time. In contrast, this dependence decreased over time for De la Petite Nation River, as Kendall's tau values decrease after the date of change. For magnitude-duration and magnitude-timing, these values even become negative after the year of change, as is also the case for two other rivers, the Southwest Nicolet and the Rimouski (Table 5).
Discussion and conclusions
This is the first study to compare simultaneously the interannual variability of five fundamental characteristics of flow for 17 rivers. Sorne of its novel results are listed below.
1. Change does not affect the mean and variance of a11 five characteristics in the same way, sorne characteristics being more sensitive to change than others. In this study, a change in the mean of the date of occurrence (6 out of 17) and frequency (5 out of 17) of spring floods was observed for several rivers, whereas only one river showed a change in the mean of the duration of spring floods.
2. For the sample ofrivers analyzed, more rivers are affected by a change ofmean than by a change in variance. This result is consistent with results obtained by Villarini et al. (2011a, 2011b) for rivers in the Midwestern United States and Central Europe. This could be due to the difficulties in detecting changes in the second order statistic, for which a stronger signal would be needed or a larger sample size. However, in the Eastern United States, the proportion of rivers which show a significant change in variance is higher than that of rivers showing a significant change in mean (Villarini and Smith, 2010). For the United States, the length of the period over which streamflow was measured cannot account for this difference.
3. Timing is the only characteristic for which the change in mean shows sorne spatial and temporal coherence. Thus, the change in the mean of timing took place during the second half of the 1970's, on one hand, and was only observed in the two hydrological regions characterized respectively by a maritime climate on the south shore, North of 47'N (E), and a continental climate on the south shore (SE), on the other. Although many studies in North America have noted the early occurrence of spring floods (e.g. Bum, 2008; Cayan et al., 2001; Cunderlik and Ouarda, 2009; Déry et al., 2009; Hodgkins et al., 2003; Hodgkins and Dudley, 2006), the actual cause of this phenomenon remains unclear. Two hypotheses are commonly put forward:
Climate wanmng resulting from a C02 increase is the hypothesis most commonly mentioned. In Canada, for instance, analysis of temperature variability over the last century revealed that a significant increase took place during the 1970's (Zhang et al., 2001). However, the lack oftemperature data for many of the analyzed watersheds makes it impossible to conclusively demonstrate a link between temperature increase and the earlier occurrence of spring floods.
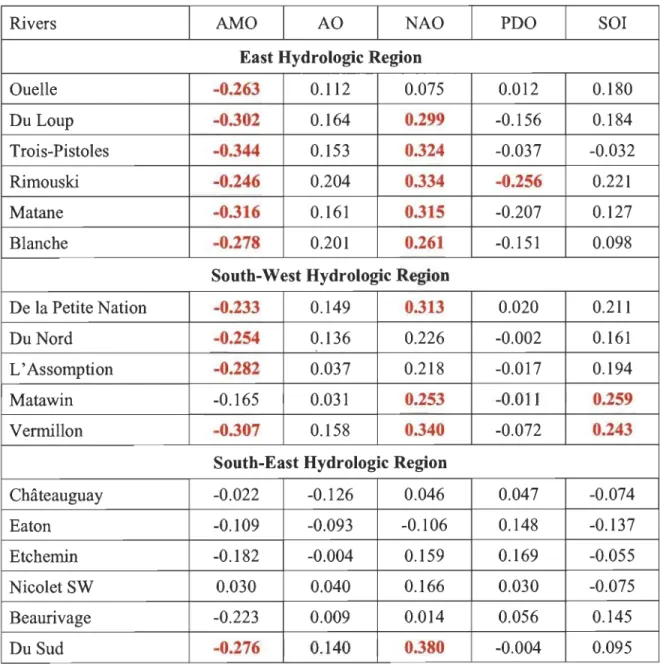
The second hypothesis relates to a change in climate oscillatîon phase (AMO,
AO, NAO, PDO and SOI). Such a change in phase affects rainfall and
temperature regimes in North America, among other places. Analysis of the correlation between timing of flood flows in rivers reveals that this characteristic is significantly correlated with AMO and NAO (Table 8) in the Eastern and South-west hydrological regions. In both cases, this correlation is negative. AMO is known to have undergone a phase change from positive to negative during the 1970's (e.g. McCabe et al., 2004), reaching maximum values around the mid-1970's. The climatic effects of this index in North America are well documented (e.g. Enfield et al., 2001; Goldenberg et al., 2001; Gray et al., 2004; McCabe et al., 2004; Sutton and Hodson, 2005). During its negative phase,
temperature is generally higher than normal in a large part of the continent, an increase which could account for earlier spring floods as a result of earlier snowmelt in the spring. As for NAO, it is positively correlated with the timing of spring floods. Kingston et al. (2006) identified two regions in North-eastern North America(including Quebec) based on the sign of the correlation between the hydroclimatic variables (temperature, precipitation and streamflow) and the NAO index: a region characterized by a negative correlation (Eastern Canada) and a region characterized by a positive correlation (Northeastern United States) between these two variables. Our study shows that in Quebec, the timing of spring flood is correlated positively to NAO. Therefore, this region behaves the same as the Northeastern United States. According·to the scheme proposed by these authors, in regions characterized by a positive correlation between NAO and hydroclimatic variables, when NAO is in positive phase (high values), an
increase in SSTs (Sea Surface Temperatures) is observed (more northerly Gulf Stream position), along with a reduced influence of the East Coast trough. As a result, the frequency of southerly airflow increases, and storm tracks coincide with the coast more often. Thus, temperature and precipitation are above average. This can lead to early snowmelt and, in tum, early spring floods.
4. IncidentaIly, the link between timing measured at different stations and climate indices suggests a spatial correlation. Douglas et al. (2000) have shown that such a spatial correlation can affect the significance of the trend. However, as previously mentioned, numerous studies have shown the early occurrence of nival spring floods in many regions of North America. Thus, this is a significant trend at the regional scale which cannot be assigned to the existence of a spatial correlation.
5. Frequency is the only characteristic for which the mean and variance changed significantly over time. This change is observed for four rivers, aIl located north of 48~. This may suggest that the interannual variability of frequency in Quebec is dependent on latitude. However, changes in mean and variance values did not take place synchronously for these four rivers.
6. The degree of dependence between flood characteristics remains constant over time for most rivers analyzed, although for sorne rivers, it decreases, while for others, it increases over time. However, given the current state of understanding, it is difficult to establish which factors account for this type of change in Quebec.
7. This study supports the conclusion by Assani et al. (201Oa) that there is currently no statistically significant generalized in the magnitude of spring flood flows in Quebec.
On the other hand, climate and hydrological models predict a decrease in the amount of snow in winter (Boyer et al. 2010). This decrease willlead to a decrease in the magnitude of spring floods, which are almost exclusively derived from melting of snow accumulated in winter. Such a decrease in the magnitude of spring flood flows has been observed in several other Canadian provinces (Cunderlik and Ouarda,
References
1. Assani AA, Chalifour A, Légaré Guillaume G, Manouane C-S, Leroux D. Temporal regionalization of 7-day low flows in the St. Lawrence watershed in Quebec (Canada). Water Resour. Manage. 2011, doi: 1O.1007/s11269-9870-6 (in press).
2. Assani AA, Landry R, Laurencelle M. Comparison of interannual variability modes and trends of seasonally precipitations and streamflow in Southern Quebec (Canada). River Res. Applic. 2011, doi: 10.1002/rra. 1544 (in press).
3. Assani AA, Stichelbout E, Roy AG, Petit F. Comparison of impacts of dams on the annual maximum flow characteristics in the three regulated hydrological regimes in Québec. Hydrol. Process 2006; 20: 3485-3501.
4. Assani AA, Tardif S, Lajoie F. Statistical analysis of factors affecting the spatial variability of annual minimum flow characteristics in a cold temperate continental region (southern Québec, Canada). J. Hydrol. 2006; 328: 753-763.
5. Assani AA, Charon S, Matteau M, Mesfioui M, Quessy J-F. Temporal variability modes of floods for catchments in the St. Lawrence watershed (Quebec, Canada). J. Hydrol. 2010; 385: 292-299.
6. Assani AA, Quessy J-F, Mesfioui M, Matteau M. An example of application: The ecological "natural flow regime" paradigm in hydroc1imatology. Adv. Water Res. 2010; 33: 537-545.
7. Boyer C, Chaumont D, Chartier l, Roy AG. Impact of c1imate change on the hydrology of St. Lawrence tributairies. J. Hydrol. 2010; 384: 65-83.
8. Bhutiyani MR, Kale VS, Pawar NJ. Changing streamflow patterns in the rivers of northwestern Himalaya: implications of global warming in the 20th century. Curr. Sci. India 2008; 95: 618-626.
9. Burn DH. Climatic influences on streamflow timing in the headwaters of the Mackenzie River Basin. J. Hydrol. 2008, 352: 225-238.
10. Bum DH, Cunderlik JM, Pietroniro A. Hydrological trends and variability in the Liard River Basin. Hydrol. Sei J 2004; 49: 53-67.
Il. Burn DH, Hag Elnur MA. Detection ofhydrologic trends and variability. J. Hydrol
2002;255,107-122. .
12. Carson EC. Temporal and seasonal trends in streamflow in the Uinta Mountains, Northeastern Utah, and relation to climatic fluctuations. Art Antarct Alp. Res. 2007; 39: 521-528.
13. Cayan DR, Kammeriener SA, Dettinger MD, Caprio JM, Peterson DR. Changes in the onset of spring in the western United States. B. Am Meteorol Soc. 2001; 82: 399-415.
14. Champagne M, Favre A-C, Quessy J-F, Saïd M. Tests of breakpoint detection in dependence structures. Working paper; 2010.
15. Cunderlik JM, Burn DH. Local and regional trends in monthly maximum flows in southern British Columbia. J. Hydro12002; 27: 191-212.
16. Cunderlik JM, Burn DH. Linkage between regional trends in monthly maximum flows and selected climatic variables. J. Hydrol. Eng 2004; 9: 246-256.
17. Cunderlik JM, Ouarda BMJ. Trend in the timing and magnitude of floods in Canada. J. Hydrol. 2009; 375,471-480.
18. Curtis S. The Atlantic multidecadal oscillation and extreme daily precipitation over the US and Mexico during the Hurricane season. Clim. Dynam. 2008; 30: 343-351.
19. De Michele C, Salvadori G. A generalized Pareto intensity-duration model of storm rainfall exploiting 2-copulas. J. Geophys. Res. 2002; 108: 1-11.
20. Déry SJ, Stahl K, Moore RD, Whitfield PH, Menounos B, Burford JE. Detection of runoff timing changes in pluvial, nival and glacial rivers of western Canada. Water Resource Res. 2009; 45: W04426, doi: 1O.1029/2008WR006975.
21. Dettinger M. Climate change, atmospheric rivers, and floods in California- A multimodel analysis of storm frequency and magnitude changes. JA WRA 2011; 47: 514-523.
22. Douglas EM, Vogel RM, Kroll, CN. Trends in floods and low flows in the United States: impact of spatial correlation. J. Hydrol. 240: 90-105.
23. Favre AC, El Adioumi S, Perrault L, Thiémonge N, Bobée B. Multivariate hydrologie al frequency analysis using copulas. Water Resource Res. 2004; 40: WOllOl, doi: 1O.1029/2003WR002456.
24. Enfield DB, Mestas-Nunez AM, Trimble PJ. The Atlantic Multidecadal Oscillation and its relationship to 'rainfall and river flows in the continental US.
Geophys Res. Lett. 2001, 28: 2077-2080.
25. Genest C, Favre A-C. Everything you always wanted to know about copula modeling but were afraid to ask. J. Hydrol. Eng. ASCE 2007; 12: 347-368.
26. Genest C, Favre A-C, Béliveau J, Jacquesw C. Metaelliptical copulas and their use in frequency analysis of multivariate hydrological data. Water Resource Res. 2007; 43: W09401, doi: 1O.1029/2006WR005275.
27. Goldenberg SB, Landsea CW, Mestas-Nuiiez AM, Gray WM. The recent increase in Atlantic hurricane activity: causes and implications. Science 2001;
293:474-479.
28. Gray ST, Graumlich IL, Betancourt IL, Pederson GT. A tree-ring based reconstruction of the Atlantic Multidecadal Oscillation since 1567 A.D. Geophys.
Res. Lett. 2004; 31: L12205, doi: 1O.1029/2004GLOI9932.
29. Grimaldi S, Serinaldi F. Asymetrie copula in multivariate flood frequency analysis. Adv. Water Resource 2006; 29: 1155-1167.
30. Hodgkins'GA, Dudley RW, Huntington TG. Changes in the timing ofhigh river flows in New England over the 20th Century. J. Hydrol 2003; 278: 244-252. 31. Hodgkins G.A., Dudley R.W. Change in the timing of winter spring stream flows
in eastem North America. 1913-2002. Geophys. Res. Lett. 2006; 33, L06402,
doi: 10.1029/2005GL025593.
32. Hannaford J, Marsh TJ. High-flow and flood trends in a network of undisturbed catchments in the UK. Int. J. Climatol. 2008; 28: 1325-1338.
33. Jiang T, Zhang Q, Blender R, Fraedrich K. Yangtze delta floods and droughts of the last millennium: abrupt changes and long term memory. Theor. Appl. Climatol. 2005; 82:131-41.
34. Kingston DG, Lawler DM, McGregor GR. Linkages between atmospheric circulation, climate and streamflow in the northem North Atlantic: research prospects. Progress Phys. Geogr. 2006; 30: 143-174.
35. Kundzewicz ZW, Graczyk D, Maureer T, Pinskwar l, Radziejewski M, Svensson
C. Trend detection in river flow series: 1. Annual maximum flow. Hydrol. Sci. J. 2005; 50:797-810.
36. Kundzewicz ZW, Hirabayashi Y, Kanae S. River floods in the changing climate observations and projections. Water Resour. Manage. 2010; doi: 10.l007/s11269-009-9571-6 (in press).
37. Leclerc M, Ouarda TBMJ. Non-stationary regional flood frequency analysis at
ungauged sites. J. Hydrol. 2007; 343: 254-265.
38. Lee J. U-statistics: Theory and Practice. CRC; 1990.
39. Lindstrom G, Bergstrom S. Runoff trend in Sweden 1987-2002. Hydrol. Sci. J. 2004; 49: 6983.
40. Lombard F. Rank tests for change point problems. Biometrika 1987; 74: 615-624.
41. McCabe GJ, Palecki MA, Betancourt IL. Pacific and Atlantic Ocean influences on
multidecadal drought frequency in the United States. Proc. Natl. Acad. Sci. USA 2004; 101 :4136-4141.
42. Petrow T, Merz B. Trends in flood magnitude, frequency and seasonality in
Germany in the period 1951-2002. J Hydro12009; 371: 129-141.
43. Poff NL, Allan ID, Bain MB, Karr IR, Prestegaard KL, Richter BD, Sparks RE,
Stromberg JC. The natural flow regime. A paradigm for river conservation and restoration. BioScience 1997; 47: 769-784.
44. Quessy IF, Favre AC, Saïd M, Champagne M. Statistical inference in
Lombard'ssmooth-change model. Environmetrics, doi: 10.1 002/env.11 08, 2011
(in press).
45. Quessy IF, Saïd M, Champagne M, Favre AC. Detection of change-points in
46. Ritcher BD, Baumgartner N, Powell J, Braun DP. A method for assessing hydrologic alteration within ecosystem. Conserv. Biol. 1996; 10: 1163-1174.
47. Robson AJ. Evidence for trends in UK flooding. Philos. Trans. R. Soc. Lond. A. 2002;360: 1327-1343.
48. Salvadori G, De Michele C. Frequency analysis via copulas: theoretical aspects and applications to hydrological events. Water Resource Res. 2004; 40: 1-17.
49. Salvadori G, De Michele C. On the use of copulas in hydrology: theory and practice. J. Hydrol. Eng 2007; 12: 369-380.
50. Sklar. Fonctions de répartition à n dimensions et leurs marges. Publications de l'Institut de statistique de l'Université de Paris 8; 1959.
51. Sneyers R. Sur l'analyse statistique des séries d'observations. OMM, Note Technique, No.143, Genève 1975; 192p.
52. St. George S. Streamflow in the Winnipeg River Basin, Canada: trends, extremes and c1imate linkages. J. Hydrol. 2007; 332: 396-411.
53. Sutton RT, Hodson LR. Atlantic forcing of North American and European summer c1imate. Science 2005; 309: 115-118.
54. Tootle GA, Piechota TC. Relationships between Pacific and Atlantic Ocean Sea surface temperature and U.S streamflow variability. Water Resource Res. 2006; 42: W07411, doi: 1O.1029/2005WR004184.
55. Villarini G, Serinaldi F, Smith JA, Krajewski WF. On the stationarity of annual floods peaks in the continental United States during the 20th century. Water Resource Res. 2009; 45: W08417, doi: 10.1029/2008WR007645.
56. Villarini G, Smith JA. Flood peak distributions for the eastem United States. Water Resource Res. 2010; 46: W06504, doi: 1O.1029/2009WR008395.
57. Villarini G, Smith JA, Serinaldi F, Ntelekos AA. Analyses of seasonal and annual maXImum daily discharge records for central Europe. J. Hydrol. 2011; 399: 299-312.
58. Villarini G, Smith JA, Baeck ML, Krajewski WF. Examining flood frequency distributions in the Midwest US. JA WRA 2011; 47: 447-463.
59. Vogel R.M, Yaindl C. and Walter M. Nonstationarity: flood magnification and recurrence reduction factors in the United States. JARWA 2011; 47:464-474. 60. Whitfteld P.H. Linked hydrologic and c1imate variations in British Columbia and
Yukon. Environmental Monitoring and Assessment J. Hydrol. 2007; 332: 396-411. 61. Whitfield PH, Cannon Al Recent variation in climate and hydrology in Canada.
Cano Water Res. J. 2000; 25: 19-65.
62. Whitfield PH, Wang JY, Cannon Al Modeling future streamflowextremes-floods and low flows in Georgia basin, British Columbia. Cano Water Res. J. 2003; 28: 633-656.
63. Zhang X, Harvey KD, Hogg WD, Yuzyk TR. Trends in Canadian streamflow. Water Resource Res. 2001; 37: 987-998.
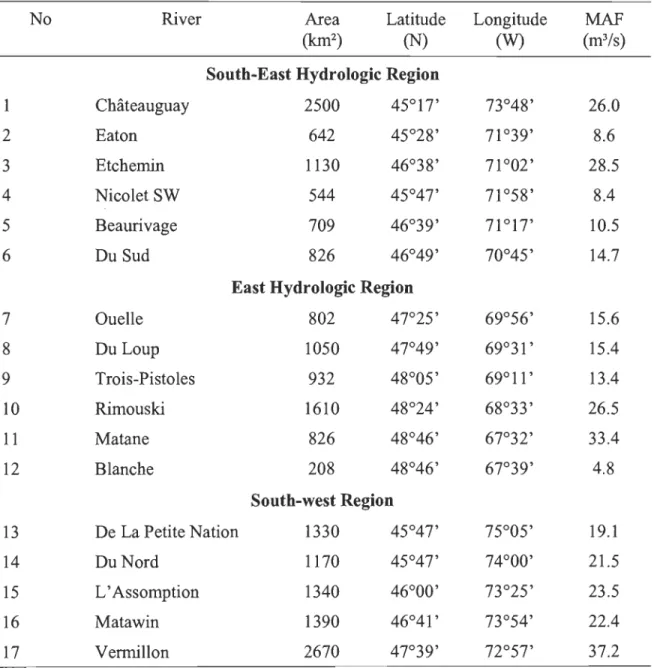
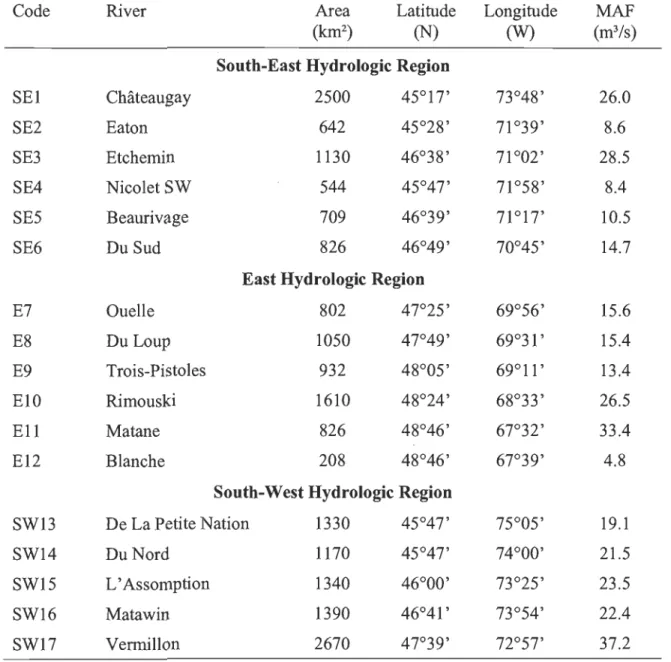
Table 1. Hydrometric stations analyzed.
No River Area Latitude Longitude MAF
(km2) (N) (W) (m3/s)
South-East Hydrologie Region
1 Châteauguay 2500 45°17' 73°48' 26.0 2 Eaton 642 45°28' 71 °39' 8.6 3 Etchemin 1130 46°38' 71 °02' 28.5 4 Nicolet SW 544 45°47' 71 °58' 8.4 5 Beaurivage 709 46°39' 71 °17' 10.5 6 Du Sud 826 46°49' 70°45' 14.7
East Hydrologie Region
7 Ouelle 802 47°25' 69°56' 15.6 8 Du Loup 1050 47°49' 69°31 ' 15.4 9 Trois-Pistoles 932 48°05' 69°11 ' 13.4 10 Rimouski 1610 48°24' 68°33' 26.5 11 Matane 826 48°46' 67°32' 33.4 12 Blanche 208 48°46' 67°39' 4.8 South-west Region 13 De La Petite Nation 1330 45°47' 75°05' 19.1 14 Du Nord 1170 45°47' 74°00' 21.5 15 L'Assomption 1340 46°00' 73°25' 23.5 16 Matawin 1390 46°41 ' 73°54' 22.4 17 Vermillon 2670 47°39' 72°57' 37.2
Table 2. Comp~rison of percent forest covers.in catchments of the three Hydrologie Regions (Assani et al., 2011b).
Region Number of rivers Mean of drainage Mean area covered area (km2) by forest (%)
South-East 6 5279 52*
East 6 893 85
South-West 5 1580 88
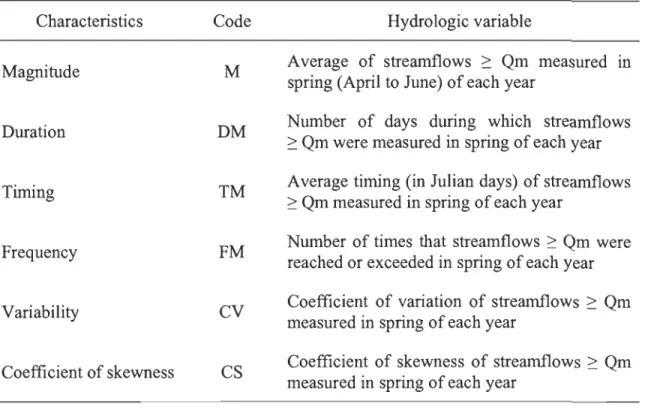
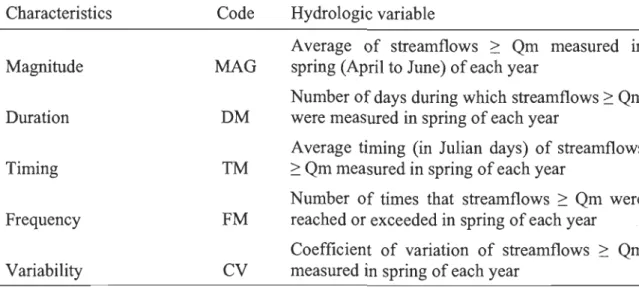
Table 3. Streamflow characteristics defined on the partial series of spring floods of the
Vermillon River (1934-2000). (Assani et al., 201Ob).
Characteristics Magnitude Duration Timing Frequency Variability Coefficient of skewness Code M DM TM FM CV CS Hydrologic variable
Average of streamflows ~ Qm measured III spring (April to June) of each year
Number of days during which streamflows
~ Qm were measured in spring of each year Average timing (in Julian days) of streamflows
~ Qm measured in spring of each year
Number of times that streamflows ~ Qm were reached or exceeded in spring of each year Coefficient of variation of streamflows ~ Qm measured in spring of each year
Coefficient of skewness of streamflows ~ Qm measured in spring of each year
River Magnitude Duration Timing Frequency Variability (CV)
Sn Tl/T2 Sn Tl/T2 Sn Tl/T2 Sn T11T2 Sn T11T2
South-East Hydrologie Region
Châteauguay 0.007 - 0.001
-
0.015 - 0.002 - 0.002 -Eaton 0.005-
0.051 1954/1955 0.003-
0.004-
0.008 -Etchemin 0.002-
0.010 - 0.006-
0.008 - 0.006 -NicoletSw 0.007-
0.034 - 0.003 - 0.066 1988/1989 0.006 -Beaurivage 0.004 - 0.005-
0.009 - 0.024-
0.008 -Du Sud 0.003 - 0.011-
0.026-
0.000-
0.009-East Hydrologie Region
Ouelle 0.106 1971/1972 0.001 - 0.019 - 0.005 - 0.019
-Du Loup 0.004-
0.004 - 0.056 1978/1979 0.021 - 0.004 -Trois-Pistoles 0.002 - 0.019 - 0.008 - 0.046 1974/1975 0.005 -Rimouski 0.001-
0.020 - 0.202 1978/1979 0.101 1962/1964 0.019 -Matane 0.066 1976/1977 0.006 - 0.068 1978/1979 0.002 - 0.068 1978/1979 Blanche 0.015 - 0.0014-
0.020-
0.047 1974/1975 0.008-South-West Hydrologie Region
De la Petite Nation 0.085 1967/1969 0.038
-
0.052 1975/1976 0.004-
0.054 1965/1966Du Nord 0.005
-
0.004 - 0.010-
0.000 - 0.004-L'Assomption 0.006
-
0.003 - 0.023-
0.000 - 0.0125-Matawin 0.038 - 0.010 - 0.122 1975/1976 0.005 - 0.031
-Vermillon 0.023 - 0.000
-
0.077 1975/1976 0.058 1967/1968 0.018-Note: Values of Sn which are statistically significant at the 5% level are shown in red boldo Tl and T2 are year's corresponding to beginning and end, respectively, of a significant change in mean.
River Magnitude Duration Timing Frequency Variability (CV)
Sn T1/T2 Sn T1/T2 Sn T1/T2 Sn Tl/T2 Sn Tl/T2
South-East Hydrologie Region
Châteauguay 0.002
-
0.011-
0.009 - 0.007-
0.016 -Eaton 0.008-
0.013-
0.011 - 0.000-
0.005 -Etchemin 0.012-
0.014 - 0.040 - 0.006 - 0.040 -Nicolet Sw 0.030-
0.011-
0.057 1958/1959 0.001 - 0.026 -Beaurivage 0.028-
0.097 1961/1962 0.014-
0.008-
0.005 -Du Sud 0.010-
0.006 - 0.016-
0.001 - 0.070 1958/1959East Hydrologie Region
Ouelle 0.006 - 0.044 1977/1978 0.008
-
0.002-
0.008-Du Loup 0.024
-
0.024 - 0.004-
0.009-
0.014 -Trois-Pistoles 0.022-
0.038-
0.007-
0.042 1980/1981 0.000 -Rimouski 0.004 - 0.003-
0.005-
0.111 1962/1963 0.027 -Matane 0.002 - 0.009-
0.006-
0.005-
0.006 -Blanche 0.028-
0.034-
0.004-
0.048 197i11972 0.083 1959/1960South-West Hydrologie Region
De la Petite Nation 0.025
-
0.000-
0.020 - 0.004-
0.016-Du Nord 0.006 - 0.006 - 0.019 - 0.001 - 0.002
-L'Assomption 0.027
-
0.003 - 0.009 - 0.000-
0.003-Matawin 0.013
-
0.000 - 0.036-
0.009 - 0.014-Vermillon 0.012 - 0.003 - 0.025
-
0.062 1935/1936 0.004-Note: Values of Sn which are statistically significant at the 5% level are shown in red boldo Tl and T2 are year's corresponding to beginning and end, respectively, of a significant change in mean.
,
Table 6. Results of the analysis of dependence between spnng maX1mum flow characteristics.
Rivers Magnitude- Magnitude-
Magnitude-Duration Timing Variability
South-East Hydrologie Region
Châteaugay 0.0689 0.0000 0.0330
Eaton 0.4720 0.2020 0.1820
Etchemin 0.2420 0.1570 0.1410
Nicolet du sud-ouest 0.0960 0.3300 0.2840
Beaurivage 0.1950 0.1070 0.5440
East Hydrologie Region
Du Sud 0.4720 0.7860 0.1710 Ouelle 0.1440 0.8510 0.8530 Du Loup 0.2920 0.2960 0.5050 Trois-Pistoles 0.4820 0.8790 0.1570 Rimouski 0.3700 0.6040 0.0080 Matane 0.7410 0.3200 0.3550 Blanche 0.4520 0.1890 0.3420
South-West Hydrologie Region
De La Petite Nation 0.0000 0.0000 0.0290
Du Nord 0.1900 0.1690 0.2520
L'Assomption 0.5130 0.2750 0.5160
Matawin 0.4520 0.5370 0.3650
Vermillon 0.5180 0.2100 0.8800
p-values calculated using the copula method. Statistically significant (at the 5% level) p-values are shown in red boldo


![[PDF] Formation détaillé sur les base de données relationnelles - Cours base de donnée](data:image/gif;base64,R0lGODlhAQABAIAAAP///wAAACH5BAEAAAAALAAAAAABAAEAAAICRAEAOw==)