HAL Id: hal-03124589
https://hal.archives-ouvertes.fr/hal-03124589
Submitted on 29 Mar 2021
HAL is a multi-disciplinary open access
archive for the deposit and dissemination of
sci-entific research documents, whether they are
pub-lished or not. The documents may come from
teaching and research institutions in France or
abroad, or from public or private research centers.
L’archive ouverte pluridisciplinaire HAL, est
destinée au dépôt et à la diffusion de documents
scientifiques de niveau recherche, publiés ou non,
émanant des établissements d’enseignement et de
recherche français ou étrangers, des laboratoires
publics ou privés.
Investigation of sidewall damage induced by reactive ion
etching on AlGaInP MESA for micro-LED application
Younes Boussadi, Nevine Rochat, Jean-Paul Barnes, Badhise Ben Bakir,
Philippe Ferrandis, Bruno Masenelli, Christophe Licitra
To cite this version:
Younes Boussadi, Nevine Rochat, Jean-Paul Barnes, Badhise Ben Bakir, Philippe Ferrandis, et al..
Investigation of sidewall damage induced by reactive ion etching on AlGaInP MESA for micro-LED
application. Journal of Luminescence, Elsevier, 2021, 234, pp.117937. �10.1016/j.jlumin.2021.117937�.
�hal-03124589�
Investigation of sidewall damage induced by reactive ion etching on
1
AlGaInP MESA for micro-LED application
2
Younes Boussadi
a, Névine Rochat
a, Jean-Paul Barnes
a, Badhise Ben Bakir
a, Philippe Ferrandis
b,
3
Bruno Masenelli
c, Christophe Licitra
a4
a
Univ. Grenoble Alpes, CEA, LETI, F-38000 Grenoble
5
b
Université de Toulon, Univ. Grenoble Alpes, CNRS, Institut Néel, 38000 Grenoble, France
6
c
Institut des Nanotechnologies de Lyon (INL-UMR5270), Université de Lyon, INSA-Lyon, ECL,
7
UCBL, CPE, CNRS, 69621 Villeurbanne, France
8
ABSTRACT
9
Previous reports have studied the impact of sidewall defects on AlGaInP micro light emitting diode (µLED) only by
10
Current-Voltage-Luminescence (I-V-L) measurements. In this work, we propose an alternative approach to investigate
11
these defects directly after MESA formation, by coupling optical characterization techniques together with Time-of-flight
12
secondary ion mass spectrometry (TOF-SIMS) on AlGaInP square shaped pixels of different sizes formed by BCl3-based
13
Reactive Ion Etching (RIE). It is found that for a 6×6 µm² pixel, the light emission homogeneity is largely impacted by
14
the sidewall defects. From emission efficiency map deduced by temperature-dependent cathodoluminescence
15
measurements, we estimate that 86% of the 6×6 µm² pixel exhibit a lower efficiency than the center. The carriers lifetime
16
extracted from time-resolved photoluminescence (TRPL) measurements on larger pixel begins to decrease gradually at 3
17
µm from the sidewall due to non-radiative recombinations. On the other hand, the TOF-SIMS analysis shows that residues
18
of boron and chlorine remain on the surface and sidewalls of the pixel after BCl3 etching. These results show the
19
importance to characterize the µLEDs at the MESA step and the necessity to optimize the etching process and the
20
passivation.
21
Keywords: µLED, micro-Photoluminescence, TRPL, Cathodoluminescence, TOF-SIMS, InGaP, AlGaInP
22
23
1. INTRODUCTION
24
Micro light emitting diodes (µLEDs) are the most promising light sources for future high luminance display application.
25
Compared to liquid crystal displays or organic light emitting diodes, µLEDs show outstanding performances in term of
26
brightness and power consumption[1], which fueled several studies demonstrating efficient III-nitride µLED devices in
27
blue and green emission. Despite the effort, III-nitride materials are still inefficient in red wavelength[2]whereas
AlGaInP-28
based macro LED internal quantum efficiency exceeds 90%[3], [4]. However, the miniaturization of these AlGaInP-based
29
LEDs, with a pitch below 10 µm, is less advanced than its III-Nitride counterpart.
30
31
In general, plasma or wet etchings are used for MESA formation in µLEDs process, and the etching is known to increase
32
surface recombinations by introducing electronic defects at the sidewalls. These defects act as non-radiative recombination
33
centers and respond to the Shockley-Read-Hall (SRH) theory[5]–[7]. At low scale, surface properties become critical and
34
the impact of these defects increases and leads to the diminution of the µLED external quantum efficiency (EQE) with
35
size shrinkage[1], [8]. AlGaInP µLEDs suffer from a higher surface recombination velocity than III-nitride µLEDs which
36
leads to a severe drop of the EQE with miniaturization[9]–[11].
37
38
Several studies have been conducted in this direction, such as Oh et al.[12] where the efficiency of red AlGaInP-based
39
µLEDs was investigated as a function of chip size with I-V-L measurements. The authors concluded that in AlGaInP
40
µLEDs, major losses come from SRH recombinations at sidewall defects. Wong et al.[9] proposed sidewall passivation
41
by atomic layer deposition of Al2O3 which improved the light output power for a 20x20 µm² device by 150 %. This
42
improvement was attributed to the reduction of non-radiative recombination sites and the enhancement in light extraction
43
efficiency but the EQE drop with miniaturization was still present.
44
Nevertheless, there is a lack of studies about the real impacted zone after MESA formation and the previous reports
45
concerning sidewall defects in µLEDs are limited only to I-V-L characterization [4], [9], [12]. These measurements take
also others parameters into account such as electric contact quality and current spreading which are also size dependent
1
[13]. In this work, we present an alternative approach to evaluate the impacted zone just after the MESA formation. By
2
coupling micro-photoluminescence (µ-PL), time-resolved photoluminescence (TRPL), cathodoluminescence (CL) and
3
TOF-SIMS characterizations on AlGaInP MESA of various sizes formed by reactive ion etching (RIE) using BCl3/Ar, we
4
show conclusive evidence of non-radiative transitions from sidewall defects and their impact at low dimension.
5
2. EXPERIMENTAL DETAILS
6
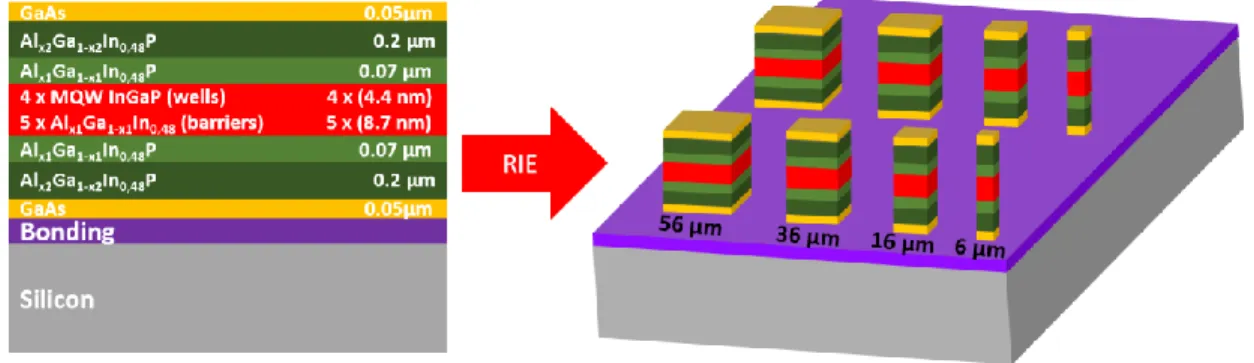
InGaP/AlGaInP red LED epitaxies grown on lattice matched GaAs substrates are used to carry out our study. The LED
7
epitaxial structure consists of an active region with five multiple quantum wells (MQW) formed by 𝐼𝑛𝐺𝑎𝑃 wells and
8
separated by 𝐴𝑙𝑥1𝐺𝑎1−𝑥1𝐼𝑛0.48𝑃 barriers. The active region is sandwiched between three undoped layers of
9
𝐴𝑙𝑥1𝐺𝑎1−𝑥1𝐼𝑛0.48𝑃, 𝐴𝑙𝑥2𝐺𝑎1−𝑥2𝐼𝑛0.48𝑃 (x2 > x1) and GaAs, respectively (Figure 1). The epitaxy is then reported on
Si-10
substrate and processed by RIE BCl3/Ar plasma etching to form square-shaped pixels (MESA) with various dimensions
11
(56×56 µm², 36×36 µm², 16×16 µm² and 6×6 µm²).
12
13
Figure 1. Schematic of the LED structure with InGaP/AlGaInP multiple quantum wells
14
µ-PL measurement and mapping were performed with a LabRAM photoluminescence setup from HORIBA. A 514 nm
15
Argon laser line was focused at normal incidence by a 100× microscope objective (NA: 0.6), with an average excitation
16
power of 5.5 mW measured at the sample and a spot size of 1 µm. PL signals from the sample were collected with the
17
same objective (excitation objective) and dispersed through a spectrometer with a focal of 800 mm by a 100 gr/mm grating.
18
The dispersed signals which form the spectrum are then detected with a CCD camera. The mapping data were acquired by
19
moving the sample using an XY stage with a step of 1 µm. The sample was loaded in a He-flow cryostat and measurements
20
were performed between 4,5 K and 296 K. Time resolved photoluminescence was used to measure the lifetime of the
21
quantum wells structures, using a 376 nm pulsed laser diode, operating at a frequency of 5 MHz, with a pulse duration of
22
50 ps. The luminescence signal was collected via a single-photon avalanche diode.
23
Cathodoluminescence mappings were performed from room temperature to 4,5 K using an Attolight CL microscope. The
24
Si substrate facilitates charge evacuation during CL measurements. The sample was excited by an electron beam with 10
25
keV acceleration voltage and a beam current between 5 and 10 nA. The luminescence was collected through an integrated
26
light microscope (NA: 0.7) embedded within the electron objective to enhance optical emission collection. By scanning
27
the sample, the optical spectra of each pixel of the SEM image are recorded on a CCD camera through a dispersive
28
spectrometer (focal length: 320 mm, grating: 150 grooves/mm).
29
Chemical composition depth profiles of our sample were determined by TOF-SIMS measurements. The apparatus is
30
equipped with a liquid Bismuth metal ion gun and a Cesium sputter source. Measurements were performed in dual beam
31
configuration, alternating analysis cycles with sputtering cycles (noninterlaced mode) with Cs ions incident sputtering at
32
45° and the Bismuth gun as the primary probe for analysis, also with an incidence of 45°. The depth resolution was between
33
2 and 5 nm.
34
3. RESULTS AND DISCUSSION
35
In order to evaluate the impact of the miniaturization on the optical properties of MQW, µ-PL integrated intensity mappings
36
were performed for several temperatures on a 6×6 µm2 LED pixel (Figure 2). In the 296 K mapping, the maximum intensity
37
is located in the middle of the pixel and decreases while approaching the edges.
1
Figure 2. µ-PL integrated intensity mappings on a 6×6 µm2 pixel. A white dashed square with the dimension of the pixel emission at
2
296 K is added on each map to compare the light emission area.
3
When the temperature is lowered, the emitted intensity becomes higher, as expected from the suppression of non-radiative
4
recombinations in the bulk and the surface[14], [15]. This increased emission of light at the edges of the MESA gives the
5
impression that the MESA size is increasing while lowering temperature (in figure 2, the emission can be compared with
6
the white dashed square which represents the emitted light at 296 K). From 60 K and below, the emission becomes also
7
more intense at the corners. We believe that it is due to an enhanced light extraction due to geometric effects. The light
8
generated and trapped in the structure due to the high refractive index contrast can escape more easily at the corners than
9
the centre of the pixel due to the angle formed by the shape of the corners[16].
10
µ-PL spectra from the center and the corner of the pixel are compared in Figure 3. At room temperature, only one peak
11
related to the radiative transition from the MQW is observed at 636 nm for the two locations. While decreasing the
12
temperature, the spectra in the two locations exhibit a similar behavior. The peak position shifts towards high energies
13
(short wavelengths) due to the band gap shrinkage with temperature[17].
14
15
Figure 3. µ-PL spectra a) at the center and b) at the corner of the 6 µm pixel
16
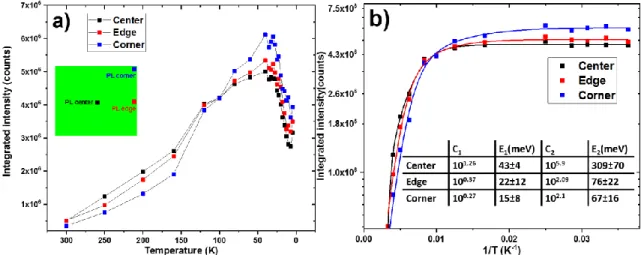
Figure 4 a) reports the evolution of the integrated PL peak intensity of Figure 3 where a third point from the edge is also
17
represented. The integrated intensity from 300 K to 100 K is higher at the center compared to the other positions, due to
non-radiative recombinations from sidewall defects. From 100 K to 4,5 K, we note that the PL emission becomes more
1
intense at the edges, especially at the corner, probably enhanced by an improved light extraction. For this temperature
2
range, small fluctuations in the PL intensity occur, particularly below 40 K where a significant drop takes place. These
3
variations have been observed in previous works[18], [19] and happen when the PL excitation is non-resonant[18]. They
4
are explained by the trapping of carriers in other layers (barriers and cladding) which then thermally escape to recombine
5
at the lower state of the quantum wells[18].
6
7
Figure 4. a) Integrated intensity as a function of temperature b) Temperature dependence of the integrated PL intensity and solid line
8
representing fits of experimental data with PL thermal quenching equation[17].
9
The Arrhenius behavior shown in the Figure 4. b) can be fitted using equation (1)[17], that describes two non-radiative
10
processes E1 and E2 for low and high temperature, respectively.
11
𝐼
𝑃𝐿(𝑇) =
𝐼0 1+𝐶1exp(−𝐸1 𝑘𝐵𝑇)+𝐶2exp(− 𝐸2 𝑘𝐵𝑇)(1)
12
IPL(T) and I0 are the PL integrated intensities at the sample temperature T and 40 K, respectively. C1, C2 are fitting constants
13
and kb is the Boltzmann constant. We did the fitting without including the drop of intensity after 40 K in order to obtain
14
the best-fit parameters.
15
In the literature, E1 represents non-radiative loss mechanism under 60 K and its nature is still unclear. Some groups describe
16
it as the thermalization of carriers from band-edge fluctuations due to alloy variation or well width fluctuation followed
17
by non-radiative recombination[15], [18] while others attribute it to non-radiative recombination channel in the wells[19],
18
[20].
19
The activation energy at high temperature (> 60K) E2 is related to the confinement of the electron-hole pair in the quantum
20
wells. In the case of AlGaInP quantum wells, Michler et al.[21] followed by others studies[15], [17], [22] consider E2 as
21
equal to one-half of the total confinement energy. For Daly and Glynn[19] and Fang et al.[20] this energy is equal to the
22
total confinement. However, for both interpretations, the major non-radiative mechanism is explained by the thermal
23
emission of carriers from the wells followed by non-radiative recombination in the barriers. In our case, at the center, E2
24
with 309 meV is in the same order of magnitude than the confinement energy in our quantum wells structure, suggesting
25
that the major losses at the center are dominated by thermal emission[19]. At the edge and the corner, E2 is much lower
26
than the confinement energy, 76 meV and 67 meV, similar to the work done by Kim et al.[17]. In this case, the major loss
27
mechanism is attributed to recombination centers in the Al-containing layer (barriers or interface) associated with Al-O
28
complexes [17], [18]. By analogy, we can conclude that a thermal emission of carriers out of the wells is excluded at the
29
edges and it is very likely that sidewall defects are responsible for non-radiative recombinations instead of native defects
30
at the well/barrier interface. However, it is not possible to clearly identify the recombination centers acting at the sidewalls
31
due to the variety of defects introduced after the etching (native oxide, dislocations, vacancies and others defects[23]).
32
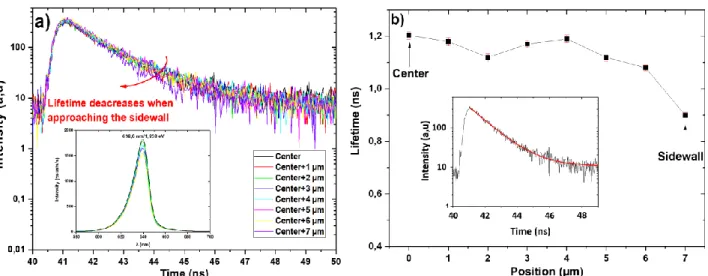
TRPL measurements were conducted as well in order to confirm the non-radiative recombination process at the sidewalls.
33
Acquisitions were carried out from the center to the sidewall of a 16×16 µm² pixel which represents the adequate size for
34
our TRPL acquisitions resolution. Figure 5 reports the results.
1
Figure 5. a) Time-resolved photoluminescence decay curves as a function of position. The inset represents the corresponding µPL
2
spectra with a peak intensity at 639.6 nm. b) Lifetime versus position. Red solid line in the inset represents the time decay fit using
3
equation (2) [24].
4
In Figure 5 a) we observed that the decay time decreases when we approach the sidewall. The PL transient curves were
5
best fit with a single exponential decay function[24] (inset in figure 5b).
6
𝐼𝑃𝐿= 𝐴𝑒
−𝜏
𝑡
(2)
7
where A is the amplitude and τ the PL lifetime. The extracted lifetime at the center is similar to those reported in previous
8
papers[24], [25]. Lifetime begins to decrease at 5 µm from the center until the sidewall. It is clear that this decrease comes
9
from the non-radiative defects, which increase the recombination velocity.[26], [27]
10
As µ-PL mapping has a low resolution at the scale of a few micrometers, we carried out cathodoluminescence
11
measurements to gain around two orders of magnitude in resolution. Figures 6 and 7 represent the CL mapping of 6×6
12
µm², 36×36 µm² and 56×56 µm² pixels.
13
14
Figure 6. Integrated CL intensity mappings at different temperatures on a 6×6 µm2 pixel. A white dashed square with the same
15
dimension of the pixel at 296 K is added for each map to compare their light emission area.
16
CL measurements exhibit the same behavior as µ-PL mapping. The intensity distribution becomes more homogenous
17
across the MESA while lowering temperature. In the 6×6 µm2, the effect of non-radiative recombinations is more visible
at edges and high temperature. It results that the LED efficiency at low dimension will be heavily impacted without proper
1
etching process and passivation. The same behavior is observed for 36×36 µm2 and 56×56 µm2 pixels but the role of
non-2
radiative recombinations from sidewall defects seems reduced at higher dimension scale (Figure 7). Due to a high surface
3
recombination velocity[10] combined with a large carrier diffusion length[12] in AlGaInP, the carrier generated in the low
4
dimension pixels can diffuse more easily to sidewall defects where they are lost, which explain why the impact is less
5
important for the larger pixels.
6
7
Figure 7. Integrated CL intensity mappings at different temperatures for 36×36 µm² and 56×56 µm² pixels
8
We conducted the CL characterization on another 6×6 µm² pixel in order to check the repeatability (Figure 8). Since the
9
CL intensity I(T) is maximum at 30 K, we calculateda map representing the emission efficiency using the ratio[14] I(296
10
K)/I(30 K). This calculation was carried out after an alignment of the images realized at 296 K and 30 K (Figure 8c).
11
12
Figure 8. (a) and (b), integrated CL intensity mappings at 296 K and 30 K, respectively. (c) emission efficiency mapping calculated
13
from the ratio I(296 K)/I(30 K)
14
Luminescence intensity profiles are then extracted along a band, which crosses the pixel by its middle (vertical red band
15
in Figure 8a) for the three maps shown in Figure 8. The intensities were normalized by the value at the center of the pixel
16
(Figure 9). By comparing the profiles at 296 K and 30 K, we deduced that the edges of the pixel are optically inactive at
17
room temperature over a large distance. This behavior is confirmed by the mapping of the ratio I(296 K)/I(30 K), where the
18
efficiency is maximum at the center and decreases by approaching the edges. From Figure 8c, an emission efficiency
19
profile was extracted along a line passing through the center of the pixel (Figure 9b). Thus, we estimated that
20
approximatively 3.4 µm (represented by the red area in Figure 9b) out of 6 µm have an efficiency lower than 80% of the
maximum value at the center. This represents 86 % of the total area of the MESA. For this calculation, the real size of the
1
pixel (5.61 µm) was used instead of the designed size (6 µm).
2
3
Figure 9. a) Normalized intensity profiles at 296 K and 30 K and b) Emission efficiency profile extracted from Figure 8c
4
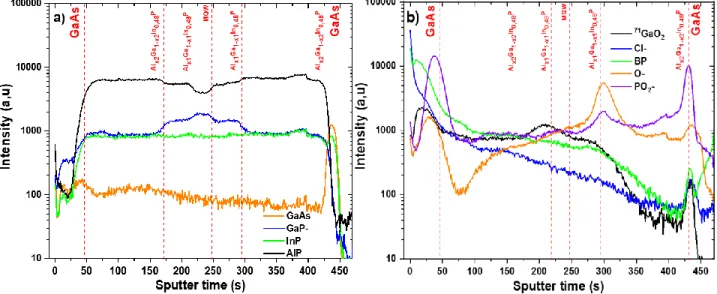
Finally, TOF-SIMS measurements were done to probe the alloy homogeneity of the epitaxial layers. Figure 10 a) represents
5
the depth profiles of constituent elements of a 6×6 µm² pixel. The presence of other unwanted elements such as native
6
oxide, chlorine and boron are shown in Figure 10 b).
7
8
Figure 10. a) TOF-SIMS profiles of constituent elements of a 6×6 µm2 pixel b) TOF-SIMS profiles of oxides and contaminants
9
(Boron contamination represented by Boron Phosphide profile)
10
11
From Figure 10 a), it results that no anomaly or alloy fluctuation appears in the different layers of our sample. However,
12
the detection of Chlorine or Boron shown in Figure 10 b) is unexpected. TOF-SIMS maps were performed to observe the
13
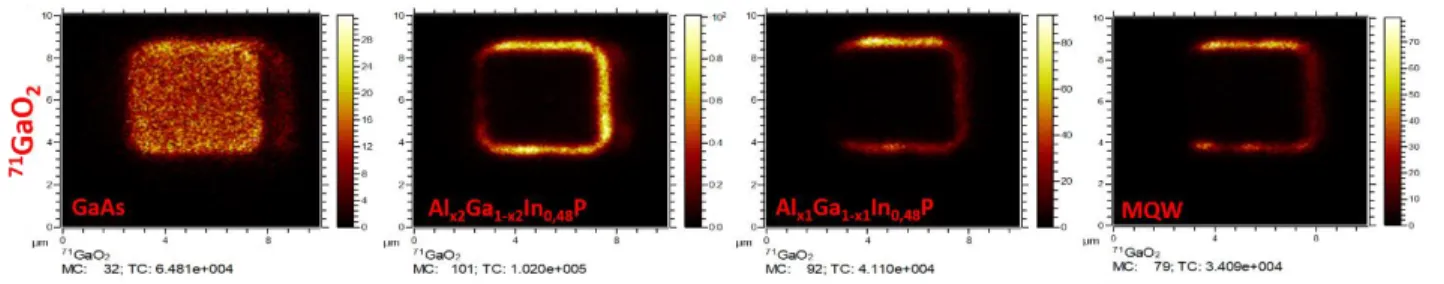
spatial distribution of the oxides and contaminants in each layer of the 6×6 µm MESA. Figure 11 represents the
TOF-14
SIMS maps of the GaO2 native oxide for different depths in the sample (note that the high signal at the right sidewall of
15
the pixel is due to shadowing effects due to the 45° incidence angle of Bi and Cs ions beams in the TOF-SIMS apparatus).
1
Figure 11 TOF-SIMS maps of native oxide (71GaO
2) for different depths positions
2
As expected, the oxidation occurred at the surface and the sidewalls of the MESA where are dangling bounds caused by
3
the breaking of crystal periodicity. An oxidation could be a source of non-radiative recombinations[28] especially in
Ⅲ-4
Ⅴ semiconductors[29][30]. Indeed, the native surface oxides are known to generate interfacial defects due to their poor
5
stability which leads to a Fermi level surface pinning by introducing surface energy levels in the band gap[30]. This would
6
be one of the causes of the luminescence quenching at pixel edges revealed by CL/PL mappings.
7
The signal intensity of Chlorine and Boron also arises from the surface and the edges of the sample (Figure 12). Their
8
presence comes certainly from the BCl3 source used during the etching process. Boron and Chlorine can also participate
9
in the carrier loss at the sidewalls of the µLED by introducing energy levels in the bandgap. On one hand, Boron can act
10
as electron compensator in InGaP with a deep mid-gap level at Ec-0.9 eV[31]. On the other hand, Chlorine acts as an
11
electron compensator in the InP system[32] but there is a lack of studies about the impact of Chlorine and Boron in the
12
InGaP/AlGaInP system[33]. Further investigations are required to unravel their effect on LED efficiency.
13
14
Figure 12 TOF-SIMS maps of Chlorine and Boron
15
These results highlight the necessity to optimize the process of MESA formation and passivation, in order to suppress the
16
EQE drop by reducing the etching-related defects. In our case, the passivation involves the removal of the native oxide
17
layer and the formation of a thin protective layer to prevent further atmospheric oxidation by using for example sulfur
18
treatment with ammonium sulfide (NH4)Sx[34], [35]. Other techniques could be used such as plasma treatment[36],
19
nitridation[37] or passivation with film deposition[38] such as ALD Al2O3 deposition[9], [29]. Finally, these results
20
demonstrate the possibility to conduct studies about etching impact or passivation treatment only at the MESA step which
21
is cost effective and easier compared to I-V-L measurement that require fully processed wafers.
22
4. CONCLUSION
23
In summary, the emission homogeneity of AlGaInP µLED epitaxy was characterized as a function of the pixel size. From
24
µ-PL mapping of a 6×6 µm² pixel, we observe that the maximum luminance is situated within the center of the pixel and
25
decreases while approaching the edges. The activation energies determined from Arrhenius plots of the PL integrated
intensity demonstrated that losses by thermal emission processes and non-radiative recombinations at sidewall defects
1
occur at the center and the edges of the pixel, respectively. The CL mappings agree with the observation from µ-PL
2
measurements and confirm that the edges are optically inactive. We have shown that the impact of etching-related sidewall
3
defects is not confined at the first nanometers but induces carrier losses in 86 % of the 6x6 µm² pixel area. Finally, the
4
TOF-SIMS analysis has shown that no anomaly or alloy fluctuation appear in the different layers of our sample but
5
revealed the presence of native oxide, Chlorine and Boron which can both introduce defect levels. These results show the
6
importance of conducting characterization at the MESA step by optimizing the etching process and the passivation.
7
Acknowledgments
8
This work was performed on the NanoCharacterisation PlatForm (PFNC) of CEA-Grenoble, and was supported by the
9
“Recherches Technologiques de Base“Program of the French Ministry of Research.
10
Appendix A.11
12
13
14
15
16
17
18
19
20
21
22
Table A-1. Peak wavelength (λpeak), Centroid wavelength (λcenter), Full width at Half Maximum (FWHM), Intengrated
23
intensity (I) of Figure 3 µ-PL spectra
24
REFERENCES
25
[1] K. Ding, V. Avrutin, N. Izyumskaya, Ü. Özgür, and H. Morkoç, ‘Micro-LEDs, a Manufacturability Perspective’,
26
Applied Sciences, vol. 9, no. 6, p. 1206, Mar. 2019, doi: 10.3390/app9061206.
27
[2] B. Mitchell, V. Dierolf, T. Gregorkiewicz, and Y. Fujiwara, ‘Perspective: Toward efficient GaN-based red light
28
emitting diodes using europium doping’, Journal of Applied Physics, vol. 123, no. 16, p. 160901, Apr. 2018, doi:
29
10.1063/1.5010762.30
T (K) Center Corner λpeak (nm) λcenter (nm) FWHM (nm) I*105 λ peak (nm) λcenter (nm) FWHM (nm) I *105 4,4 616,773 616,85 5,77 3,1 616,45 616,39 5,94 3,9 7 617,096 616,77 5,79 2,7 616,12 616,28 5,82 3,6 10 617,096 616,67 5,80 2,8 616,45 616,04 5,88 4,2 12,5 616,773 616,59 5,84 3 616,12 615,94 5,95 4,1 15 617,096 616,49 5,83 3,3 616,45 615,93 5,99 4,4 17,5 616,451 616,41 5,83 3,6 616,45 616,04 5,93 4,4 20 616,128 616,35 5,88 4E6 616,12 615,92 5,99 4,8 22,5 616,128 616,26 5,88 4,2 616,12 615,73 6,16 5,4 25 616,128 616,23 5,94 4,4 616,12 615,74 6,17 5,3 27,5 616,128 616,14 6,05 4,7 615,16 615,57 6,39 5,8 30 616,128 616,09 6,07 4,7 615,16 615,45 6,52 6,0 32,5 616,12 616,06 6,18 4,8 615,16 615,47 6,48 5,9 35 616,12 616,02 6,08 4,7 615,48 615,52 6,55 5,7 40 616,12 615,98 6,38 5 615,16 615,39 6,74 6,1 60 616,12 616,00 7,01 4,8 615,48 615,68 7,16 5,3 80 616,45 616,26 7,60 4,6 616,12 615,87 7,83 5,0 100 616,77 616,81 8,17 4,2E6 616,77 616,39 8,52 4,2 120 618,06 617,67 8,89 4 617,74 617,40 9,09 3,8 160 620,96 620,09 10,05 2,6 620,96 619,80 9,96 1,9 200 624,83 623,59 11,7 1,9 624,83 623,15 11,34 1,3 250 630,64 628,20 13,15 1,2 629,67 627,77 12,66 0,7 300 636,12 633,54 14,94 0,5 635,80 632,77 14,48 0,3[3] R.-H. Horng, H.-Y. Chien, K.-Y. Chen, W.-Y. Tseng, Y.-T. Tsai, and F.-G. Tarntair, ‘Development and
1
Fabrication of AlGaInP-Based Flip-Chip Micro-LEDs’, IEEE J. Electron Devices Soc., vol. 6, pp. 475–479, 2018,
2
doi: 10.1109/JEDS.2018.2823981.
3
[4] P. Royo, R. P. Stanley, M. Ilegems, K. Streubel, and K. H. Gulden, ‘Experimental determination of the internal
4
quantum efficiency of AlGaInP microcavity light-emitting diodes’, Journal of Applied Physics, vol. 91, no. 5, pp.
5
2563–2568, Mar. 2002, doi: 10.1063/1.1433938.
6
[5] F. Olivier, A. Daami, C. Licitra, and F. Templier, ‘Shockley-Read-Hall and Auger non-radiative recombination in
7
GaN based LEDs: A size effect study’, Appl. Phys. Lett., vol. 111, no. 2, p. 022104, Jul. 2017, doi:
8
10.1063/1.4993741.
9
[6] C. W. Kuo, Y. K. Su, H. H. Lin, and C. Y. Tsia, ‘Study and application of reactive ion etching on
10
GaInP/InGaAs/GaInP quantum-well HEMTs’, Solid-State Electronics, vol. 42, no. 11, pp. 1933–1937, Nov. 1998,
11
doi: 10.1016/S0038-1101(98)00132-4.
12
[7] D. Hwang, A. Mughal, C. D. Pynn, S. Nakamura, and S. P. DenBaars, ‘Sustained high external quantum
13
efficiency in ultrasmall blue III–nitride micro-LEDs’, Appl. Phys. Express, vol. 10, no. 3, p. 032101, Mar. 2017,
14
doi: 10.7567/APEX.10.032101.
15
[8] M. S. Wong et al., ‘Size-independent peak efficiency of III-nitride micro-light-emitting-diodes using chemical
16
treatment and sidewall passivation’, Appl. Phys. Express, vol. 12, no. 9, p. 097004, Sep. 2019, doi:
10.7567/1882-17
0786/ab3949.
18
[9] M. S. Wong et al., ‘Improved performance of AlGaInP red micro-light-emitting diodes with sidewall treatments’,
19
Opt. Express, vol. 28, no. 4, p. 5787, Feb. 2020, doi: 10.1364/OE.384127.
20
[10] M. Boroditsky et al., ‘Surface recombination measurements on III–V candidate materials for nanostructure
light-21
emitting diodes’, Journal of Applied Physics, vol. 87, no. 7, pp. 3497–3504, Apr. 2000, doi: 10.1063/1.372372.
22
[11] Y. Boussadi et al., ‘Characterization of micro-pixelated InGaP/AlGaInP quantum well structures’, in
Light-23
Emitting Devices, Materials, and Applications XXIV, San Francisco, United States, Feb. 2020, p. 70, doi:
24
10.1117/12.2544350.
25
[12] J.-T. Oh et al., ‘Light output performance of red AlGaInP-based light emitting diodes with different chip
26
geometries and structures’, Opt. Express, vol. 26, no. 9, p. 11194, Apr. 2018, doi: 10.1364/OE.26.011194.
27
[13] J. Kou et al., ‘Impact of the surface recombination on InGaN/GaN-based blue micro-light emitting diodes’, Opt.
28
Express, vol. 27, no. 12, p. A643, Jun. 2019, doi: 10.1364/OE.27.00A643.
29
[14] B. Lu et al., ‘Study on Optical Properties and Internal Quantum Efficiency Measurement of GaN-based Green
30
LEDs’, Applied Sciences, vol. 9, no. 3, p. 383, Jan. 2019, doi: 10.3390/app9030383.
31
[15] C. Y. Liu, S. Yuan, J. R. Dong, and S. J. Chua, ‘Temperature dependence of photoluminescence intensity from
32
AlGaInP/GaInP multi-quantum well laser structures’, Journal of Crystal Growth, vol. 268, no. 3–4, pp. 426–431,
33
Aug. 2004, doi: 10.1016/j.jcrysgro.2004.04.067.
34
[16] B. Sun et al., ‘Shape designing for light extraction enhancement bulk-GaN light-emitting diodes’, Journal of
35
Applied Physics, vol. 113, no. 24, p. 243104, Jun. 2013, doi: 10.1063/1.4812464.
36
[17] C. Z. Kim, J. H. Choi, K.-M. Song, C. S. Shin, C. G. Ko, and H. Kim, ‘Optical investigation of GaInP-AlGaInP
37
quantum-well layers for high-power red laser diodes’, Journal of the Korean Physical Society, vol. 62, no. 9, pp.
38
1301–1306, May 2013, doi: 10.3938/jkps.62.1301.
39
[18] A. P. Morrison et al., ‘Photoluminescence investigation of the carrier confining properties of multiquantum
40
barriers’, IEEE J. Quantum Electron., vol. 33, no. 8, pp. 1338–1344, Aug. 1997, doi: 10.1109/3.605556.
41
[19] E. M. Daly, T. J. Glynn, J. D. Lambkin, L. Considine, and S. Walsh, ‘Behavior of In 0.48 Ga 0.52 P/( Al 0.2 Ga
42
0.8 ) 0.52 In 0.48 P quantum-well luminescence as a function of temperature’, Phys. Rev. B, vol. 52, no. 7, pp.
43
4696–4699, Aug. 1995, doi: 10.1103/PhysRevB.52.4696.
44
[20] Y. Fang et al., ‘Investigation of temperature-dependent photoluminescence in multi-quantum wells’, Sci Rep, vol.
45
5, no. 1, p. 12718, Oct. 2015, doi: 10.1038/srep12718.
46
[21] P. Michler, A. Hangleiter, M. Moser, M. Geiger, and F. Scholz, ‘Influence of barrier height on carrier lifetime in
47
Ga 1 − y In y P/( Al x Ga 1 − x ) 1 − y In y P single quantum wells’, Phys. Rev. B, vol. 46, no. 11, pp. 7280–7283,
48
Sep. 1992, doi: 10.1103/PhysRevB.46.7280.
49
[22] C. Y. Liu, S. F. Yoon, J. H. Teng, J. R. Dong, and S. J. Chua, ‘Temperature and injection current dependent
50
electroluminescence study of GaInP/AlGaInP quantum well laser diode grown using tertiarybutylarsine and
51
tertiarybutylphosphine’, Appl. Phys. A, vol. 91, no. 3, pp. 435–439, Jun. 2008, doi: 10.1007/s00339-008-4419-0.
52
[23] H. F. Wong, ‘Investigation of reactive ion etching induced damage in GaAs–AlGaAs quantum well structures’, J.
53
Vac. Sci. Technol. B, vol. 6, no. 6, p. 1906, Nov. 1988, doi: 10.1116/1.584142.
54
[24] J. Dekker et al., ‘Annealing of the deep recombination center in GaInP/AlGaInP quantum wells grown by
solid-1
source molecular beam epitaxy’, Journal of Applied Physics, vol. 86, no. 7, pp. 3709–3713, Oct. 1999, doi:
2
10.1063/1.371283.
3
[25] T. Onishi et al., ‘Doping level and type of GaInP saturable absorbing layers for realizing pulsating 650-nm-band
4
AlGaInP laser diodes’, IEEE Photon. Technol. Lett., vol. 10, no. 10, pp. 1368–1370, Oct. 1998, doi:
5
10.1109/68.720263.
6
[26] S. Yu et al., ‘Influence of GaInP ordering on the performance of GaInP solar cells’, J. Semicond., vol. 37, no. 7, p.
7
073001, Jul. 2016, doi: 10.1088/1674-4926/37/7/073001.
8
[27] L. Gagliano et al., ‘Efficient Green Emission from Wurtzite Al x In 1– x P Nanowires’, Nano Lett., vol. 18, no. 6,
9
Art. no. 6, Jun. 2018, doi: 10.1021/acs.nanolett.8b00621.
10
[28] N. Xiang, A. Tukiainen, J. Dekker, J. Likonen, and M. Pessa, ‘Oxygen-related deep level defects in solid-source
11
MBE grown GaInP’, Journal of Crystal Growth, vol. 227–228, pp. 244–248, Jul. 2001, doi:
10.1016/S0022-12
0248(01)00691-1.
13
[29] P. Ferrandis et al., ‘Electrical properties of metal/Al 2 O 3 /In 0.53 Ga 0.47 As capacitors grown on InP’, Journal of
14
Applied Physics, vol. 123, no. 16, p. 161534, Apr. 2018, doi: 10.1063/1.5007920.
15
[30] L. Zhou, B. Bo, X. Yan, C. Wang, Y. Chi, and X. Yang, ‘Brief Review of Surface Passivation on III-V
16
Semiconductor’, Crystals, vol. 8, no. 5, p. 226, May 2018, doi: 10.3390/cryst8050226.
17
[31] A. Henkel, S. L. Delage, M. A. di Forte-Poisson, H. Blanck, and H. L. Hartnagel, ‘Boron Implantation into G a A
18
s / G a 0.5 I n 0.5 P Heterostructures’, Jpn. J. Appl. Phys., vol. 36, no. Part 1, No. 1A, pp. 175–180, Jan. 1997, doi:
19
10.1143/JJAP.36.175.
20
[32] J. P. Landesman et al., ‘Evidence of chlorine ion penetration in InP/InAsP quantum well structures during dry
21
etching processes and effects of induced-defects on the electronic and structural behaviour’, Microelectronics
22
Reliability, vol. 55, no. 9–10, pp. 1750–1753, Aug. 2015, doi: 10.1016/j.microrel.2015.07.029.
23
[33] A. Tukiainen, J. Likonen, L. Toikkanen, and T. Leinonen, ‘Unintentional boron contamination of MBE-grown
24
GaInP/AlGaInP quantum wells’, Journal of Crystal Growth, vol. 425, pp. 60–63, Sep. 2015, doi:
25
10.1016/j.jcrysgro.2015.02.048.
26
[34] D.-M. Geum et al., ‘Strategy toward the fabrication of ultrahigh-resolution micro-LED displays by
bonding-27
interface-engineered vertical stacking and surface passivation’, Nanoscale, p. 10.1039.C9NR04423J, 2019, doi:
28
10.1039/C9NR04423J.
29
[35] M.-J. Jeng, Y.-H. Chang, L.-B. Chang, M.-J. Huang, and J.-C. Lin, ‘Effective Suppression of Surface
30
Recombination of AlGaInP Light-Emitting Diodes by Sulfur Passivation’, Jpn. J. Appl. Phys., vol. 46, no. No. 4,
31
pp. L291–L293, Mar. 2007, doi: 10.1143/JJAP.46.L291.
32
[36] E. Polydorou et al., ‘Surface passivation effect by fluorine plasma treatment on ZnO for efficiency and lifetime
33
improvement of inverted polymer solar cells’, J. Mater. Chem. A, vol. 4, no. 30, pp. 11844–11858, 2016, doi:
34
10.1039/C6TA03594A.
35
[37] M. Losurdo, P. Capezzuto, G. Bruno, G. Perna, and V. Capozzi, ‘N2–H2 remote plasma nitridation for GaAs
36
surface passivation’, Appl. Phys. Lett., vol. 81, no. 1, pp. 16–18, Jul. 2002, doi: 10.1063/1.1490414.
37
[38] G. Dingemans, P. Engelhart, R. Seguin, M. M. Mandoc, M. C. M. van de Sanden, and W. M. M. Kessels,
38
‘Comparison between aluminum oxide surface passivation films deposited with thermal ALD, plasma ALD and
39
PECVD’, in 2010 35th IEEE Photovoltaic Specialists Conference, Honolulu, HI, USA, Jun. 2010, pp. 003118–
40
003121, doi: 10.1109/PVSC.2010.5614508.