HAL Id: hal-02063111
https://hal-amu.archives-ouvertes.fr/hal-02063111
Submitted on 10 Mar 2019
HAL is a multi-disciplinary open access archive for the deposit and dissemination of sci-entific research documents, whether they are pub-lished or not. The documents may come from teaching and research institutions in France or abroad, or from public or private research centers.
L’archive ouverte pluridisciplinaire HAL, est destinée au dépôt et à la diffusion de documents scientifiques de niveau recherche, publiés ou non, émanant des établissements d’enseignement et de recherche français ou étrangers, des laboratoires publics ou privés.
the Strait of Gibraltar in April 1998
Evgeny Dafner, Richard Sempere, Harry Bryden
To cite this version:
Evgeny Dafner, Richard Sempere, Harry Bryden. Total organic carbon distribution and budget through the Strait of Gibraltar in April 1998. Marine Chemistry, Elsevier, 2001, 73, pp.233 - 252. �hal-02063111�
rlocatermarchem
Total organic carbon distribution and budget through the Strait of
Gibraltar in April 1998
Evgeny V. Dafner
a,), Richard Sempere
´ ´
a, Harry L. Bryden
baMicrobiologie Marine CNRS( rINSU, EP2032 , UniÕersite de la Mediterranee-Campus de Luminy, Case 907, Marseille Cedex 9, France) ´ ´ b
Southampton Oceanography Centre, Empress Dock, Southampton SO14 3ZH, UK
Received 6 December 1999; received in revised form 16 October 2000; accepted 18 October 2000
Abstract
Ž .
In order to investigate total organic carbon TOC exchange through the Strait of Gibraltar, samples were taken along two
Ž . Ž .
sections from the western Gulf of Cadiz and eastern Western Alboran Sea entrances of the Strait and at the middle of the´
Strait in April 1998. TOC was measured by using a high-temperature catalytic oxidation method. The results referenced here are based on a three-layer model of water mass exchange through the Strait, which includes the Atlantic inflow, Mediterranean outflow and an interface layer in between. All layers were characterised by a decrease of TOC concentrations
from the Gulf of Cadiz to the Western Alboran Sea: from 60–79 to 59–66 mM C in the Atlantic inflow and from 40–60 to´
38–52 mM C in the Mediterranean waters, respectively. TOC concentrations in the modified North Atlantic Central Water
Ž .
varied from 43 to 55 mM C. Intermediate TOC values were measured in the interface layer 43–60 mM C . TOC concentrations increased from the middle of the Strait towards continents indicating a contribution of organic carbon of photosynthetic origin along Spain and Morocco coasts or TOC accumulation due to upwelling in the northeastern part of the Strait. Our results indicate that the short-term variability caused by the tide greatly impacts the TOC distribution, particularly
in the Gulf of Cadiz. The TOC input from the Atlantic Ocean to the Mediterranean Sea through the Strait of Gibraltar varies´
4 4 y 1Ž 12 12 y 1 .
from 0.9= 10 to 1.0 = 10 mol C s or 0.28= 10 to 0.35= 10 mol C year , respectively . This estimate suggests
that the TOC inflow and outflow through the Strait of Gibraltar are two and three orders of magnitude higher than reported via the Turkish Straits and Mediterranean River inputs. q 2001 Elsevier Science B.V. All rights reserved.
Keywords: TOC; Distribution; Balance; Apparent oxygen utilisation; The Strait of Gibraltar
1. Introduction
The exchange between the Mediterranean and Atlantic through the Strait of Gibraltar is a key issue
)Corresponding author. Present address: Center for Marine
Science, University of North Carolina at Wilmington, One Marvin K. Moss Lane, Wilmington, NC 28409, USA. Tel.: q1-910-962-2361; fax:q1-910-962-2410.
Ž .
E-mail address: [email protected] E.V. Dafner .
both for the Mediterranean environment and for global ocean circulation and climate variability ŽBryden and Kinder, 1991 . It is well known that the. Surface Atlantic Water, which flows into the Mediterranean Sea, causes an increase of
productiv-Ž
ity in the Alboran Sea Packard et al., 1988; Minas et .
al., 1991 . It has also been shown that in the Atlantic inflow concentrations of the organic forms of
nutri-Ž .
ents are higher Coste et al., 1988 and mineral
Ž .
forms of nutrients are lower McGill, 1961 than
0304-4203r01r$ - see front matter q 2001 Elsevier Science B.V. All rights reserved. Ž .
within the Mediterranean outflow. Estimates by
Ž .
Greze et al. 1985 suggest that the annual zooplank-ton inflow from the Atlantic Ocean is twice as high as its outflow from the Mediterranean Sea.
By contrast, little is known yet about the influ-ence of the Mediterranean outflow on the biogeo-chemistry of the eastern North Atlantic although the physical environment of this phenomenon has re-ceived more attention. Over the last decade, it has been found that the salinity and temperature of the
Ž
Deep Mediterranean waters have increased Bethoux
´
et al., 1990; Rohling and Bryden, 1992; Francour et .
al., 1994 . There are some simulations of an increase of its influence on the dynamic of the North Atlantic
Ž .
Ocean Rahmstorf, 1998 and on the climate, in
Ž .
general Johnson, 1997 . To predict an influence of the climate warming on the cycling of the major organic nutrients in the North Atlantic and the Mediterranean Sea, we need to know in what quan-tity these materials are exchanged between both basins.
Ž .
Polat and Tugrul 1996 estimated an organic carbon budget for the eastern part of the Mediter-ranean Sea through the Turkish Straits. In contrast,
only indirect estimates of the organic carbon budget Ž
exist for the Strait of Gibraltar Copin-Montegut,
´
.
1993 . No reports of direct observations of organic carbon distribution and exchange through the Strait of Gibraltar have been presented up to the present. In this paper, we describe the results of total organic
Ž .
carbon TOC measurements, in terms of distribution and budget, that were estimated from the samples collected during April 1998 in the Strait of Gibraltar area.
1.1. Study area
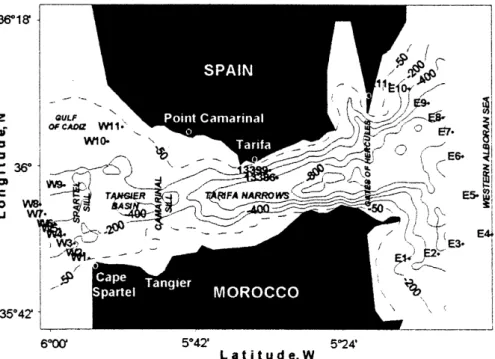
The Strait of Gibraltar is a narrow and shallow connection between the Atlantic Ocean and the
Ž .
Mediterranean Sea Fig. 1 . The Strait has an east– west orientation, a 60-km-long passage with a mini-mum width of about 12 km on the Tarifa Narrows, and an average depth of about 600 m. Thirteen kilometres westward of the Tarifa Narrows lies the main bathymetric sill of the Strait, the Camarinal sill, with a maximum depth of about 285 m and a surface
2 Ž .
of about 7.86 km Guimerans et al., 1988 . Another
Ž .
sill the Spartel sill is situated 21 km west of the
Ž .
Fig. 1. Bathymetry of the Strait of Gibraltar and stations grid during cruise 232 onboard of the RRV Discovery 12–18 April 1998 . To the east of the Strait lies the Alboran Sea, the westernmost basin of the Mediterranean Sea. To the west of the Strait lies the Gulf of Cadiz, an´
main sill and has a maximum depth of more than
Ž .
350 m La Violette and Lacombe, 1988 . Between these two sills, is the Tangier Basin, with a maxi-mum depth of approximately 640 m.
2. Materials and methods 2.1. Field sampling
Discrete seawater samples were taken from the
Ž .
RRV Discovery cruise 232 at a series of stations across the Strait of Gibraltar between 12 and 18 of
Ž . Ž .
April 1998 Fig. 1 . A CTD rosette system Seabird equipped with 10 l Niskin bottles was used. Stations were chosen to cover a variety of waters from
west-Ž .
ern Stn. W1–W11, in the Spartel sill area , and Ž
from eastern Stn. E1–E11, in the Western Alboran .
Sea entrances of the Strait, and in the middle of the
Ž .
Strait Tarifa Narrows, Stn. 13386 and 13399 . The bottles were fired at the depths of maximum or minimum distribution of temperature, salinity, oxy-gen and fluorescence, within and between different water bodies and at the interface layer between the Atlantic inflow and Mediterranean outflow. Samples were taken to within a few meters of the bottom. The positions of the stations are listed in Table 1.
Samples were not filtered and were drawn as soon as possible after the rosette sampler was on the deck
Ž
of the ship either first or immediately following the .
gas samples . The 10 ml samples were collected in
Ž .
duplicate in precombusted 4508C, at least 6 h glass
Ž w.
ampoules Wheaton . During sampling, seawater was allowed to flow directly from the Niskin stop-cock without the stopstop-cock touching the tubes, to reduce the chance of contamination. All ampoules were rinsed three times with the respective sample water before filling to appropriate volumes, poisoned
Ž y 1 .
by addition of HgCl2 10 mg l final concentration and immediately after filling the ampoules were flame-sealed and stored in the dark.
2.2. HTCO analysis
The Shimadzu instrument used in this study was the commercially available Model TOC-5000 Total Carbon Analyzer with quartz combustion column in the vertical position filled with 1.2% Pt on silica
Ž
pillows with approximate diameter of 2 mm Cauwet, .
1994 . The furnace temperature was maintained at 6808C and the effluents passed through a mercury
Ž . Ž
trap gold wire to remove mercury Ogawa and .
Ogura, 1992 . A magnesium perchlorate water trap has been added to the system located before the halogen scrubber, and an in-line membrane filter and the nondispersive infrared CO2 detector. Prior to analysis, subsamples were acidified with 10 ml of 85% H PO to a pH3 4 ; 2 and sparged for 10 min with CO -free pure air to remove inorganic carbon2 as CO . TOC contamination from the preservation2 reagent and from the phosphoric acid was below the detection limit. During the sparging procedure, we
Ž followed the recommendations of J.H. Sharp
Uni-.
versity of Delaware , i.e., care was taken such that during sparging of each sample, seawater did not overflow from the ampoules. This condition was possible at a gas flow rate of 40 ml miny 1. One hundred ml injections were repeated three to four times for each sample, the analytical precision of the procedure being within 3%, on average. Some vari-ability in values from two different vials gives rise to
Ž .
a lower overall precision 14% . Prior to analyses of standards and samples, the catalyst bed was ‘condi-tioned’ by injecting 100 ml of acidified and sparged water from a high-quality water purifier, a Millipore
w Ž .
Milli-Q Plus System hereafter, DW , until the lowest stable integrated area was obtained. To bring the blank down, the catalyst was pretreated by wash-ing in 1% HCl and gently rinsed with DW, and dried in a furnace at a temperature of about 4508C for 10–15 min. This protocol is different from that used previously, as, for example, heating the catalyst to
Ž .
5008C for 6 h in a muffle Skoog et al., 1997 .
2.3. Calibration of the instrument
Standardisation was carried out every day using
Ž .
potassium hydrogen phthalate Kanto Chemical
dis-Ž .
solved in DW 3 concentrations prepared just before sample analyses. The instrument response factor, measured as the slope of the standard addition to
Ž 2 .
DW r ) 0.999 for 19 runs , remained relatively constant and reproducible over the time of analysis. Calibration curves have exhibited little difference in
Ž
the slope ave. slope: 6045" 242 arearmM C, ns
. Ž
Table 1
Position and depth of the stations, date and time of sampling during the cruise 232 of the RRV Discovery in the Strait of Gibraltar area Ž4–22 April 1998.
N stations Station locations Depth Sampling date, Time of
Ž .m April 1998 sampling X X Ž . W1 13405 5856 W, 35848 N 128 17 16 h 17 min X X Ž . W2 13406 5857 W, 35849 N 208 14 17 h 19 min X X Ž . W3 13412 5858 W, 35851 N 356 18 12 h 03 min X X Ž . W4 13411 5859 W, 35852 N 424 18 10 h 06 min X X Ž . W5 13410 5859 W, 35854 N 126 18 09 h 04 min X X Ž . W6 13407 6800 W, 35855 N 207 17 19 h 19 min X X Ž . W7 13408 6801 W, 35856 N 274 17 20 h 27 min X X Ž . W8 13403 6801 W, 35857 N 202 16 22 h 49 min X X Ž . W9 13402 5858 W, 35859 N 172 16 21 h 20 min X X Ž . W10 13401 5855 W, 36805 N 115 16 20 h 11 min X X Ž . W11 13400 5853 W, 36804 N 82 16 19 h 05 min X X 13386 5832 W, 35858 N 668 13 14 h 45 min X X 13399 5833 W, 35859 N 557 15 01 h 00 min X X Ž . E1 13397 5816 W, 35851 N 128 13 22 h 16 min X X Ž . E2 13396 5812 W, 35851 N 437 13 20 h 55 min X X Ž . E3 13395 5809 W, 35852 N 432 13 19 h 28 min X X Ž . E4 13394 5805 W, 35854 N 457 13 17 h 59 min X X Ž . E5 13393 5807 W, 35858 N 521 13 16 h 21 min X X Ž . E6 13392 5809 W, 36801 N 562 13 14 h 38 min X X Ž . E7 13391 5810 W, 36804 N 828 13 12 h 42 min X X Ž . E8 13390 5811 W, 36806 N 797 14 10 h 46 min X X Ž . E9 13383 5814 W, 36807 N 650 12 12 h 28 min X X Ž . E10 13382 5816 W, 36809 N 357 12 10 h 30 min X X Ž . E11 13381 5818 W, 36810 N 158 12 09 h 10 min
Number of the stations in the brackets correspond to numeration of the stations in the list of the RRV Discovery.
.
units, ns19 . The bias between slopes was approxi-mately within 4%.
The accuracy and the system blank of our instru-ment were determined by analysis of the Deep
At-Ž .
lantic Water DAW reference and low carbon water ŽLCW from ampoules provided by J.H. Sharp. The.
Ž .
average dissolved organic carbon DOC concentra-tion in the DAW reference and in the LCW were 45" 1 mM C, ns19 and 3"1 mM C, ns3, respectively. Generally, there was no significant dif-ference in peak areas between DW samples and the LCW standards. Individual DW blanks were rechecked after every two to four sea sample injec-tions and were found to be about of 685" 198 area
Ž .
units, ns153. Statistical analysis ANOVA showed no difference in the peak areas between DW blanks
Ž
and LCW standards Student’s t-test was 0.13, p-. 0.05, critical value of t at ps0.05 was 4.3 . TOC concentrations in sea samples were calculated on the basis of the DW blank by averaging all replicate
injections of samples, subtracting the average DW value as the total blank and dividing by the slope of the standardisation curve. Our results in the most recent DOC method intercalibration, conducted by
Ž . Ž .
Sharp 1994 ; Sharp et al. 1995 , were in agreement Ž
with other analysts J.H. Sharp, personal communi-.
cation . Therefore, we have confidence that TOC concentrations presented in this report have been determined within an acceptable error of 3" 1 mM C.
3. Results and discussion 3.1. Hydrography
A classical model of water masses exchange through the Strait suggests that two water masses flow through the Strait: Surface Atlantic Water ŽSAW , which spreads to the Mediterranean Sea, and.
Ž y 1. Ž . Ž . Ž
Fig. 2. Typical four vertical profiles of salinity, oxygen mM kg and TOC mM C from the western Sts. W3, W4 and eastern Sts. E4, .
E7 sides of the Strait of Gibraltar. Minimum salinity from the western entrance of the Strait correspond to NACW. Minimum oxygen at Stn. E7 is characterised the residual core of LIW.
Mediterranean Water, which outflows from the Mediterranean Sea. Inflow slightly exceeds outflow to balance the net loss from the excess of evapora-tion in the Mediterranean Sea over the sum of pre-cipitation and river discharges. The interaction of these water masses produces an extremely strong
Ž .
halocline Fig. 2 , which allows identification of a Ž third, a transition or interface layer in between
Wes-.
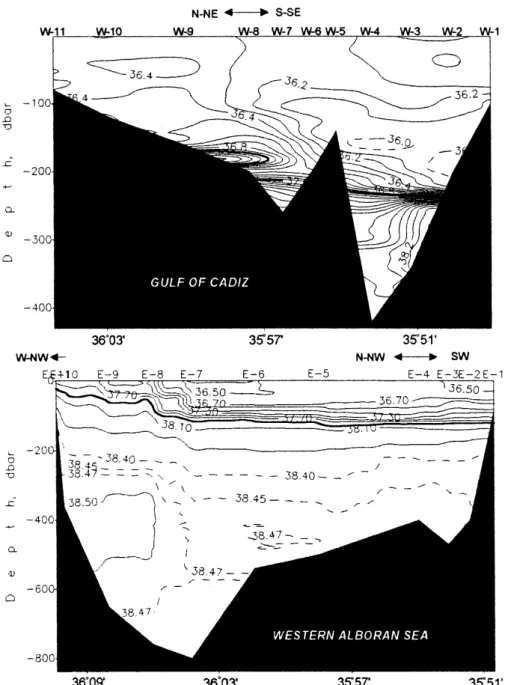
son and Gregg, 1994; Bray et al., 1995 . Tables 2 and 3 give some characteristics of the water masses found within the Strait in April of 1998, and Fig. 3 depicts distributions of salinity along both sections.
The Atlantic inflow in the Gulf of Cadiz is formed
´
Ž .
by the mixing of the SAW salinity about of 36.46 , Ž
North Atlantic Central Water NACW, salinity less .
than 36.06 , and Spanish Coastal Water with salinity
Ž . Ž .
Fig. 3. Distribution of salinity on western Gulf of Cadiz and eastern Western Alboran Sea entrances of the Strait of Gibraltar. Hereafter,´
Table 2 Characteristics of the different water bodies observed above the Spartel sill in April 1998 N stations Surface Atlantic water North Atlantic central water Interface layer Mediterranean deep water Depth, Salinity TOC, m M Depth, Salinity TOC, m M Depth, Salinity TOC, m M Depth, Salinity TOC, m M m average m average m average m average W1 0 – 101 36.38 – 36.06 60 W2 0 – 113 36.38 – 36.12 63 113 – 197 36.06 – 35.93 54 W3 0 – 226 36.42 – 36.37 61 143 – 215 36.06 – 35.96 51 226 – 249 36.37 – 38.05 50 249 – 343 38.05 – 38.37 49 W4 0 – 207 36.31 – 36.21 60 125 – 171 36.06 – 35.97 46 207 – 313 36.52 – 38.02 47 313 – 419 38.02 – 38.15 55 W5 0 – 91 36.30 – 36.18 59 93 – 115 36.06 – 35.98 50 W6 0 – 149 36.26 – 36.12 58 105 – 111 36.06 – 36.05 48 W7 0 – 173 36.24 – 36.50 61 173 – 271 36.50 – 37.99 48 W8 0 – 121 36.27 – 36.51 63 121 – 189 36.51 – 37.60 W9 0 – 137 36.40 – 36.50 62 137 – 167 36.50 – 36.85 53 W10 0 – 107 36.28 – 36.44 65 W11 0 – 177 36.35 – 36.45 63 Position of the interface layer was determined by the range of salinity between 36.50 and 38.00; modified NACW by salinity lower than 36.06. Stn. W8 was sampled only down to 51 m depth. Note that all stations were sampled during different tides.
Ž
- 36.10 Van Geen and Boyle, 1989; Van Geen et .
al., 1988, 1991 . The thickness of SAW in the Strait is highly variable and in April 1998 it decreased
Ž .
from about 100 m south of the Spartel sill Table 2 to about 40–55 m at the Tarifa Narrows and to about
Ž .
15–40 m in the Western Alboran Sea Table 3 . The interface layer is defined by a well-developed halocline with a change in salinity of about 2.00 ŽFig. 2 . For identification of the interface layer,.
Ž .
Lacombe and Richez 1982 have suggested a range of salinity values between 37.00 and 37.50. Bryden
Ž .
et al. 1989 have characterised this layer in the southern part of the Camarinal sill by a salinity range of 36.50–38.00. The interface layer was found to be deeper, thicker, fresher and colder on the west of the
Ž .
Strait Table 2 . The shallowest position of this layer was found in the Western Alboran Sea, where it
Ž .
continued to get saltier and warmer Table 3 . The Mediterranean outflow is marked by a high salinity and temperature, and is formed by the
mix-Ž .
ing of Levantine Intermediate Water LIW and
Ž .
Western Mediterranean Deep Water WMDW . The LIW originates in the Eastern Mediterranean and is characterised by an intermediate maximum in
tem-Ž . Ž .
perature about 13.158C and salinity about 38.47
ŽParrilla and Kinder, 1987 . The residual LIW is. found preferentially in the northwestern part of the Alboran Sea in a depth band of 200–600 m and is essentially absent near the African coast. As shown in Fig. 3 and Table 3, we observed the salinity values close to those listed above in April 1998 at the eastern section at Stn. E6 to E10, and at the Tarifa Narrows. WMDW is characterised by a
de-Ž
crease in salinity and temperature 38.42–38.44 and .
- 12.908C . WMDW is formed by the winter con-Ž
vection in the south of France Medoc Group, 1970; .
Stommel, 1972 . The salinity distribution in Fig. 3 demonstrates that in the Western Alboran Sea, values of salinity in the near-bottom layer were always higher than those observed for WMDW. Diluted
Ž .
WMDW salinity of about 38.45 was only found at the southern most stations E5 to E2. A similar situation, which indicates a small contribution of WMDW to the outflow, has been described
previ-Ž .
ously by Roether and Weiss 1975 , Measures and
Ž . Ž .
Edmond 1988 and Minas et al. 1991 .
The water exchange through the Strait is under Ž the influence of periodic forces, such as tides La
.
Violette and Lacombe, 1988 , and nonperiodic forces,
Ž .
such as atmospheric pressure Stanton, 1983 , wind
Table 3
Ž .
Characteristics of the different water bodies observed at the Tarifa Narrows Stn. 13386 and 13399 , and at the Western Alboran Sea in April 1998
N stations Surface Atlantic water Interface layer Mediterranean deep water
Depth, Salinity TOC, mM Depth, Salinity TOC, mM average Depth, Salinity TOC, mM
m average m average m average
13386 0–55 36.29–36.51 54 55–110 36.51–37.98 46 110–549 37.98–38.47 39 13399 0–41 36.34–36.54 61 41–100 36.54–38.00 48 100–611 38.00–38.48 41 E1 0–63 36.51–36.80 64 63–85 36.80–37.01 60 E2 0–29 36.35–36.51 63 29–127 36.51–38.01 59 127–435 38.01–38.45 47 E3 0–45 36.51–36.60 60 45–133 36.60–38.02 56 133–459 38.02–38.46 44 E4 0–31 36.50–36.60 63 31–129 36.60–38.01 55 129–451 38.01–38.46 45 E5 0–45 36.59–36.61 61 45–135 36.61–38.02 54 135–519 38.02–38.47 45 E6 0–67 36.46–36.54 54 67–113 36.54–38.01 50 113–557 38.01–38.47 41 E7 0–33 36.28–36.51 59 33–135 36.51–38.02 51 135–831 38.02–38.45 45 E8 0–17 36.96–37.10 66 17–77 37.10–38.01 52 77–789 38.01–38.46 42 E9 0–15 37.59–37.60 58 15–85 37.60–38.00 53 85–675 38.00–38.48 44 E10 0–37 37.54–38.00 65 37–135 38.00–38.40 50 135–353 38.40–38.48 46 E11 0–37 37.84–38.10 55 37–71 38.10–38.33 47 71–111 38.33–38.40 46 Ž .
Positions of the basis of SAW and the interface layer were determined by the phenomenological criteria vertical distribution of salinity individually for each station. Note that all stations were sampled during different tides.
stress over the west Mediterranean Sea and the Gulf
Ž .
of Cadiz Grundlich, 1981 , formation of the WMDW
´
¨
during the winter convection, and features of the Ž
Alboran Gyre circulation Bryden and Stommel, .
1982 . As a result, the water flow in the Strait does not move in the form of continuous currents but as tidal-induced pulses, which vary in the amount of water they contain according to the daily and monthly variation in the above-mentioned factors.
3.2. TOCÕertical distribution
All data from the Strait of Gibraltar are presented
Ž .
along two sections in Fig. 4: western Gulf of Cadiz
´
Ž .
and eastern Western Alboran Sea . Both these sec-tions have been characterised by similar features of
Ž .
TOC distribution: i a decrease of TOC content Ž . from the Gulf of Cadiz towards the Alboran Sea; ii
´
an increase of TOC concentrations in the Atlantic
Ž . Ž . Ž .
inflow from the middle of the sections towards the Ž .
continents; iii a decrease of TOC concentrations from the Atlantic inflow to the Mediterranean
out-Ž . Ž
flow, and iv a patchiness of TOC inventory mM .
C below the Atlantic inflow. This patchiness was due either to sampling during different times of the tide, particularly in the Gulf of Cadiz, or to different
´
composition of the water layers from both sides of the Strait. In the Western Alboran Sea, water column was composed only by SAW, Mediterranean waters and the interface layer in between. Figs. 2 and 3, and Table 2 show that at several stations above the
Ž .
Spartel sill Stn. W2–W6 additionally modified NACW was observed.
We summarize all measurements in one vertical
Ž .
profile Fig. 5 , which shows a large scatter of TOC
Ž .
concentrations in the upper 200 m 50–79 mM C
including SAW, NACW, interface layer and upper Mediterranean waters, and a decrease down to 38–48 mM C in deep waters. At several depths, the scatter
Ž .
is due to joining into one profile near-bottom mea-surements from the Gulf of Cadiz and pelagic obser-
´
vations from the same depth from the Western Albo-ran Sea. Some of the stations from both sides of the
Ž .
Strait W4, W5, W11 and E2, E3, E4, E5, E7, E10 were characterised by an increase of TOC
concentra-Ž
tions in the near-bottom layer Stn. W4 and E4 in .
Fig. 4 , which could be a result of bottom sediment resuspension.
3.3. TOC sources in the Atlantic inflow
The increase of TOC concentrations from the middle of the sections towards Spain and Morocco
Ž . Ž . Ž .
indicate an accumulation of organic carbon along Ž continents. Having only oxygen and fluorescence in
.
Volts data, we can only hypothesize that the sources of TOC accumulation are either production of or-ganic carbon in situ, or Atlantic inflow already en-riched in organic carbon during its flow to the Strait. In situ production can be induced by upwelling since such phenomenon, already reported between
Ž
Gibraltar and the Bay of Malaga including north-.
eastern part of the strait , may affect the northwest-Ž
ern Alboran Sea Cano, 1978; Gil and Gomiz, 1994;
. Ž .
Rodrıguez et al., 1998 . Minas et al. 1991 used
´
diagram analysis for study of water exchange through the Strait and demonstrated that in the upwelling area along the Spanish coast, nutrients are largely
transported to the photic layer. They concluded that this process is responsible for bioproductivity in-crease along the Spanish coast and for formation of the Alboran oxygen minimum. As seen from distri-bution of salinity in Fig. 3, this upwelling is found in the northern part of the eastern section between stations E11 and E8. At these stations, we did not
Ž .
observe oxygen oversaturation Fig. 6 , but we found increased TOC concentrations up to 73 mM C. This suggests that higher TOC concentrations in
proxim-Ž .
ity of Gibraltar Stn. E11–E8 were due to organic material accumulation very likely produced in the northeastern part of the strait rather than local phyto-plankton production. Fig. 6 shows also a slight oxy-gen oversaturation of the surface layer along the
Ž .
Ž .
western section up to 4% and in the southern part
Ž .
of the eastern section Stn. E1–E5, up to 5% . As indicated by Fig. 4, these areas are also characterised by high TOC concentrations that allow us to hypoth-esize on production of organic carbon by phyto-plankton.
However, Atlantic inflow may also explain some high TOC concentrations observed in the Strait. In their paper on trace metal studies in the Atlantic
Ž .
inflow, Van Geen et al. 1988 have shown that high trace-metal concentrations in the surface water of the Alboran Sea may be due to enriched Atlantic waters flowing into the Mediterranean Sea through the Gulf of Cadiz. Our recent results indicate high DOC
´
Ž .
concentrations up to 89 mM C in the Gulf of Cadiz
´
Ž .
even during the winter season Dafner et al., 1999 . This high DOC concentration level might be due to resuspension of fresh bottom fluff settled during the last productive cycle or terrestrial input. In this case, the hypothesis of TOC enrichment in the Gulf of Cadiz due to TOC-rich Atlantic waters cannot be
´
precluded.
3.4. TOC pool in the Mediterranean outflow
The origin of the Mediterranean outflow is an unresolved question among physical oceanographers. There is the evidence that at the time of our
observa-Ž .
tions, LIW contributed to the outflow Section 3.1
Ž .
although at the southern stations E2–E5 we have observed diluted WMDW with salinity values of about 38.45–38.46. According to extensive hydro-logical observations from the literature, the outflow seems to fluctuate between waters rich in LIW and waters rich in WMDW. One permanent characteristic
Ž .
of LIW is an oxygen minimum Fig. 4, Stn. E7 , which is located mainly in the northern sector of Alboran anticyclonic gyre and related to increased
Ž
productivity in the Atlantic inflow Packard et al., .
1988; Minas et al., 1991 . The upwelling in the northwestern part of the Alboran Sea and the result-ing plankton growth prove that a potential source of organic matter, which is required to sustain an en-hanced oxygen utilisation rate.
The lowest TOC concentrations observed in the Western Alboran Sea suggest that the refractory pool of organic carbon in the LIW is likely to range from 38 to 42 mM C. This estimate is slightly lower than the 44–52 mM C that was recently presented for this
Ž
water in the Catalan-Balearic Sea Doval et al.,
. Ž
1999 and the Alboran Sea Sempere et al., unpub-
´ ´
.
lished observation . The renewal time-scale of water masses, which form the Mediterranean outflow
Ž
ranges from 7–10 Andrie and Merlivat, 1988;
. Ž
Christensen et al., 1990 to 100 years Lacombe et .
al., 1981; Gascard and Richez, 1985 for the WMDW, Ž
and from 10 to 20 years for the LIW Stratford and .
Williams, 1997 . Although LIW is younger than deep oceanic waters, the TOC values reported here are close to those measured for the very old deep
Ž .
ocean waters Hansell and Carlson, 1998 . These findings argue for the participation of bacteria turnover of the organic material inside the LIW on its pathway to the Strait of Gibraltar from the
Cata-Ž .
lan-Balearic Sea. More recently, Packard et al. 1988 have emphasised that metabolic activity, bacterial biomass, and particulate organic material should be higher in the LIW of the Western Alboran Sea than farther to the east, and especially higher than in the LIW of the Balearic Sea.
High TOC concentrations within the
Mediter-Ž .
ranean outflow ca. 60 mM C were found in the Gulf of Cadiz. Figs. 2 and 4 and show that at Stn.
´
W4, TOC concentrations increased from 51 mM C at the depth of 325 m to 60 mM C in the near-bottom
Ž . Ž .
layer 415 m . Armi and Farmer 1989 have ob-served that the Tangier basin acts as a reservoir of the Mediterranean waters that fills and drains on each tidal cycle. Acoustic Doppler Current Profiler data from our cruise have shown that different layers of the Mediterranean waters in this basin could flow to the west as well as to the east, depending on the
Ž
tide A. Benabdeljelil, personal communication, .
1998 . This feature suggests that before overflowing through the Spartel sill, the Mediterranean outflow could delay for some time within the Tangier basin. As a working hypothesis, we assume that enrichment of the Mediterranean outflow by organic carbon in this basin occurs either via resuspension of bottom sediments or via input of particulate organic carbon from SAW and its deeper resuspension. To check this hypothesis, additional research in the Tangier basin is required.
3.5. TOCÕs. salinity relationship
The analysis presented in Section 3.2 does not take explicit account of tidal variability in exchange
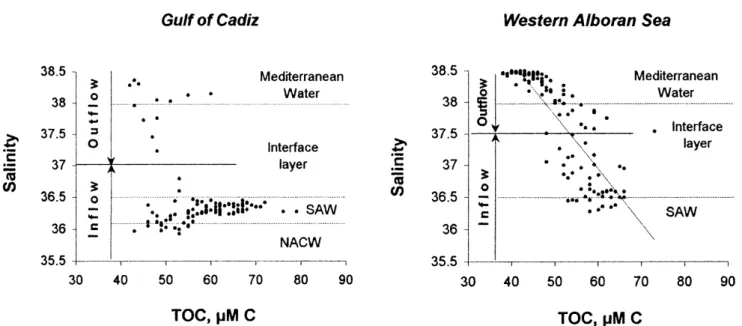
Fig. 7. Scatter plot of TOC concentrations vs. salinity. In the Gulf of Cadiz and at Tarifa Narrows, strong Atlantic inflow is marked by´
salinity lower than 36.50, Mediterranean outflow is traced by salinity greater than 38.00 and intermediate salinities depict interface between two layers for which substantial periods of both inflow and outflow. The 37.00 isohaline approximated an average position of the interface
Ž .
layer above the Spartel sill, after Bryden et al., 1989 . In the Western Alboran Sea, the average location of interface layer is shown by the
Ž 2 .
isohaline 37.50. The equation of the regression line in the Western Alboran Sea is ysy 0.085xq42.04 r s0.69, ns120 .
through the Strait. Most of the outflow occurs in bursts during the semidiurnal tide cycle: when the
outflowing tide is strongest, the interface is relatively shallow, so there is a thick layer of the
Mediter-Table 4
Comparison of the slopes of DOC vs. AOU relationship by historical data
Slope Location Reference
Ž .
y 0.77 Marine organic matter Redfield et al. 1963
Ž .
y 0.80 NW Pacific Sugimura and Suzuki 1988
Ž .
y 1.00 Surface Druffel et al. 1989
y 0.21 Deep Water, N Pacific
Ž .
y 0.062 NW Indian Ocean Kumar et al. 1990
Ž .
y 0.24 Sargasso Sea Bauer et al. 1990
Ž .
y 1.58 Surface Tanoue 1992
y 1.08
y 0.017 Deep water, N Pacific y 0.047
Ž .
y 0.21 N Atlantic Ocean Kepkay and Wells 1992
y 0.25
Ž .
y 0.56 N Atlantic Peltzer et al. unpublished ,
Ž . cited by Kepkay and Wells 1992
Ž .
y 0.43 N Atlantic Ocean De Baar et al. 1993
Ž .
y 0.14 Equatorial Atlantic Ocean Thomas et al. 1995
y 0.09
Ž .
y 0.074 Surface Peltzer and Hayward 1996
0.04 Deep water, Equatorial Pacific
Ž . y 0.084 Indian sector of the Southern Ocean Wiebinga and De Baar 1998
Ž . y 0.26 Pacific sector of the Southern Ocean Doval and Hansell 2000 y 0.23 Central Indian Ocean
ranean waters flowing swiftly over the Camarinal sill. Conversely, on the inflowing tide, the interface is relatively deep, so there is a thick layer of Atlantic water flowing swiftly into the Mediterranean. Such bursts account for more than half of the exchange across the sill between the Atlantic and
Mediter-Ž
ranean basins Bryden et al., 1989; Bray et al., .
1995 .
To remove discrepancies caused by the tide fluc-tuations, a relationship between TOC and salinity was developed. Fig. 7 shows several features of this TOC vs. salinity relationship. Firstly, in the Atlantic inflow and Mediterranean outflow, the salinity val-ues were higher in the Western Alboran Sea than in
the Gulf of Cadiz. Secondly, a larger scatter of TOC
´
and salinity values was found in the Gulf of Cadiz
´
than in the Western Alboran Sea. According to
Ž .
Bryden et al. 1989 , east of the Camarinal sill salinities lower than 36.50 indicate a strong inflow. This layer is characterised by the largest scatter of
Ž .
TOC concentrations 48–79 mM C . Note that modi-fied NACW was found between SAW and the
inter-Ž .
face layer or within SAW Fig. 2, Table 2 . This water mass is usually observed only above the Spar-tel sill and is not involved in water mass exchange through the Strait of Gibraltar, but NACW influences the properties of underlying and overlaying waters
Ž .
due to entrainment Price et al., 1993 . TOC
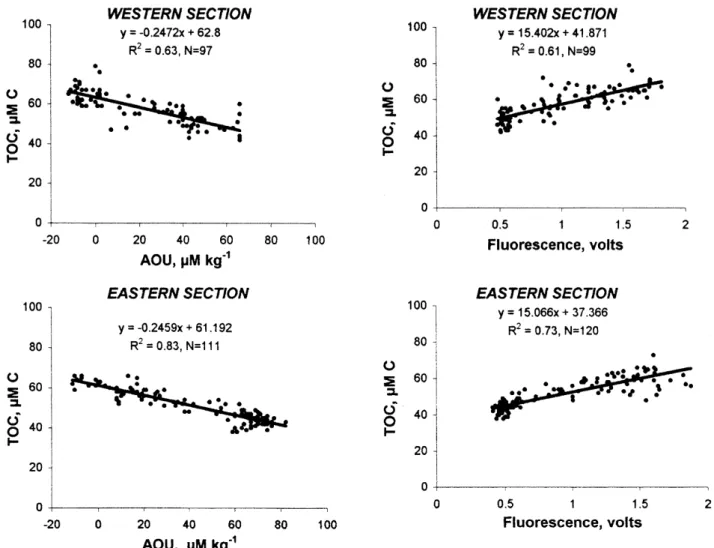
concen-Fig. 8. Composite of TOC vs. AOU, TOC vs. fluorescence, and AOU vs. fluorescence for the western and eastern entrances of the Strait of Gibraltar.
Ž . Fig. 8 continued .
trations in modified NACW ranged from 43 to 55 mM C. In the Western Alboran Sea side, where the
Ž .
Atlantic inflow gets saltier ) 36.50 and thicker Ždown to 15–40 m, Table 3 , we observed a lower.
Ž .
scatter of both parameters Fig. 7 ; consequently, the Ž 2
TOC pool correlates with salinity r s0.69, ns .
120 .
For the Mediterranean waters with salinities greater than 38.00, there is strong outflow. Indeed,
Ž
the lowest TOC content was found there 42–60 mM C from the Atlantic Ocean and 38–52 mM C from
.
the Mediterranean Sea sides . For intermediate salini-ties, there are substantial periods of both inflow and outflow. This transition zone shows a coincidence of intermediate values of salinity as well as TOC. An average inflow is marked by a salinity lower than 37.00 along the western section and about 37.50 along the eastern section. The transition between
inflow and outflow occurs, on average, at a salinity
Ž .
of 37.00 and 37.50, respectively Fig. 7 .
3.6. Relationships of TOCÕs. AOU, TOC Õs. fluores-cence and AOU Õs. fluorescence
Recent studies have shown an inverse relation Ž between DOC and apparent oxygen utilisation AOU,
.
Table 4 , since both DOC and oxygen are used by bacteria, which in turn produce CO through respira-2
Ž .
tion. In contrast, Martin and Fitzwater 1992 and
Ž .
Hansell et al. 1993 have reported weak or insignifi-cant correlation between DOC and AOU. Our obser-vations, pooling Atlantic inflow and Mediterranean outflow together, show the former correlation. Fig. 8 shows plots of TOC vs. AOU, AOU vs. fluorescence Žin Volts , and TOC vs. fluorescence from the east-. ern and western entrances of the Strait. The slopes and intersects of lines drawn through the data points
Ž .
of TOC vs. AOU Fig. 8 and TOC vs. fluorescence ŽFig. 8 at both sections are quite similar and the. differences in correlation, presumably, are due to the different number of observations.
In the Western Alboran Sea, TOC exhibits a Ž positive linear correlation with fluorescence Fig. 8;
.
rs0.73, ns120 and increased fluorescence values Ž in the SAW are inversely related to AOU Fig. 8;
.
rs0.79, ns120 . In the Gulf of Cadiz, the rela-
´
tionship of AOU vs. fluorescence, by contrast,
ex-Ž .
hibits a great scatter Fig. 8 , but the TOC vs.
Ž .
fluorescence relationship is still significant Fig. 8 . A simple comparison between AOU and
fluores-Ž .
cence from both sections Fig. 8 suggests that vari-ability of fluorescence values in the Gulf of Cadiz
´
was lower than in the Eastern Alboran Sea. Large fluorescence scatter from the eastern entrance of the
Ž
Strait is due primarily to deeper sampling down to 800 m to the east and down to 340 m to the west of
.
the Strait that explains the scatter of low
fluores-Ž .
cence values ; 0.5 V . Secondly, in the Eastern Alboran Sea, higher photosynthetic activities could
Ž explain the scatter of high fluorescence values ) 1.5
.
V . SAW is almost always easily discernible in the Gulf of Cadiz and in the Alboran Sea in satellite
´
Ž
images of chlorophyll a distribution Minas and Mi-.
nas, 1993a,b; Antoine et al., 1995 .
Historical data on the DOC vs. AOU relationship, summarised in Table 4, suggest a large variability of
the slope in different areas of the ocean. One of the problems comparing the historical data in Table 4 is
Ž .
that prior to Peltzer and Hayward 1996 all authors used a model I regression causing a negative bias in their slopes in addition to the natural variability. Since then, most authors have used the geometric
Ž .
mean regression a model II regression . Thus, some of the scatter in the numbers shown in Table 4 is due to the different statistical treatment and we cannot make corrections without the original data.
The major difficulty in interpretation of the rela-tionship of TOC vs. AOU arises from an estimate of the preformed TOC concentrations, while the pre-formed AOU is at equilibrium with the atmosphere ŽToggweiler, 1989, 1992 . Tanoue 1992 have shown. Ž . that a single linear regression analysis throughout the entire water column was inappropriate for estima-tions of the contribution of DOC to the utilisation of oxygen in the water column. In general, correlation was found when subsurface and intermediate levels are considered separately, i.e., variations of both
Ž .
AOU and probably DOC were as much due to a Ž
mixing as to biogeochemical processes Thomas et .
al., 1995 .
From both sides of the Strait of Gibraltar, we have obtained similar correlations and slopes throughout the entire water column, which lay ap-proximately in middle of the range presented in Table 4. The inverse relationship from the Strait of Gibraltar was linear and the slope of y 0.25 was lower than the y 0.77 reported by Redfield et al. Ž1963 for organic matter of average marine compo-. sition. From only the vertical profile of both property distributions, it is impossible to conclude if these correlations are due to DOC consumption by bacteria or mixing. To evaluate the contribution of TOC to AOU, an analysis of both these properties along
Ž
isopycnal surfaces is needed Doval and Hansell, .
2000 , which we could not perform in this work due to a poor spatial resolution of sampling and a large variability of the dynamical environments. Theoreti-cally, the slope, which we found in the Strait of Gibraltar area, suggests that bacterial remineraliza-tion of organic matter accounts for approximately one-third of the oxygen deficit in surface and deep waters. This value is higher than that reported by
Ž .
Ogawa and Ogura 1992 for the Northwestern
Pa-Ž .
cific, by Peltzer and Hayward 1996 for the
equato-Ž .
rial Pacific and by Wiebinga and De Baar 1998 for the Indian sector of the Southern Ocean.
3.7. Organic carbon exchange through the Strait of Gibraltar
Because of the great variability of the dynamic environment, it is difficult to assign from direct observations mean values of typical water transports for a TOC balance computation. Lacombe and Richez Ž1982 have pointed out that with the complex spa-. tial and temporal variations of the flow, only approx-imate values of transport are available. Bryden and
Ž .
Kinder 1988 , reviewing historical balance estima-tions, have concluded that the flows through the Strait are apparently limited 1 to 2= 106 m3 sy 1.
The new transports through the Strait of Gibraltar are 30% smaller than historical estimates and, further-more, tidal oscillations contribute nearly half of the
Ž .
total transport Bryden and Kinder, 1991 . Conse-quently, for a TOC pool budget calculation, we cannot use general schemes of organic carbon
esti-Ž
mation as designed for the open ocean e.g., Walsh .
et al., 1992; Peltzer and Hayward, 1996 .
Here, we present a TOC budget, which was calcu-lated according to the water transport estimates based
Ž
on the data of Gibraltar experiment Bryden et al., .
1994; Bray et al., 1995 and CANIGO observations summarised in Fig. 9. The estimate of the TOC transport was made by simply dividing the interface
Ž
layer according to the salinity values 37.00 and 37.50 from western and eastern entrances of the
.
Strait, respectively and incorporating the upper part
Ž .
of the interface into the upper layer Atlantic inflow Ž
and the lower part into the lower layer Mediter-.
ranean outflow . TOC transport in the Atlantic in-flow and Mediterranean outin-flow was calculated as the product of the water transport and the average TOC concentration in each water layer along western and eastern sections and at Tarifa Narrows.
Fig. 9 shows that TOC transport through the Strait varies from 3.7= 104 to 4.8= 104 mol C sy 1 for
the Atlantic inflow and from 2.8= 104 to 3.8= 104
mol C sy 1 for the Mediterranean outflow. Differ-ences of TOC transport between Atlantic inflow and Mediterranean outflow give an estimate of TOC balance over the water column, which are in the
4 4 y 1 Ž
Fig. 9. Two layers model of water masses exchange through the Strait of Gibraltar with average values of salinity, mass transports in the
Ž .
Atlantic inflow and Mediterranean outflow based on the data of the Gibraltar experiment Bryden et al., 1994; Bray et al., 1995 and CANIGO observations. These values of mass transport and average TOC concentration in each water layer were used for calculations of
Ž . Ž .
TOC transports lower panel and balances upper panel along the Strait.
0.28= 1012 to 0.35= 1012 mol C yeary 1,
respec-.
tively . The TOC balance is a function of water transport and TOC concentration. For example, from both entrances of the Strait, similar average TOC concentrations in the Atlantic inflow as well as in the
Ž
Mediterranean outflow 59 and 45–46 mM C, re-.
spectively were observed, but different estimates of
Ž .
water transport were used Fig. 9 . By contrast, at Tarifa Narrows, the water transports in Atlantic
in-Ž flow and Mediterranean outflow were similar 0.7
. Ž
Sv but concentrations of TOC were different 53 .
and 40 mM C, respectively and, consequently, dif-ferent balance estimates were obtained.
Several authors have evaluated the budget of dis-solved organic nitrogen and phosphorus through the
Ž
Strait Bethoux and Copin-Montegut, 1986; Coste et
´
´
.
al., 1988 ; they have found that inflow of these organic compounds exceeded their outflow from the Mediterranean Sea. Our data together with results quoted above indicate that inflow of organic material to the Mediterranean Sea through the Strait of Gibraltar is considerably higher than outflow. We
think that this feature is mostly due to the high biological productivity of the Gulf of Cadiz, where
´
Ž .
we observed high DOC concentrations 89 mM C
Ž .
even in the winter season Dafner et al., 1999 . An indirect estimate of the organic carbon budget through the Strait of Gibraltar was also recently
Ž .
evaluated by Copin-Montegut 1993 . She presented
´
a value as high as 1.25= 1012 mol C yeary 1, that is,
threefold to fourfold higher than our estimates. Polat
Ž .
and Tugrul 1996 have obtained a value of 1.79=
4 y 1 Ž 10 y 1.
10 tons C year or 0.15= 10 mol C year for organic carbon export from the Marmara to the Aegean Sea and about of 0.41= 104 tons C yeary 1
Ž0.34= 10 mol C year9 y 1.for the outflow from the
Aegean Sea to the Marmara Sea. River TOC inputs have been estimated to 20–83= 1010 mol C year1
ŽSempere et al., 1999 and references therein . These
´ ´
. data indicate that TOC inflow through the Strait of Gibraltar is two orders of magnitude higher than through the Turkish Straits and than Mediterranean River inputs. The Mediterranean outflow through the Strait of Gibraltar is also higher by three orders ofmagnitude than through the Turkish Straits. It is likely that these budgets are reflections of the pro-ductivity of the seas adjoining to the straits—the mesotrophic Alboran Sea to the east from the Strait of Gibraltar, and the oligotrophic Aegean Sea to the west from the Turkish Straits.
4. Conclusions
TOC concentrations found in the surface layer of the Strait of Gibraltar area are in agreement with those previously reported for the Atlantic Ocean and
Ž .
Mediterranean Sea ca. 60–70 mM C . Our estimates of the TOC pool in the deep waters of the Western
Ž .
Alboran Sea 38–52 mM C differ slightly from those published recently for the Mediterranean Sea, suggesting on a participation of bacteria on turnover of the organic material inside the LIW on its way to the Strait of Gibraltar. The correlation between TOC and salinity was found in the Western Alboran Sea Žrs0.69, ns120 where the water column was. characterised by a thicker layer of SAW and by a thinner layer of the Mediterranean waters. In the Gulf of Cadiz, the water column was under the
´
influence of the short-term variability caused by tides, SAW was thicker, Mediterranean waters was thinner and an additional water body was found Žmodified NACW . Accordingly, this relationship. was characterised by a large bias. The correlations between TOC and AOU, and TOC and fluorescence over the entire water column are observed. These correlations are due to the decrease of both proper-ties with depth rather than biological processes.
For calculation of the TOC transport, the two-layer model of water mass exchange through that Strait was used. Estimates of the TOC budget ranged from 0.28= 1012 to 0.35= 1012 mol C yeary 1. Our
com-putations of the TOC budget suggest that TOC in-flow is two-and outin-flow is three orders of magnitude higher through the Strait of Gibraltar then via the Turkish Straits. The amount of TOC transporting throughout the Strait of Gibraltar show that the TOC flux by Atlantic inflow and the Mediterranean out-flow cannot be ignored in the modelling of carbon cycle in the Mediterranean Sea and the eastern North Atlantic Ocean.
Acknowledgements
We thank the crew of the RRV Discovery for help and support. We acknowledge R. Boscolo and E. Oikonomou for allowing us to use their unpublished data for oxygen. Our special thanks go to J.H. Sharp, who kindly provided the Deep Atlantic and low carbon water reference standards. We thank P.J. Wangersky, D.A. Hansell and G. Cauwet for critical reading and constructive comments on the develop-ment of the manuscript. This research was funded by the European Commission, MAST III Programme ŽContract MAS3-CT96-0060 . Financial support for. E.V. Dafner came from Ministere Affaires Etrangeres
`
Francais and Conseil General des Bouches du Rhone,
´ ´
ˆ
France. Some of the ideas presented here reflect discussions held at several CANIGO Workshops.
References
Andrie, C., Merlivat, L., 1988. Tritium in the western Mediter-ranean Sea during 1981 Phycemed cruise. Deep-Sea Res. 35, 247–267.
Antoine, D., Morel, A., Andre, J.M., 1995. Algal pigment distri-´
bution and primary production in the eastern Mediterranean as derived from coastal zone colour scanner observations. J.
Ž .
Geophys. Res. 100 C8 , 16193–16209.
Armi, L., Farmer, D.M., 1989. The exchange flow in the Strait of Gibraltar. In: Almazan, J.L., Bryden, H., Kinder, T., Parilla,
Ž .
G. Eds. , Seminario Sobre la Oceanografia Fisica del Estre-chode Gibraltar, Madrid, 24–28 Octobre 1988, SECEG, Madrid. pp. 366–374.
Bauer, J.E., Williams, P.M., Druffel, E.R.M., Suzuki, Y., 1990. Deep profiles of dissolved organic carbon in the Sargasso Sea. Eos Trans., AGU 71, 154.
Bethoux, P., Copin-Montegut, G., 1986. Biological fixation of´ ´
atmospheric nitrogen in the Mediterranean Sea. Limnol. Ž .
Oceanogr. 31 6 , 1353–1358.
Bethoux, J.P., Gentili, B., Raunet, J., Taillez, D., 1990. Warming´
trend in the Western Mediterranean deep water. Nature ŽLondon 347, 660–662..
Bray, N.A., Ochoa, J., Kinder, T.N., 1995. The role of the interface in exchange through the Strait of Gibraltar. J.
Geo-Ž .
phys. Res. 100 C6 , 10755–10776.
Bryden, H.L., Kinder, T.N., 1988. Gibraltar experiment: a plan for dynamic and kinematic investigations of strait mixing, ex-change and turbulence. Oceanol. Acta SP, 29–40.
Bryden, H.L., Kinder, T.H., 1991. Recent progress in strait dy-namics. Rev. Geophys. 617–631, April 1991, Suppl. Bryden, H.L., Stommel, H.M., 1982. Origins of the Mediterranean
Bryden, H.L., Brady, E.C., Pillsbury, R.D., 1989. Flow through the Strait of Gibraltar. In: Almazan, J.L., Bryden, H., Kinder,
Ž .
T., Parilla, G. Eds. , Seminario Sobre la Oceanografia Fisica del Estrechode Gibraltar, Madrid, 24–28 Octobre 1988, SE-CEG, Madrid, pp. 166–194.
Bryden, H.L., Candela, J., Kinder, T.H., 1994. Exchange through the Strait of Gibraltar. Prog. Oceanogr. 33, 201–248. Cano, N., 1978. Resultados de la campana ‘Alboran-76’. Bol.˜ ´
Inst. Esp. Oceanogr. 247, 3–50.
Cauwet, G., 1994. HTCO method for dissolved organic carbon analysis in seawater: influence of catalyst on blank estimation. Mar. Chem. 47, 55–64.
Christensen, J.P., Packard, T.T., Dortch, F.Q., Minas, H.J., Gas-card, J.C., Richez, C., Garfield, P.C., 1990. Carbon oxidation in the deep Mediterranean Sea: evidence for dissolved organic
Ž .
carbon source. Global Biogeochem. Cycles 3 4 , 315–335. Copin-Montegut, C., 1993. Alkalinity and carbon budgets in the´
Ž . Mediterranean Sea. Global Biogeochem. Cycles 7 4 , 915– 925.
Coste, B., Le Corre, P., Minas, H.J., 1988. Re-evalution of the nutrient exchange in the Strait of Gibraltar. Deep-Sea Res. 35 Ž .5 , 767–775.
Dafner, E.V., Sempere, R., Gonzalez, N., Gomez, F., Goutx, M.,´ ´ ´
1999. Cross-slope variations of dissolved organic carbon in the
Ž .
Gulf of Cadiz in relation to water dynamics February 1998 .´
Mar. Ecol.: Prog. Ser. 189, 301–306.
De Baar, H.J.W., Brussaard, C., Hegeman, J., Schijt, J., Stoll, M.N.C., 1993. Sea-trails of three different methods for mea-suring non-volatile dissolved organic carbon in seawater dur-ing the J-GOFS North Atlantic pilot study. Mar. Chem. 41, 145–152.
Doval, M.O., Perez, F.F., Berdalet, E., 1999. Dissolved and´
particulate organic carbon in the North-Western Mediterranean Ž .
Sea. Deep-Sea Res. I 46 3 , 511–527.
Doval, M.D., Hansell, D.A., 2000. Organic carbon and apparent oxygen utilization in the Western South Pacific and the
Cen-Ž .
tral Indian Ocean. Mar. Chem. 68 3 , 249–264.
Druffel, E.R.M., Williams, P.M., Suzuki, Y., 1989. Concentra-tions and radiocarbon signature of dissolved organic matter in the Pacific Ocean. Geophys. Res. Lett. 16, 991–994. Francour, P., Boudouresque, C.F., Harmelin, J.G.,
Harmelin-Vivien, M.L., Quignard, J.P., 1994. Are the Mediterranean waters becoming warmer? Information from biological
indica-Ž .
tors. Mar. Pollut. Bull. 28 9 , 523–526.
Gascard, J.C., Richez, C., 1985. Water masses and circulation in the western Alboran Sea and in the Strait of Gibraltar. Prog. Oceanogr. 15, 157–216.
Gil, J., Gomiz, D., 1994. Circulacion geostrofica, dinamica de´ ´ ´
mesoescala y fertilizacion de aguas someras en el sector notre´
del Mar de Alboran. Bol. Inst. Esp. Oceanogr. 10, 95–117.´
Greze, V.N., Kovalev, A.V., Baldina, E.P., Bileva, O.K., Shmel-eva, A.A., 1985. Zooplankton transfer through the Gibraltar Strait and peculiarities of its taxonomic composition and
distri-Ž . bution in adjacent areas. Invest. Pesq. 49 1 , 3–13.
Grundlich, M.L., 1981. On the observation of a solitary event in¨
the Mediterranean outflow west of Gibraltar. AMeteorB Forschungsergeb., Reihe ArB 23, 15–46.
Guimerans, V., Canavate, R., Palma, R., 1988. Contribution to the˜
knowledge of the Gibraltar sill. In: Almazan, J.L., Bryden, H., Ž .
Kinder, T., Parilla, G. Eds. , Seminario Sobre la Oceanografia Fisica del Estrechode Gibraltar, Madrid, 24–28 Octobre 1988, SECEG, Madrid, p. 83.
Hansell, D.A., Carlson, C.A., 1998. Deep ocean gradient in concentrations of dissolved organic carbon. Nature 395, 263– 266.
Hansell, D.A., Williams, P.M., Ward, B.B., 1993. Measurements of DOC and DON in the Southern California bight using oxidation by high temperature combustion. Deep-Sea Res., Part I 40, 219–234.
Johnson, R.G., 1997. Climate control requires a dam at the Strait Ž .
of Gibraltar. Eos Trans., AGU 78 277 , 280–281.
Kepkay, P.E., Wells, M.L., 1992. Dissolved organic carbon in North Atlantic surface waters. Mar. Ecol.: Prog. Ser. 80, 275–283.
Kumar, M.D., Rajendran, A., Somasundar, K., Haake, B., Jenisch, A., Shuo, Z., Ittekkot, V., Desai, B.N., 1990. Dynamics of dissolved organic carbon in the north-western Indian Ocean. Mar. Chem. 31, 299–316.
Lacombe, H., Richez, C., 1982. The regime of the Strait of Ž .
Gibraltar. In: Nihoul, C.J. Ed. , Hydrodynamics of Semien-closed Seas. Elsevier, Amsterdam, pp. 13–73.
Lacombe, H., Gascard, J.C., Gonella, J., Bethoux, J.P., 1981. Response of the Mediterranean to the water and energy fluxes across its surface, on seasonal and interannual scales. Oceanol. Acta 4, 247–255.
La Violette, P.E., Lacombe, H., 1988. Tidal-induced pulses in the flow through the Strait of Gibraltar. Oceanol. Acta, N SP, 13–27.
Martin, J.H.S., Fitzwater, S.E., 1992. Dissolved organic carbon in
Ž .
the Atlantic, Southern and Pacific Oceans. Nature London 356, 699–700.
McGill, D.A., 1961. A preliminary study of the oxygen and phosphate distribution in the Mediterranean Sea. Deep-Sea Res. 8, 259–269.
Measures, C.I., Edmond, J.M., 1988. Aluminum as a tracer of the deep outflow from the Mediterranean Sea. J. Geophys. Res. 93 Ž .C1 , 591–595.
Medoc Group, 1970. Observation of formation of Deep Water in
Ž .
the Mediterranean Sea. Nature London 227, 1037–1040. Minas, H.J., Minas, M., 1993a. Influence du detroit de Gibraltar´
sur la biogeochimie de la Mediterranee et du proche Atlan-´ ´ ´
Ž . Ž .
tique. Ann. Inst. Oceanogr. Paris 69 1 , 203–214.
Minas, H.J., Minas, M., 1993b. Primary productivity in relation to nutrient cycling and water circulation in the Mediterranean Sea. Proc. 4th Nat. Symp. Oceanogr. Fish., Rhodes Isl., ŽGreece , 26–29 April, pp. 123–143..
Minas, H.J., Coste, B., Le Corre, P., Minas, M., Raimbault, P., 1991. Biological and geochemical signatures associated with the water circulation through the Strait of Gibraltar and in the
Ž .
Western Alboran Sea. J. Geophys. Res. 96 C5 , 8755–8771. Ogawa, H., Ogura, N., 1992. Comparison of two methods for measuring dissolved organic carbon in sea water. Nature ŽLondon 356, 696–698..
Gostan, J., Garfield, P., Christensen, J., Dortch, D., Minas, M., Copin-Montegut, G., Copin-Montegut, C., 1988. Formation of´ ´
Ž . the Alboran oxygen minimum zone. Deep-Sea Res. 35 7 , 1111–1118.
Parrilla, G., Kinder, T., 1987. The physical oceanography of the Ž .
Alboran Sea. Bol. Inst. Esp. Oceanogr. 4 1 , 133–165. Peltzer, E.T., Hayward, N.A., 1996. Spatial and temporal
variabil-ity of total organic carbon along 1408W in the equatorial Ž . Pacific Ocean in 1992. Deep-Sea Res., Part II 43 4–6 , 1155–1180.
Polat, C¸., Tugrul, S., 1996. Chemical exchange between the Mediterranean and the Black Sea via the Turkish straits. Bull. Inst. Oceanogr. 17, 167–186, Monaco, CIESM Science Series 2, SP.
Price, J.F., Baringer, M.O., Lueck, R.G., Johnson, G.C., Ambar, I., Parrilla, G., Cantos, A., Kennely, M.A., Sanford, T.B., 1993. Mediterranean outflow mixing and dynamics. Science 259, 1277–1282.
Rahmstorf, S., 1998. Influence of Mediterranean outflow on cli-Ž .
mate. Eos Trans., AGU 79 24 , 281–282.
Redfield, A.C., Ketchum, B.H., Richards, F.A., 1963. The influ-ence of organisms on the composition of seawater. In: Hill,
Ž .
M.N. Ed. , The Sea vol. 2. Interscience, New York, pp. 26–77.
Roether, W., Weiss, W., 1975. On the formation of the outflow through the Strait of Gibraltar. Geophys. Res. Lett. 2, 301–304. Rohling, E.J., Bryden, H.L., 1992. Man-induced salinity and temperature increases in Western Mediterranean Deep Water.
Ž .
J. Geophys. Res. 97 C7 , 11191–11198.
Rodrıguez, J., Blanco, J.M., Jimenez-Gomez, F., Echevarrıa, F.,´ ` ´ ´
Gil, J., Rodrıgues, V., Ruiz, J., Bautista, B., Guerrero, F.,´
1998. Patterns in the size structure of the phytoplankton community in the deep fluorescence maximum of the Alboran
Ž .
Sea southwestrn Mediterranean . Deep-Sea Res., Part I 45, 1577–1593.
Sempere, R., Charriere, B., Van Wambeke, F., Cauwet, G., 1999.´ ´ `
Carbon inputs of the Rhone River to the Mediterranean Sea: biogeochemical implications. Global Biogeochem. Cycles, in press.
Sharp, J.H., 1994. The broad community DOC methods compari-son. Eos Trans., AGU 75, 106, Suppl.
Sharp, J.H., Benner, R., Bennet, L., Carlson, C.A., Fitzwater, S.E., Peltzer, E.T., Tupas, L.M., 1995. Analyses of dissolved organic carbon in seawater: the JGOFS EqPac methods com-parison. Mar. Chem. 48, 91–108.
Skoog, A., Thomas, D., Lara, R., Richter, K.U., 1997. Methodical investigations on DOC determinations by the HTCO method. Mar. Chem. 56, 39–44.
Stanton, B.R., 1983. Low frequency variability in the Mediter-Ž . ranean Outflow west of Gibraltar. Deep-Sea Res. 30 7A , 743–761.
Stommel, N., 1972. Deep winter-time convection in the western Ž .
Mediterranean Sea. In: Gordon, A.L. Ed. , Stud. Phys. Oceanogr., vol. 2, Gordon & Breach, New York, p. 232. Stratford, K., Williams, R.G., 1997. A tracer study of the
forma-tion, dispersal, and renewal of Levantine Intermediate Water. Ž .
J. Geophys. Res. 102 C6 , 12,539.
Sugimura, Y., Suzuki, Y., 1988. A high temperature catalytic oxidation method of non-volatile dissolved organic carbon in seawater by direct injection of liquid samples. Mar. Chem. 24, 105–131.
Tanoue, E., 1992. Vertical distribution of dissolved organic car-bon in the North Pacific as determined by the high-tempera-ture catalytic oxidation method. Earth Planet. Sci. Lett. 111, 201–216.
Toggweiler, J.R., 1989. Is the downward dissolved organic matter ŽDOM flux important in carbon transport? In: Berger, W.F.,.
Ž .
Smetachek, V.S., Wefer, G. Eds. , Productivity in the Ocean: Past and Present. Wiley, New York, pp. 65–83.
Ž .
Toggweiler, J.R., 1992. Catalytic conversation. Nature London 356, 665–666.
Thomas, C., Cauwet, G., Minster, J.F., 1995. Dissolved organic carbon in the equatorial Atlantic Ocean. Mar. Chem. 49, 155–169.
Van Geen, A., Boyle, E., 1989. Atlantic water masses in the Strait of Gibraltar: inversion of trace metal data. In: Almazan, L.,
Ž .
Bryden, H., Kinder, T., Parilla, G. Eds. , Seminario Sobre la Oceanografia Fisica del Estrechode Gibraltar, Madrid, 24–28 Octobre 1988, SECEG, Madrid, pp. 68–81.
Van Geen, A., Rosener, P., Boyle, E., 1988. Entrainment of trace-metal-enriched Atlantic-shelf water in the inflow to the
Ž .
Mediterranean Sea. Nature London 331, 423–426.
Van Geen, E., Boyle, A., Moore, W.S., 1991. Trace metals enrichments in waters of Gulf of Cadiz, Spain. Geochim.´
Cosmochim. Acta 55, 2173–2191.
Walsh, J.J., Carder, K.L., Muller-Karger, F.E., 1992. Meridional¨
fluxes of dissolved organic matter in the North Atlantic Ocean. Ž .
J. Geophys. Res. 97 C10 , 15625–15637.
Wesson, J.C., Gregg, M.C., 1994. Mixing at Camarinal Sill in the Ž .
Strait of Gibraltar. J. Geophys. Res. 99 C5 , 9847–9878. Wiebinga, C.J., De Baar, H.J.W., 1998. Determination of the
distribution of dissolved organic carbon in the Indian sector of the Southern Ocean. Mar. Chem. 61, 185–201.