RESEARCH OUTPUTS / RÉSULTATS DE RECHERCHE
Author(s) - Auteur(s) :
Publication date - Date de publication :
Permanent link - Permalien :
Rights / License - Licence de droit d’auteur :
Institutional Repository - Research Portal
Dépôt Institutionnel - Portail de la Recherche
researchportal.unamur.be
University of Namur
'Managing the environmental consequences of growth: forest degradation in the Indian Mid-Himalayas', Indian Policy Forum,2006/7, Vol 3, pp215-266
Baland, Jean-Marie; Bardhan, P; Das, S; Mookherjee, D; Sarkar, R
Publication date:
2007
Document Version
Early version, also known as pre-print Link to publication
Citation for pulished version (HARVARD):
Baland, J-M, Bardhan, P, Das, S, Mookherjee, D & Sarkar, R 2007, 'Managing the environmental consequences
of growth: forest degradation in the Indian Mid-Himalayas', Indian Policy Forum,2006/7, Vol 3, pp215-266..
General rights
Copyright and moral rights for the publications made accessible in the public portal are retained by the authors and/or other copyright owners and it is a condition of accessing publications that users recognise and abide by the legal requirements associated with these rights. • Users may download and print one copy of any publication from the public portal for the purpose of private study or research. • You may not further distribute the material or use it for any profit-making activity or commercial gain
• You may freely distribute the URL identifying the publication in the public portal ?
Take down policy
If you believe that this document breaches copyright please contact us providing details, and we will remove access to the work immediately and investigate your claim.
MANAGING THE ENVIRONMENTAL CONSEQUENCES OF GROWTH
Forest Degradation in the Indian Mid-Himalayas
Jean-Marie Baland1, Pranab Bardhan2, Sanghamitra Das3, Dilip Mookherjee4 and Rinki Sarkar5 December 30, 20061
Abstract
This paper assesses the relation between living standards and forest degradation in the Indian mid-Himalayas, and related policy questions. It is based on detailed household, village and ecology surveys in a sample of 165 villages in Uttaranchal and Himachal Pradesh. Our prior fieldwork in this region indicates that forest degradation rather than deforestation is the key problem, driven primarily by collection of firewood and fodder by residents of neighbouring villages. An econometric model relating household collections to relevant characteristics of households, villages and forests is estimated. We find that collections are inelastic with respect to income, and unit elastic with respect to population; hence economic growth is expected to have negligible impact on anthropogenic pressures on the forest, while population growth will aggravate those pressures substantially. We subsequently assess the impact of forest degradation on local living standards. An increase in collection time by one hour, representative of changes observed over the past two decades, is predicted to lower income of neighbouring households by less than 1%. Hence the size of the local externality is small, providing an explanation for lack of collective action among local villagers to regulate forest use. The argument for external policy interventions therefore depends on the significance of associated non-local externalities related to ecological effects of Himalayan forest degradation. A Rs 200 subsidy per LPG cylinder is estimated to raise the proportion of households in these villages using LPG from 7% to 78% , and lower wood use by 44%, at a cost of approximately 4% of average consumption. These subsidies are likely to be more effective than conversion of state owned forests to local communities, on the model of the Uttaranchal van panchayats.
1
Univ. of Namur 2
Univ. of California, Berkeley 3
Indian Statistical Institute, New Delhi 4
Boston University 5
Centre for Interdisciplinary Studies in Environment & Development, Bangalore
1
Revised version of paper presented at the India Policy Forum 2006, at NCAER New Delhi. We thank Suman Bery, Devesh Kapur and Andy Foster for useful comments on the previous version. We are grateful to the Planning and Policy Research Unit of the Indian Statistical Institute, the Macarthur Foundation Network for Inequality and Economic Performance, and National Science Foundation Grant No SES-0079079 for funding this study. Thanks are due to Anil Sharma and Rakesh Sinha for excellent research assistance. We are deeply indebted to the team of field investigators --- S. Parmar, Rajesh Kumar, Suresh Verma, Ramesh Badrel, Joginder Kainthla, Bhupesh Chauhan, P. Mohanasundaram, Sanjay Rana, Vidit Tyagi, Apurva Pant and Narendra Mandral --- who bore great hardships and showed great commitment and courage during the process of data collection. We are deeply indebted to Dr. Rajesh Thadani who designed and initiated the forest surveys and assisted us on ecology related issues. Thanks are also due to all the government officials at all levels in Himachal Pradesh and Uttaranchal who went out of their way to aid and assist us in conducting our field surveys. We would specifically like to thank Mr. D.K. Sharma, Principal Secretary (Planning) Himachal Government, Dr. Pankaj Khullar, Additional Principal Conservator of Forests, Himachal Forest Department, Dr. R.S. Tolia, Principal Secretary, Uttaranchal Government. Finally, this survey would not have been feasible had it not been for the ardent and enthusiastic involvement of the local community inhabiting this region.
1. INTRODUCTION
The environmental consequences of growth is an actively debated issue, particularly in the current context of high growth performance in India and China (see, e.g., Arrow et al (2006), Dasgupta et al (2000), Economy (2004), Economist magazine (July 8, 2004)2, McKibbin (2005)). The 2006 Summit Report of the World Economic Forum, for instance, declared:3
``China and India are at inflection points in their development requiring them to sustain economic development, in particular to manage natural resource consumption and environmental degradation.”
A recent World Bank study of deforestation in India expressed significant concerns about the impact of population and economic growth:
``India’s agricultural intensification has had a major positive impact, relieving pressure on marginal lands on which most of the forests remain. But urbanization, industrialization and income growth are putting a tremendous demand pressure on forests for products and services. The shrinking common property resource base, the rapidly increasing human and livestock population, and poverty are all responsible for the tremendous degradation pressure on the existing forest cover.” (World Bank (2000, Summary section)
These assessments raise a number of important questions. Is there empirical evidence of substantial environmental degradation, and is it likely to be aggravated by growth? What is the likely impact of degradation on living standards, particularly of the poor? What is the nature of the externality involved; are local communities likely to resolve this via collective action and self-regulation? Or is it the case that there is need for external policy interventions? If so, what kind of policies should be considered; how effective are they likely to be?
There are a number of contrasting points of view among academics and policy makers generally concerning the environmental implications of growth. One is a pessimistic assessment, based on the notion that growth will raise the pressure on the earth’s natural resources, e.g., by raising the demand for energy, implying the need for policy measures to moderate and regulate environmental pressures. The viewpoint expressed at the World Economic Forum is representative of this. At the other extreme is a view (often labeled the Poverty-Environment-Hypothesis) that poverty is the root cause of environmental problems, implying that growth leading to poverty reduction will solve environmental problems.4 An intermediate hypothesis is that development may initially aggravate environmental problems, but once it passes a threshold
2
Economist, July 8 2004, ``No Economic Fire Without Smoke,” Books and Arts Section. 3
www.weforum.org/pdf/summitreports/am2006/emergence.htm. 4
will subsequently ease them: often referred to as the `Environmental Kuznets Curve’.5 Yet another viewpoint stresses the importance of local institutions such as monitoring systems and community property rights.6 It argues that deforestation in the past owed primarily to poor control and monitoring systems: once local communities are assigned control they will be successful in regulating environmental pressures, leaving no role for external policy interventions.
These hypotheses present different perspectives on the environmental consequences of development, and the role of policy. Yet there is remarkably little systematic micro-empirical evidence on their validity. Efforts to test these hypotheses have been cast mainly on the basis of macro cross-country regressions, with only a few recent efforts to use micro evidence concerning behavior of households and local institutions governing use of environmental resources ( Chaudhuri and Pfaff (2003), Foster and Rosenzweig (2003), Somanathan, Prabhakar and Mehta (2005)).
This paper focuses on forests adjoining villages in the Indian mid-Himalayas (altitude between 1800 and 3000 metres), in the states of Himachal Pradesh and Uttaranchal. Pre-existing accounts of the state of these forests suggest a significant common property externality problem at both local and transnational levels. The local externality problem arises from the dependence of livelihood systems of local inhabitants on neighbouring forests, with regard to collection of firewood (the principal source of household energy), fodder for livestock rearing, leaf-litter for generation of organic manure, timber for house construction, and collection of herbs and vegetables. Sustainability of the Himalayan forest stock also has significant implications for the overall ecological balance of the South Asian region. The Himalayan range is amongst the most unstable of the world's mountains and therefore inherently susceptible to natural calamities (Ives and Messerly (1989)). There is evidence that deforestation or degradation aggravates the ravaging effects of regular earthquakes, and induces more landslides and floods. This affects the Ganges and Brahmaputra river basins, contributing to siltation and floods as far away as Bangladesh (see Myers (1986) and Metz (1991)).
Our analysis is based on a range of household, community and ecology surveys of a sample of 165 villages divided equally between Himachal Pradesh and Uttaranchal, carried out by our field investigators between 2000-2003. Section 2 describes relevant economic and geographical characteristics of these village pertaining to living standards and dependence on forests. Further survey details, and a detailed assessment of the state of the forests accessed by local villagers based on forest measurements, community interactions and anthropological surveys is provided in a companion paper (Baland et al (2006)). Tree measurements in 619 adjoining forests accessed by villagers in our sample indicated that degradation (in the sense of declining tree quality) rather than deforestation (declining forest area or tree density) represented the predominant problem. Trees were severely lopped, forests exhibited low canopy cover and low rates of regeneration, mostly owing to firewood and fodder collection by neighbouring villagers. Reported collection times for firewood increased over 60% during the past quarter century, amounting to approximately six additional hours per week per household. The extent of degradation was similar on average across state protected forests, community managed forests
5
Barbier (1997b), Grossman and Krueger (1995), Yandle, Vijayaraghavan and Bhattarai (2002). 6
and unclassed forests. Vigilance mechanisms in state forests were widely reported to be ineffective. Only a small fraction of villages reported the existence of effective community management mechanisms. Households were aware of the deteriorating forest situation, yet the large majority reported absence of any significant local institutions or initiatives to arrest the process. This could not be explained by lack of knowledge of tree management practices (which are widely practiced on private trees and sacred groves), nor absence of social capital (as most villages have functioning local collectives for managing other local resources). These findings lend special urgency to the questions raised above concerning the likely impact of future growth and the need for corrective policy interventions in the Himalayan forests.
The absence of any significant forms of collective action among villagers concerning use of forests indicates that the major determinants of forest degradation are those that govern incentives of individual households to collect firewood and fodder from the forest,
unconstrained by community norms or sanctions. Testing the Poverty-Environment hypothesis or the Environmental Kuznets Curve hypothesis then requires estimation of the income elasticity of demand for forest products, using conventional tools of demand analysis. In particular, these different hypotheses can be understood as presumptions concerning the nature of relevant wealth and substitution effects. The Poverty-Environment hypothesis is based on the notion that income increases generate negative wealth and substitution effects: households tend to switch to
alternative fuels both because firewood is an inferior good and the shadow cost of time spent collecting firewood rises with household wealth. The Environmental Kuznets curve on the other hand could be generated if firewood is a normal good and the wealth effects dominate the substitution effects upto some wealth threshold, while substitution effects dominate past this threshold. Those expressing the view that growth will worsen the environment focus attention primarily on positive wealth effects arising out of rising energy demands. Those arguing that growth and poverty reduction can improve the environment in contrast stress the importance of the negative substitution effects, apart from the possibility that firewood may be an inferior good.
Testing hypotheses concerning linkages between wealth and firewood collection and forming future projections of forest pressures thus requires us to estimate the related wealth and substitution effects. In our context, however, this raises a number of econometric difficulties. The chief problems concern potential endogeneity of income, as self-employment income constitutes the bulk of incomes earned by households in remote mid-Himalayan villages. For one, these depend on labour supply decisions of households in self-employment activities, which are jointly determined with firewood and fodder collection. One cannot therefore use actual income as an independent determinant of collection of forest products. Second, there may be many omitted variables that are not measured, which affect both incomes earned as well as firewood collected. Some of these may be unobserved household characteristics: e.g., those with greater energy or better health may both earn higher incomes and collect more firewood, and the observed income-firewood correlation may reflect their joint dependence on these unobserved household traits rather than a causal link from income to firewood collection. Other omitted variables may be unobserved village characteristics, such as geography or climate that affect both incomes and forest stocks available. Third, firewood collection is a non-market activity, the cost of which from the standpoint of any household cannot be measured with reference to any market prices. The relevant `price’ of forest products is the value of time needed to collect them,
which households will compare with the market price of alternative fuels. One needs to estimate the shadow value of time, on the basis of a model of intra-household allocation of time between self employed production tasks, household chores and leisure.
The approach we take to deal with these problems is as follows. In the short run, we take as given the size and structure of the household, the assets it owns, and its preferences for cooking and heating energy, consumption goods and leisure. We estimate a household production function which predicts self-employment income as a function of its asset composition, and use this to estimate the shadow value of time. This is subsequently used to impute a cost to the time spent collecting firewood. We also use the household production function to predict the income the household would have earned if it fully employed its available stock of labor for self-employment. This is a measure of `potential income’ which depends only on the assets owned by the household, and can be viewed as the relevant measure of wealth in the short run which does not depend on its labour allocation choices. Moreover, it is independent of unobserved household traits that may jointly affect labour supply and firewood collections. This measure of potential income is then used to estimate wealth and substitution effects, both with respect to household assets as well as cost of alternative fuels. We control for a variety of observed village characteristics (such as the composition of neighbouring forests, village infrastructure and geography), and for unobserved village characteristics with fixed or random village effects. Section 3 describes the model and econometric methodology in more detail, and presents our estimates of household demand patterns.
The rest of the paper uses these estimated demand patterns to address the principal questions posed at the outset. Section 4 estimates the effects of future growth in household assets. For most households we find that the substitution and wealth effects neutralize each other: firewood and fodder collections turn out to be remarkably inelastic with respect to improvements in living standards. In particular we find no evidence in favor of the Poverty-Environment hypothesis, nor do we find any Kuznets-curve patterns. The effect of economic growth (i.e, in assets or their productivity) per se is thus unlikely to increase the pressure on the mid-Himalayan forests, contrary to the assertions mentioned at the beginning of this paper.
In contrast, the effects of growth in population are likely to be adverse: rising population will cause a proportional rise in collections at the level of the village, while leaving per capita collections almost unchanged. To the extent that household division induces a shift to smaller household sizes, resulting loss of economies of scale within households will raise per capita collections even further. Hence anthropogenic pressures on forests are likely to be aggravated by demographic rather than economic growth. Unless there is substantial migration out of the mid-Himalayan villages, the pressure on forests is likely to grow substantially.
Section 5 estimates the effect of further forest degradation on the future livelihoods of neighbouring villagers. These effects will be felt mainly in increased collection times. We have not attempted so far to estimate how collection of firewood and fodder at current levels will translate into forest degradation and increased collection times in the future. Instead we estimate the effects of increased collection times by one hour, which is a plausible estimate for the next decade or two, given the changes observed in collection time (one and half hour increase) over the past quarter century. The impact of this on livelihoods of neighbouring residents turn out to
be surprisingly low: the effect is less than 1% loss in household income, across the entire spectrum of households. Moreover, our model predicts no significant increases in time spent by children or male adults in collection, nor any increase in child labour. This indicates that the magnitude of the local externality involved in use of the forests is negligible, providing a possible explanation for lack of effort among local communities to conserve neighbouring forests. The argument for external policy interventions then rests on the larger ecological effects of forest degradation. We are not qualified to assess the significance of these non-local externalities, while noting that these continue to be actively studied and debated among scientists and ecologists.
Should the ecological effects demand corrective action, Section 6 studies policy options available. The principal alternative to firewood is LPG among these households; kerosene and electricity only appear as secondary sources of fuel. Household firewood use exhibited
considerable substitution with respect to the price and accessibility of LPG gas cylinders, suggesting the scope for LPG subsidies as a policy which could be used to induce households to reduce their dependence on forests for firewood. We estimate the effectiveness and cost of a Rs 100 and a Rs 200 subsidy for each gas cylinder. The latter is predicted to induce a rise in
households using LPG from 7% to 78%, reduce firewood use by 44%, and cost Rs 120,000 per village annually (about 4% of annual consumption expenditure). A Rs 100 subsidy per cylinder would be half as effective in reducing wood consumption, but would entail a substantially lower fiscal cost (Rs 17000 per village annually, approximately 0.5% of annual consumption). The econometric estimates also show that firewood use is moderated when local forests were managed by the local community (van panchayats) in Uttaranchal. However, this effect is limited to those community managed forests that were judged by local villagers to be moderately or fairly effective, which constituted only half of all van panchayat forests. It is not clear how the government can induce local communities to take the initiative to organize themselves to manage the neighbouring forests effectively, when they have not done so in the past. Moreover, even if all state protected forests could be converted to van panchayat forests, firewood use would be predicted to fall by 20%, comparable to what could be achieved with a Rs 100 subsidy per LPG cylinder. Hence policies aimed at increasing local community management of forests are likely to be less effective in curtailing firewood collection than subsidies on alternate fuels.
2. SURVEY DETAILS AND DESCRIPTIVE FINDINGS
Preceded by pilot surveys in representative villages, final surveys were done in 165 villages divided evenly between Himachal Pradesh and Uttaranchal over a period of three years 2000-03. A stratified random sample of 20 households in each village was selected, with villages selected on the basis of altitude, population and remoteness, and households on the basis of landholding and caste. Further details of the sampling design are provided in Baland et al (2006). All data reported here are based on our surveys, unless otherwise mentioned.
Figure 1 shows that average time taken to collect one bundle of firewood currently is 3.84 hours, as against 2.36 hours a quarter century ago.7 The increased collection time reflects greater time taken within the forest to collect firewood, rather than shrinking forest areas: distance to the forest increased marginally from 2.06 to 2.31 kilometers. Time spent within the forest thus multiplied more than three times. This indicates that forest degradation rather than deforestation has been the main problem. Figure 2 shows that the amount of firewood used has dropped by 38% in the summer and 34% in winter over the past quarter century.8
Uttaranchal has a higher average standard of living compared with Himachal. Average household per capita annual consumption in Uttaranchal is Rs 9300, and in Himachal is Rs 7900 (all at prices at the time of the surveys); the poverty head count rates (using state-specific poverty lines) are 4.8% and 24% respectively.9 The average size of non-farm business per household is Rs 22,000 in Uttaranchal, double that of Himachal’s. On the other hand, Uttaranchal households have fixed income (typically in the form of salaries and pensions) that is less than half of fixed incomes in Himachal. Levels of education are similar across the two states: total education in a household (i.e., aggregating across all household adults) is approximately 13 years of schooling. Himachal villages have a higher average population of 545, compared with 334 for Uttaranchal. Finally, Himachal households collect more firewood – 47 bharis on average per household member, compared with 40 in Uttaranchal. With an average household size of 5.6 in Uttaranchal and 5.8 in Himachal, this amounts to about 225 bharis for the household per year in the former and 270 in the latter. This translates into an annual collection time of approximately 750 hours in an average Uttaranchal household, and 900 hours in an average Himachal household.10 Collection times are similar across the two states.
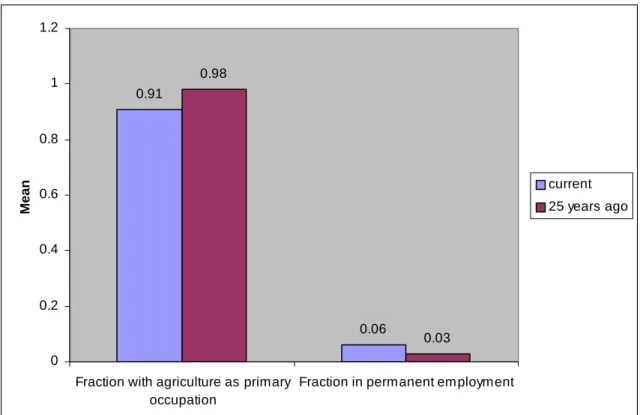
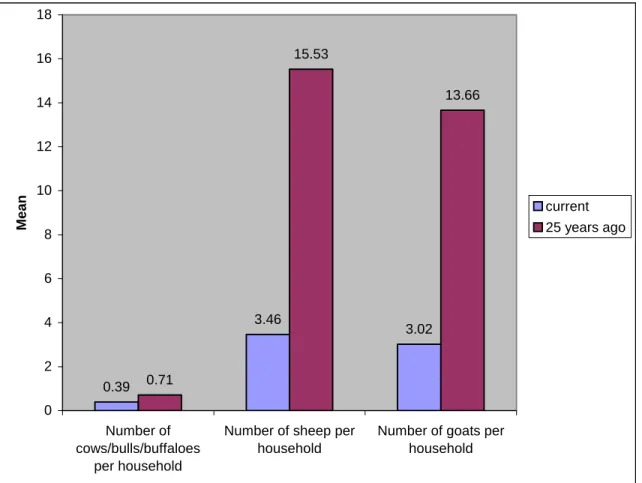
Figures 3-7 show changes in key village characteristics over the past quarter century. Roads have brought these villages much closer to the outside world, reducing distance to nearest road-link from 9.4 to 3.8 hours. Occupational patterns have moved away from reliance on agriculture and livestock, salaried employment has risen, and illiteracy rates have dropped considerably. Population has risen: the number of households per village doubled, while mean household size remained virtually the same.11
7
This data is from an ecology questionnaire based on interviews with 3 or 4 prominent village residents. The data concerning 25 years ago are based on recall by these respondents, with the exception of data on household size which we take from the Census. A bundle of firewood is the amount typically carried on the back of an adult, amounting to approximately 35 Kg.
8
The econometric results of this paper provide the following explanation for this drop: increased collection times, rising levels of education and non-farm business, falling livestock ownership, and greater accessibility to alternate fuels such as LPG.
9
Consumption was measured on the basis of a detailed questionnaire of household expenditure on different items, along the lines of a World Bank Living Standards Survey. Assets and fixed incomes are based on household responses to corresponding questions. Self-employment incomes are constructed on the basis of detailed questions concerning various inputs, outputs and prices of these in agricultural and livestock based activities. Potential income is constructed according to a method which is explained in the next Section in some detail. This is an overstatement of the predicted permanent income of the household on the basis of various assets owned, owing to it being based on the assumption that the household utilizes all its available labor stock rather than at the observed utilization rates. 10
Collection times here are approximately 3.3 hours, the average of the times reported by the households in the sample. This is in contrast to the higher average collection time of 3.8 hours reported in the ecology questionnaire. Since the household questionnaire is based on a larger sample, we use these numbers from this point onwards. 11
Explaining these changes in village characteristics is outside the scope of this paper. A broader examination of growth effects on forests could conceivably encompass this, a task we leave for future research.
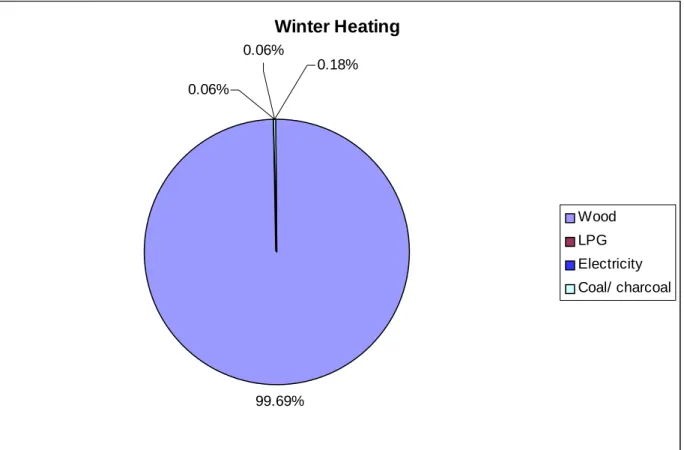
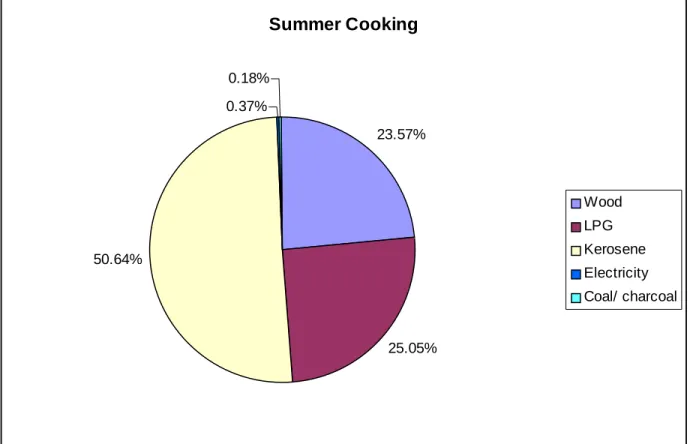
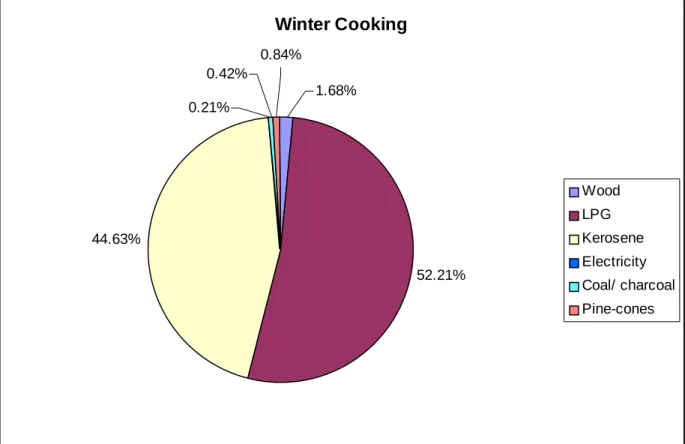
Figures 8-13 describe nature of fuel used by households in Himachal; we do not show the corresponding figures for Uttaranchal as they are very similar. Firewood is the principal source of cooking energy in the summer for 90% households, followed by LPG which is used by 9%, and kerosene by the remaining 1%. Reliance on firewood becomes even more acute in the winter, when it becomes the primary source for both cooking and heat for over 99% households. LPG, charcoal and electricity are the primary source of the minority of remaining households. Kerosene and LPG appear as important secondary sources of cooking fuel, and electricity as a secondary source of heat energy.12
The principal findings of our ecology and community interaction surveys were consistent with the above facts and are summarized as follows.
(a) The chief problem appears to lie in the degraded quality of forests, rather than deforestation. Measures of forest quality such as canopy cover, tree lopping and forest regeneration indicated severe degradation, with the problem being especially severe in Uttaranchal. 40% of all forest patches fell below sustainability thresholds used by ecology experts for canopy cover; in Uttaranchal the mean percent of trees severely lopped was exactly at the threshold of 50%. Tree stock density in comparison appeared quite healthy by comparison: only 15% of forest patches fell below the sustainability threshold of 35 square metres per hectare. Hence the nature of degradation does not involve a substantial reduction in forest biomass, and would not be picked up by aerial satellite images.
(b) Collection times for firewood have increased 60% over the past quarter century, while distance to the forest increased only 10%, another indicator of the importance of forest degradation rather than shrinking forest area. 60% of reported encroachment occurred with respect to village commons, as against only 5% with respect to forests.
(c) The main cause of forest degradation appears to be anthropogenic (collection of firewood, fodder and timber) rather than natural causes (damage owing to fire or snow), with firewood and fodder collection predominating.13
(d) Over 80% of villages interviewed expressed awareness of deteriorating forest quality. Yet only 45% reported any sense of alarm within their communities. Most were aware of methods of sustainable tree management and practiced these on their private plots and on sacred groves. There was little or no evidence of informal collective action exhibited by local communities to arrest forest degradation, while there are numerous instances of
12
To avoid confusion, it is helpful to note that the figures concerning allocation of secondary fuel sources concern only the sub-population that reported using secondary fuels, whereas the figures concerning allocation of primary fuels applied to the entire population. Of the 1636 households in Himachal, 543 used a secondary fuel and 111 used a tertiary fuel for cooking in summer where as 73 used a secondary fuel and only 1 household used a tertiary fuel.
13
Timber accounted for biomass removal of only 48 tons per village per year, compared with 456 tons per village per year for firewood.
collective action in other areas relevant to current livelihoods, such as agriculture and credit, besides women’s groups, youth groups, temple committees etc.
(e) Measures of forest degradation do not vary between different categories of state or community forests. Monitoring of use of state forests appeared to be poor; collective plantation programs initiated by the forest departments have been ineffective.
(f) Formal community management of forests were largely ineffective in Himachal Pradesh. Half of the Uttaranchal villages had van panchayats (community managed forests), only half of which were perceived to be effective by local residents. Van panchayat forests exhibited the same extent of degradation as all other forests.
(g) Anthropological studies in four villages corroborated the main findings of the ecology and community surveys: anthropogenic pressures are imposing a heavy toll on neighbouring forests, and existing institutions of state or local community management appear to be largely ineffective to arrest this process.
3. DETERMINANTS OF HOUSEHOLD FIREWOOD COLLECTION
Given the findings reported above, it is necessary to study patterns in household behavior
pertaining to their activities that affect sustainability of the forest stock. Since the primary source of degradation is lopping of trees for collection of firewood, we examine determinants of
firewood use by households.
Theoretical Framework
The conceptual basis for this is a model of a household maximizing a utility function with five arguments:
U(C, Eh, Ec, Λ, n)
where C stands for consumption expenditures, Eh for heat energy, Ec for cooking energy, Λ for leisure and n for family size. Firewood is the sole source of heat, while LPG and firewood can both be used for cooking. Hence firewood has a joint product property: the exclusive dependence of households on firewood for heat in the winter months implies that all households will use firewood for cooking as well, with LPG used as a possible supplement. The inclusion of family size takes into account the fact that energy, and particularly heating energy, is to a large extent a public good within the household while consumption expenditures are not. Letting F stand for firewood, and G for LPG, we have:
Eh = φF, and Ec = ωF+µG
Household income is the sum of fixed income (pensions, salaries of permanently employed members and wage employment earnings), denoted I, and self-employment income, Y. The latter is in turn determined by the value of household production, given by a Cobb-Douglas production function of household labor supply, S, and the productive assets owned by the household: land N, big livestock, Lb, small livestock, Ls, education, E and non-farm business assets, B:
Y= Sα1 N α2 Lbα3Lsα4E α5B α6 (1)
Note that self-employment income Y is determined endogenously by the labour supply choices of the household, while fixed income I is exogenous. Hence it will not make sense to take self-employment income as a fixed household characteristic. However, household assets and
demographics can be taken as given in the short run. To represent the household’s wealth, it will thus be convenient to use as a proxy the following variable: potential (self-employment) income W defined to be the self-employment income that the household would earn if it were to fully utilize its labor stock available for self-employment activities.14 Let T denote this labor stock, obtained by multiplying by 16 hours per day the number of adults (plus an adult equivalent scale of 0.25 for children) that are not engaged in salaried employment elsewhere, therefore available for household activities, productive self-employment and forest collection. Then potential income of the household is given by
W= Tα1 N α2 Lbα3Lsα4E α5B α6
which by construction always exceeds the actual self-employment income. The main benefit of using this is that it is a function of household demographics and assets, and thereby independent of short run labour allocation choices made by the household. It aggregates the assets of the households into a single measure of wealth. Estimations based on reported income rather than potential income are subject to an endogeneity bias, as labour used in self-employment is a decision variable. For instance, it is likely that more dynamic or better skilled farmers will simultaneously choose to work more and to collect more firewood. Our measure of potential income is not subject to this type of bias. Moreover, this measure also removes sources of transitory shocks and measurement error in reported self-employed income.
There is no market for firewood, so households collect firewood themselves.15 As a result, the primary cost of firewood is the opportunity cost of time involved in collecting it. Since
ownership of different assets affect allocation of household time between different occupations, some of which are complementary with firewood collection while others are substitutes, the time taken to collect firewood, tf, also depends on the assets owned by the household. Since
14
One reason why we separate fixed income and potential income is that access to a regular flow of income, such as provided by salaries or pensions may induce household to rely more extensively on LPG, by making liquidity available at regular time intervals, and reducing income risk. The other reason is that potential income can be treated as a proxy for the shadow wage, as explained further below.
15
See Appendix A3: only 3% households in our sample purchase any firewood, and 0.1% do not collect any on their own. Even old people collect firewood: 2.68% of all collectors are above 65. There are 103 individuals of age 70 who collect; 12 at the age of 80; and 1 each from the ages of 86-93! Moreover, old people rarely stay alone: 0.2% of households have people only above the age of 65. In our field-work we were struck how even the most well-to-do households collected their own firewood rather than delegating it to servants or purchasing it from others.
occupational choices are endogenously determined by labour allocation decisions within the household, we use as proxies the corresponding assets owned by the household that influence occupational choices. Letting tc represent the time taken to collect firewood for a household with no assets, we assume:
tf = tc (1+ γ1N+ γ2Lb+ γ3Ls+ γ4E+ γ5B) (2)
where γi measures the degree of complementarity between the activity associated with asset i and firewood collection. For instance, it might be hypothesized that grazing big livestock reduces the time taken to collect firewood (γ2<0) while running a non farm business increases it (γ5>0). The cost of LPG is the price (including transportation cost) that must be paid for it, pg. The budget constraint can then be written as:
C+ pg G = I + Y,
and the labour allocation constraint is given by: T= S+Λ+ tfF,
where it may be recalled T represents the total amount of labour available for self employment. The household maximizes utility by simultaneously choosing labour supply, firewood, LPG and consumption expenditures, taking assets, fixed income, demographics, the price of gas and the time taken to collect firewood as given in the short run. The resulting demand functions for firewood and for gas can be written as function of potential income, W, fixed income I, the shadow price of firewood (equal to the time tf required to collect one bundle of firewood multiplied by the shadow value of time), the price of gas and household demographics
(represented by household size n in adult equivalent consumption units).16 The shadow value of time, w, corresponds to the marginal productivity of labour in self-employment occupations (determined in turn by the labour supply choice and household assets). We thus have:
F = F(W, I, w.tf, pg, n), and G = G(W, I, w.tf, pg, n) (3) Taking a Taylor expansion, and allowing for higher order terms in income and demographics, we obtain the following equation that can be directly estimated:
F/n = β0+ β1W+ β2W2+ β3 I+β4 w.tf + β5pg+ β6n+ β7(1/n)+ β8Xv+εiv (4)
and similarly for LPG, where Xv is a vector of village effects such as geography, type of local forest, proximity to towns, availability of alternate fuels etc.
A number of remarks on this formulation are in order. First, potential income as defined above provides a single measure of wealth which values and aggregates the different assets owned by
16
Household size in adult equivalent consumption units differs from labor stock T available for self-employment in two respects: it incudes all adults in the household whether or not they are employed elsewhere, and it applies a weight of 0.5 rather than 0.25 to children.
the household. The second and third terms on the right-hand side of (4) represent the wealth effect on firewood demand. This wealth effect can be positive or negative, as it will include on the one hand rising demand for household energy, and a rising concern with indoor smoke on the other that may tend to reduce demand for firewood and switch to less smoky fuels such as LPG or electricity.
Second, the shadow value of time w also increases with potential income W, because the marginal productivity of self-employed labour is an increasing function of the assets owned by the household that are complementary to labour supply. Wealthier households therefore have a higher value of time, and a higher shadow price of using firewood. This implies that the substitution effects (represented by the fifth term in (4) above) also rise with W. To the extent that the wealth effects are positive, and the substitution effects are negative, a rise in wealth of the household will tend to raise both at the same time, so the overall effect is theoretically indeterminate. As explained in the Introduction, the difference between different viewpoints in the literature concerning the determinants of environmental degradation such as the Poverty-Environment hypothesis, the Kuznets curve can be interpreted as arising from different presumptions concerning the signs and significances of these wealth and substitution effects. Third, if labour markets were perfect, the valuation of household time would simply be the market wage rate. Here however, the shadow value of time is the marginal productivity of household time, estimated using the household production function17. One problem with using the measured shadow wage as a determinant of the shadow price of firewood is that it depends on endogenous labour supply decisions of the household. We shall show below in our empirical estimates that shadow wages and potential income move closely together, controlling for
household size. Therefore per capita potential income (i.e., potential income W divided by T, the labour available for self-employment) can be used as a proxy of the shadow wage rate.
Recalling the formulation of collection time tf above as a function of household assets, the firewood demand equation can be written as a function entirely of household characteristics fixed in the short run:
F/n = β0+ β1W+ β2W2+ β3 I + β4 (W/T). tc (1+ γ1N+ γ2Lb+ γ3Ls+ γ4E+ γ5B)
+ β5pg+ β6n+ β7(1/n)+ β8Xv+εiv (5)
Here the substitution effects appear as interactions between per capita potential income (W/T) of the household, average collection time in the village (proxied by tc ) and household asset stocks.
Empirical Results
17
One source of imperfection is the existence of nonpecuniary costs for family members, especially women and children, to work outside the home or own farm. Another source of divergence between (measured) market wages and the value of time arises due to seasonal fluctuations in the labor market. Wage employment arises for a few months in the year (e.g., during harvesting and sowing seasons), when market wage rates rise above the value of time in household production. In our sample all households participating in wage employment were also involved in home production. For this reason reported market wage rates (which pertain to the high demand periods) turned out to be substantially above shadow wages (which pertain to year-round labour). Hence wage employment earnings were intramarginal, and the margin of labour-leisure choices operated solely with respect to home production.
The first step in the empirical analysis is estimating the household production function (1). Table 1 shows the estimated production function, with village fixed effects and labor hours
instrumented by family size and composition.18,19 The elasticity with respect to labor hours is 0.2, indicating that marginal products are one-fifths the size of average product of labor. Hence shadow wages are considerably below self-employment earnings per hour. Household income is particularly sensitive to ownership of land and big livestock (cows, bulls and buffalos), which have elasticities of 0.48 and 0.27 respectively.20 The elasticity with respect to non-farm business assets is 0.08, and to schooling of adults is 0.06.
The estimated production function is then used to calculate shadow wages and potential income. Recall that the shadow wage depends on assets of the household as well as labour supply
decisions, and are thus endogenously determined. Table 2 shows the main determinants of shadow wages: potential income, household labour stock available for self-consumption, and occupational patterns (proxied by asset composition). A Gaussian kernel regression21 between per capita potential income and shadow wage is shown in Figure 14: the relationship is
increasing, and approximately linear. Hence we can use per capita potential income as a proxy for the shadow wage in the firewood demand equation.
Table 3 shows the estimated firewood demand equation corresponding to equation (4), where the shadow wage is used to measure the substitution effects. Table 4 shows the firewood demand corresponding to equation (5), where per capita potential income is used as a proxy for the shadow wage. Since this uses exogenous household characteristics only as regressors, Table 4 is the more reliable set of results, though we see that the results are very similar between Tables 3 and 4. The first column of Table 4 shows the estimates with village fixed effects, while the remaining columns (as well as Table 3) include village characteristics and village random effects. The last two columns of Table 4 show corresponding regressions for summer and winter use of firewood. The winter use can be interpreted as reflecting the joint effect of cooking and heating needs, while summer use reflects cooking needs alone.
Village characteristics include proportion of local forest area of different types that may be subject to different regulations concerning forest use: van panchayats, sanctuaries, and un-classed state forests, with state protected forests (DPFs and RFs) being the control category.22 Others are the price of LPG cylinders (plus transport cost to the doorstep of the household), a
18
See Jacoby (1993) for a similar approach. 19
We use reported family labor hours in self-employed occupations, applying a weight of 0.25 to child labor hours. For instruments we use number of adult males and females not engaged in permanent employment. We do not include the number of children among the instruments, since fertility decisions may be correlated with unmeasured household attributes relevant to its productivity.
20
The definition of the asset variables used is provided in Appendix A3. 21
Kernel regression is a technique to relate the two variables in our case without imposing any functional form for the relationship. In short, it is a smoothed version of a scatter plot so that the nature of the relationship is easily observable; see Prakasa Rao (1983) for a survey of such techniques. We have used a Gaussian (normal) density function in the process and hence the name.
22
Van panchayats are forests owned and managed by the local community, which arise only in Uttaranchal. Remaining forests are mainly state forests, of which some are sanctuaries (where households have no collection rights at all), demarcated protected forests (DPF) and reserved forests (RF) in which households have restricted collection rights, the remainder being unclassed or undemarcated state forests where there are no restrictions on their collection rights. For further details see Baland et al (2006).
dummy for irregular availability of LPG as reported by households, altitude, average collection time in the village, and a number of measures of climate, infrastructure, remoteness, village population, land inequality, ethnic fragmentation which may affect energy preferences or local collective action to regulate forest use.
For the sake of brevity, we focus mainly on the firewood use regressions, though we have estimated analogous fodder collection regressions as well, which are shown in the Appendix. Firewood and fodder collection are highly complementary activities, often accomplished on the same trip to the forest. So it is not surprising that fodder and firewood regressions exhibit similar properties, justifying our focus on firewood use in the main body of the paper.
The results of the fixed and random effects wood use regressions in Table 4 are very similar, lending confidence to the random effects specification (which is based on the assumption that omitted village characteristics are uncorrelated with included characteristics). Village
characteristics included (apart from the ones reported in the table) are time to roads, government block office, ethnic fragmentation, land inequality, snowfall, and an electrification dummy; all of these were statistically insignificant. A larger set of village characteristics pertaining to
geography and infrastructure altered the reported coefficients very little. We therefore report the more parsimonious specification in Table 4.
The regression results show wealth effects are positive and significant, while a number of substitution effects are negative and significant, with one exception. Since firewood collection and grazing of livestock are complementary activities, the substitution effect is positive with respect to ownership of big livestock. On the other hand education, ownership of non-farm business assets and land are associated with non-livestock occupations; time spent in such occupations and in collection of firewood or fodder are substitutes. This explains why the estimated substitution effects with respect to ownership of non-livestock assets are negative. There is evidence of household economies of scale: larger households use less firewood per capita.23 Firewood use is sensitive to the cost of LPG, and not so much to whether it is available regularly. Proximity to van panchayat forests is associated with less use of wood compared with state DPF forests, while unclassed forests involve higher use of wood. This suggests that
monitoring by state or community appointed forest guards are effective to some extent, and community monitoring more effective than state monitoring. Higher village population is associated with slightly higher use of wood, owing possibly to a dilution of enforcement or monitoring in larger villages.
The regression for fodder in Appendix A1 additionally includes number of big and small livestock owned (in addition to their interaction with the shadow cost of firewood collection time). Here wealth effects are negative, and the substitution effect is positive with respect to ownership of small livestock. LPG use does not affect fodder collected, nor does the presence of van panchayat forests. In other respects fodder collection is similar to firewood use.
23
A decrease in household size by one adult (resp. one child) in an average household (i.e., with characteristics equal to the average characteristics in the sample) is estimated to raise firewood use per capita by 10.6% (resp. 5.2%).
4. EFFECTS OF GROWTH
The estimated patterns of firewood collection yield predictions for effects of future growth in incomes, assets and population. The underlying assumption is that cross-sectional variations in firewood collection across households at a point of time can be used to predict how behaviour of any given household will respond when its circumstances change over time. Temporal responses are typically smaller compared with what cross-sectional long run elasticities predict: e.g., because households may treat part of the increased incomes as transitory, or may take time to adjust their habits. However, short and long run responses tend to move in the same direction. As we shall argue, this consideration will further strengthen our main findings below.
An additional problem is that the estimated income elasticities may be biased owing to omission of unobserved household attributes that affect both their assets and firewood collection. For instance more farsighted, energetic, better located, or better connected households may both accumulate more assets and collect more wood. The estimated elasticities from the cross-sectional variations across different households will then overstate the extent to which wood collection will increase following asset increases of any given household. Again, this will turn out to strengthen our principal conclusions below.
Tables 5 and 6 show the impacts on per capita firewood use of: (i) a 10% increase in each relevant asset and (ii) a 10% change in potential income owing to an increase in productivity of assets while asset compositions remain unchanged. Table 5 shows the effect on an `average household’, defined to be a hypothetical household with average characteristics (i.e, each
characteristic is set equal to the corresponding average in the sample). It shows that firewood use is inelastic with respect to income growth, irrespective of whether it arises from productivity increases or asset accumulation. For the average household, firewood use per capita falls 0.06% following an increase in asset productivity of 10%. The elasticity with respect to growth of any asset is uniformly below 0.02 in absolute value.
Table 6 shows the average of the predicted impacts across households, evaluated at their
observed characteristics, and broken down into different quartiles. The elasticity with respect to increased asset productivity is less than .009 in absolute value for all groups. With respect to growth in big livestock the average elasticity is .02, and is -.03 with respect to growth in years of schooling. These elasticities get larger for the richest households (upper-most quartile) for whom they are only .05 and -.09 respectively. Hence firewood use is essentially inelastic with respect to growth in incomes or assets. If temporal elasticities are smaller than cross-sectional elasticities, the inelasticity is further reinforced.
Appendix A2 shows similar results for fodder. These findings are consistent with
anthropological studies in selected villages (reported in our companion paper (Baland et al (2006)), in which villagers claimed that everyone in the village uses the same amount of firewood irrespective of their circumstances. We therefore do not find support for any of the viewpoints on the connection between growth and the environment: differences in living standards have no discernible impact on firewood or fodder collection.
Why does firewood use exhibit this inelasticity? This is a natural question to ask since firewood is virtually the sole source of heat energy, the demand for which one would have expected to rise with income. And the firewood collection equation does exhibit sizeable and positive wealth effects. The answer lies in the fact that rising potential income also raises the shadow wage, thus raising the substitution effects, which offset the wealth effect. Firewood is becoming more expensive at the same time that wealth is increasing, so households are switching to alternate forms of energy as they become richer (which will be verified below for LPG in Section 6). Note that the inference that economic growth per se is unlikely to increase the pressure on forests is further reinforced if we take account of short run adjustment costs or possible biases arising from omission of unobserved household traits in the firewood regression, since these are likely to have resulted in overestimation of the effect of increased wealth on collections.
Next consider the effects of population growth. The average household size of 5.7 indicates that most families are nuclear already and there is little scope for further fragmentation of
households. Recall also from Section 2 that household size has not changed much over the past quarter century. Moreover, within villages we find little variation in household size with per capita potential income.24 So it is reasonable to assume that household size will remain fixed in the near future, irrespective of economic growth. This implies that population growth will consist mainly of an increase in the number of households. Unless there is substantial out-migration from villages, it is reasonable to suppose that population will grow by at least 10% in the next decade. If the number of households in the village were to grow by 10%, the demand for
firewood and fodder will correspondingly rise by approximately 10%.25 If households become more fragmented, the loss of household scale economies will further reinforce this.
We therefore conclude that demographic changes rather than economic growth will determine future growth in household use of firewood and fodder. Absence significant increases in migration out of these villages, the pressure on forests will rise approximately in proportion to the rise in population, i.e., of the order of 10% or more in the next decade, resulting in further forest degradation.
5. QUANTIFYING THE LOCAL EXTERNALITY: IMPACT OF DEFORESTATION ON LOCAL LIVING STANDARDS
Continued forest degradation will impact the lives of neighbouring villagers primarily by raising the time it takes them to collect firewood and fodder. If trees are more severely lopped, the villagers will take longer to collect a single bundle, either by searching longer for trees that still have branches that can be lopped, or walking further into the forest parts that have not yet been
24
The average number of adults across quartiles of per capita potential income are 3.50, 3.63, 3.44 and 3.37 respectively, with a standard deviation of approximately 1.4. The average number of children are 1.49, 1.71, 1.54 and 1.38; the standard deviation is approximately 1.4 also. Hence these differences are not statistically significant. 25
Recall that Table 4 showed that rising population in the village tends to have a negligible (positive) impact on per capita household use of firewood. A 10% rise in village population would correspond to a population increase of approximately 40, which Table 4 shows will raise per capita annual firewood use by .015 bundles, compared to the current average of 45 bundles. Hence the effect on per capita use would be negligible, implying that the effects of population growth will be approximately proportional to the rise in population.
harvested. This is the principal source of the local externality: higher collections today by any single household will raise collection times for all households in surrounding villages in the future.
Precise quantification of the magnitude of this local externality requires knowledge of the rate at which future collection times will rise in response to current collection levels.26 We have not attempted to estimate this so far. Instead we will try to provide some bounds for the magnitude of the externality, on the basis of certain simplifying assumptions. In the past quarter century
collection times have risen by one and a half hours per bundle, while collection levels have fallen. Assuming that the relation between collection levels and the subsequent rise in collection
time observed in the past will continue into the future, one would expect the future rise in
collection times to be lower than has been observed in the past. Since population growth rates are slowing, and economic growth is unlikely to matter in determining collections, the rate of growth in collection can be expected to be slower than observed in the past. If the relationship between growth in collection and changes in collection times are linear, one can project on the basis of past trends.
The justification for this is that there do not appear to be any noticeable thresholds in forest degradation in the areas covered in this study: In most of the forest areas concerned, villagers have traditionally accessed a small fraction of the overall forest area adjoining their villages, with vast portions of the forest yet to be actively tapped. As the areas close to the villages become more degraded, households can simply walk deeper into the forest to find un-lopped trees. Therefore the prospect of sudden increases in collection times disproportionate to those observed historically seems to us fairly remote, though of course further scientific opinion needs to be sought on this matter.
We shall therefore consider the effects of an increase in collection time by one hour per bundle; under the assumption mentioned above, this seems a reasonable upper bound for the increased collection time that may expected for the next decade or two. It will turn out that the results will hardly change if we double the estimated rise in collection time from one to two hours per bundle.
Applying Hotelling’s Lemma, the effect of a small increase in collection time on household welfare can be approximated simply by calculating the shadow cost of additional time required to collect the same number of bundles of firewood selected by the household prior to the increase in collection time. For large changes in collection time, this provides an upper bound to the welfare loss of the household, since the household can adjust its collection levels as the collection time rises. Indeed, as we saw in Table 4, households do indeed reduce collections considerably as collection times rise, implying that the actual welfare loss is smaller than this upper bound. We compute this upper bound by using the estimated shadow wage to value the added collection times that would be involved in collecting the same amount of firewood as today.27
26
We thank Andy Foster for pointing out the need for this information in order to estimate the magnitude of the externality.
27
Households could not distinguish between times spent collecting fodder and firewood, consistent with our view that these activities are highly complementary, often accomplished in the same visit to the forest. Hence there is no
A simple back-of-the-envelope calculation indicates that the mean effect of an increase in collection time by one hour per bundle is extraordinarily small. The average shadow wage is Rs 1.5 per hour, and mean firewood collected by a household is 181 bundles per year. Given a per household consumption of Rs 38,200 per year, this translates into an average drop of 0.81% in annual consumption.
Could it be the case that this average effect conceals large distributional effects? How would the costs vary across poor and rich households? The distributional impact is not a priori obvious. On the one hand, the poor have a lower shadow wage. So the total impact on the poor will be lower. On the other hand, their consumptions are also lower, so the proportional effect is not clear. Since firewood use is inelastic with respect to wealth increases, the poor will rely proportionately more on firewood, though less in absolute terms. This suggests that the poor will be more
adversely affected. On the other hand, their shadow wage is lower, so the overall proportional effect is unclear.
For each household we compute the proportional income loss by multiplying the shadow wage with the increased collection time associated with the same level of collections, and then express this as a proportion of their estimated permanent income (the predicted income from the
household production function, using their current labour supply). Figure 15 shows a
nonparametric (Gaussian kernel) regression of estimated proportional income loss against per capita potential income. The loss is higher for the poor: the loss is decreasing monotonically with respect to income (except at the very top end). But even for the poorest, the loss is less than 1%. Table 7 controls for other characteristics presents the parametric regression of estimated
proportional income loss against household potential income. Both regressions show that the loss is bounded above by 1%. If collection times rose by two hours instead of by one hour, the
welfare loss would be bounded above by 2% of current consumption.
The magnitude of the local externality on living standards is thus remarkably small, assuming that current collection activities give rise to increases in future collection times on a scale similar to those observed in the past. In any case, it is unlikely that households in neighbouring villages would expect future increases in collection times to be substantially larger than what they have observed in the past quarter century. Hence the local externality perceived by villagers is likely to be very small. This provides a possible explanation for the absence of any significant
collective action or concern among villagers to conserve forest use.
What about the impact on other dimensions of household living standards, such as leisure, child labor or gender allocation of household tasks? How exactly are households likely to adapt to higher collection times? Tables 8 and 9 show the effects on firewood use and on total time spent collecting. Wood use declines by 14%, averaging across all households; the cutback tends to rise with wealth: for the bottom (rep.) top quartile it falls by 10% (resp. 19%). This reduction is less than the increase in collection time per bundle, implying that total time spent collecting rises, as shown in Table 9, by about 14% on average, with a larger increase for poorer groups
(presumably because wealthier groups substitute into LPG to a greater extent).
need to separately add effects on time spent collecting fodder. We also found negligible effects on incomes
In order to estimate how this increased collection time is divided among members of the household, we estimated regressions for time allocation of male adults, female adults and children between household work, productive work and (firewood and fodder) collection
activities, with respect to the same set of regressors as in Table 4.28 For the sake of brevity we do not show these regression results. We use these regression coefficients to estimate the impact of an hourly increase in collection times per bundle on labor allocation of women and chldren, shown in Table 10. Collection time was not a statistically significant determinant of time
allocation of adult males, so we do not show any predictions for them. Collection times impacted time allocation only for adult females, who are likely to bear the brunt of the increased forest degradation: of the average increase in 91 hours annually for each household in collection
firewood, 68 hours is predicted to come from women. In addition, women are predicted to devote 43 hours more annually to household tasks, and withdraw 122 hours from productive tasks. Aggregating across all categories of work, however, total hours worked by women is not predicted to increase. Similarly, there is almost no effect on total hours worked for children, as well as its allocation across different activities. Hence forest degradation is not predicted to increase child labour or women’s labour; only a reallocation of women’s time.
6. POLICY OPTIONS: LPG SUBSIDIES
The previous sections have argued that degradation of the mid-Himalayan forests adjoining villages with human settlement is likely to be aggravated in the future owing to continuing anthropogenic pressures. This is likely to exert a limited impact on the livelihoods of
neighbouring residents, which possibly explains any lack of effort among local communities to limit forest use. Hence the argument for external policy interventions rests on the importance of the non-local ecological externalities involved. If the scientific evidence suggests the ecological effects on soil erosion, landslides, and water flowing into the Ganges and Brahmaputra basins are significant, there is a need to consider policies that may reduce the dependence of households on neighbouring forests.
Given the lack of any significant social norms, local collective action or state monitoring activities regulating forest use, successful interventions must act through their effect on individual household incentives to use firewood and fodder. The regression results in Table 4 showed that use of firewood is related significantly to the cost of LPG. We also saw earlier that LPG is the only principal alternative primary source of household energy; kerosene and
electricity are used only as secondary sources of fuel. Lack of reliable supply of electricity is often mentioned as the main reason why they do not rely more on electricity. The average
number of hours per day that electricity was reported to be available was 14 hours in the summer and 11 hours in the winter. Only 20 households in the entire sample used kerosene as a primary source of fuel, despite the fact that practically every household purchased and used kerosene (mainly for lighting purposes). The average per capita annual income of those using kerosene as a primary fuel was Rs 9614, compared with Rs 8036 for those using wood as primary fuel, and Rs 14060 for those using LPG as primary fuel. This indicates that the cost of kerosene was a factor for poor households in deciding to use wood as their primary fuel. Other factors also
28
played a role in household’s preference for LPG over kerosene, as reported in household interviews.29 Hence LPG subsidies represent one conceivable policy option for halting forest degradation. In this section we explore their effectiveness in curtailing household reliance on firewood, and the fiscal costs they may entail.
To get a better sense of the energy substitution between firewood and LPG, we can look at the separate per capita wood use regressions for summer and winter seasons displayed in Table 4. LPG is primarily a source of cooking fuel, while firewood serves both as a cooking fuel and source of heat. There are virtually no substitutes for firewood as a source of heat in the winter months, while the demand for cooking fuel extends the whole year. Hence one would expect greater substitutability with respect to LPG during the summer. This is precisely what we see in Table 4: the coefficient with respect to LPG price alone in the summer is -.05, against -.03 in the winter. The substitution effects with respect to the cost of collecting wood (with the exception of the interaction of collection time with education) are also stronger in the summer.
Table 11 shows estimated effects on annual per capita firewood use of a Rs 100 and Rs 200 subsidy per cylinder of LPG for different quartiles as well as for the entire distribution, broken down into summer and winter. The cutback in wood use is predictably larger in the summer, but the magnitude of the elasticity for either season is striking: 38% and 55% respectively, averaging to a 44% increase for the year as a whole. Interestingly the effects are felt in all quartiles, not just among the wealthy: even for the poorest quartile the change in annual use is 37%. In short, LPG price cuts are expected to have large effects on use of firewood, quite unlike the effect of
increased collection times by one or two hours. And they will affect the behaviour of households across the board, not just the wealthy.
To estimate the fiscal cost involved, Table 12 reports a random effect tobit regression for annual per capita LPG use, which incorporates both whether or not a household will use LPG, as well as the extent of use for those who do. The tendency to switch to LPG is higher among those with higher fixed incomes, smaller households, more education, land and small livestock, and less among those with more big livestock. These patterns are more pronounced when firewood collection times are higher. LPG use is also related to the cost of LPG (with a Rs 200 subsidy inducing a rise in LPG use by 4.4 cylinders per capita per year), and whether its availability is irregular. All these results are consistent with the notion that households are trading off the costs of time spent collecting firewood against the pecuniary costs (and reliability in supply) of LPG. Table 13 uses these results to predict the effect of LPG subsidies on LPG use. A
Rs 100 subsidy per cylinder is predicted to raise the fraction of households using LPG from 7% to 36%. A Rs 200 subsidy will raise this proportion to 78%. For those in the bottom three quartiles currently using LPG, the Rs 100 subsidy will raise their LPG use significantly, though
29
These reasons were as follows: (i) the availability of kerosene through government distribution outlets is intermittent; (ii) transportation and spillage of kerosene is a greater problem; (iii) kerosene stoves are noisier; (iv) cooking vessels turn black when kerosene stoves are used; (v) LPG burners are easier to operate and maintain than kerosene stoves; (vi) once an LPG cylinder is acquired it can be used for 3 months, whereas kerosene has to be procured repeatedly.