HAL Id: hal-02787511
https://hal.inrae.fr/hal-02787511
Submitted on 5 Jun 2020HAL is a multi-disciplinary open access
archive for the deposit and dissemination of sci-entific research documents, whether they are pub-lished or not. The documents may come from teaching and research institutions in France or abroad, or from public or private research centers.
L’archive ouverte pluridisciplinaire HAL, est destinée au dépôt et à la diffusion de documents scientifiques de niveau recherche, publiés ou non, émanant des établissements d’enseignement et de recherche français ou étrangers, des laboratoires publics ou privés.
Plasticity of mammary epithelial cells in response to
cyclic activation of EMT inducers (and circadian genes)
in physiology and pathology
William Taylor
To cite this version:
William Taylor. Plasticity of mammary epithelial cells in response to cyclic activation of EMT inducers (and circadian genes) in physiology and pathology. Other [q-bio.OT]. 2018. �hal-02787511�
Plasticity of mammary epithelial cells in response to
cyclic activation of EMT inducers (and circadian genes)
in physiology and pathology
UMR 935
Campus du CNRS
Bâtiment A
7, rue Guy Moquet
94801 Villejuif Cedex
Training supervisor : Hervé Acloque
Tutor : Pascale Quignon
TAYLOR William Université de Rennes 1 UFR SVE Master 2 Biologie Moléculaire et Cellulaire
Année 2017-2018
Contents
AcknowledgementsAbbreviations and commercial denominations
Introduction………...1 Materials and methods……….4 Results………...5 Discussion……….. References……… ……… ? Résumé long
Abbreviations and commercial denominations
TGF-β : Tumour growth factor β TNF-α : Tumour necrosis factor α IL-6 : Interleukin 6
SNAI1 : Snail family trancriptionnal repressor 1 ZEB1/2 : Zinc finger E-box binding homeobox 1/2 EMT : Epithelial to mesenchymal transition MET : Mesenchymal to epithelial transition CSC : Cancer stem cells
DAPI : Diamidinophenylindole PBS : Phosphate buffered saline
Introduction
The epithelial to mesenchymal transition (EMT) is a process through which cells shift their properties, losing strong cell-cell adherence and gaining migratory capacities. This process can be reversed by a mesenchymal to epithelial transition (MET). Cells don’t always undergo a full transition from one phenotype to the other, rather there exists a spectrum of cellular phenotypes ranging from fully epithelial to fully mesenchymal (Nieto et al. 2016). Cells which have undergone partial EMT are associated with increased stem/progenitor functions (Forte et al. 2017, Pastushenko et al. 2018). These processes play key roles both in physiology and pathology. Indeed, the trans-differentiation of epithelial cells into mesenchymal cells is involved in embryonic development, post-natal tissue repair and regeneration, wound healing, fibrosis and cancer (tumour invasion and metastasis).
Figure 1. Transitions through the different states along the EMT spectrum
From M. Nieto, R Huang, R Jackson and JP Thiery. 2016
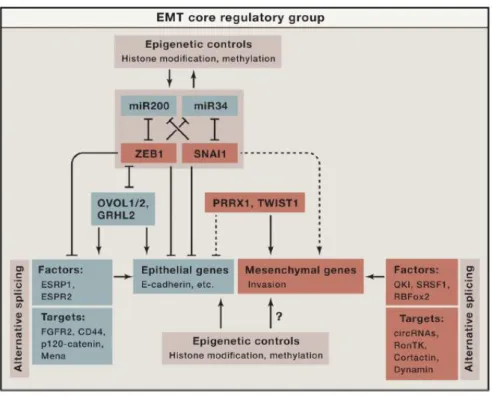
Epithelial tissue constitutes a large part of the organism, and thus these processes must be tightly regulated to preserve tissue integrity. EMT induction happens in a context dependant manner, triggered by extracellular stimuli via surface serine/threonine kinases, WNT signalling and cytokine receptors. Downstream regulation happens at different levels to form a complex web. Core EMT genes are regulated by EMT-transcription factors (TF) such as SNAI1, SNAI2, ZEB1, ZEB2 and TWIST1. A regulatory loop is formed between these TF and various micro-RNAs. The two most studied interactions are the double negative feedback loops that exist between miR-200c and Zeb1, and between miR34 and SNAI1. Epigenetics and transcript processing are also said to play a key role in the control of the EMT process.
Figure 2. The core regulatory machinery of EMT
From M. Nieto, R Huang, R Jackson and JP Thiery. 2016
Breast cancer is the most common malignancy worldwide, with the vast majority of deaths due to metastatic progression. The EMT process, as described previously, is widely acknowledged as playing a fundamental role in metastasis. It is proposed that cancer cells can dissociate themselves from the primary tumour and acquire migration and invasive capacities through EMT. These cells can then disseminate throughout the body and seed metastases through MET. The mechanisms by which breast cancer may appear are not yet known, however, it is believed that repeated unresolved inflammation can be a strong mediator of carcinogenesis by promoting tumour formation, angiogenesis and metastasis. The inflammatory microenvironment can be described as a cocktail of infiltrating immune cells, such as dendritic cells and tumour associated macrophages, and activated resident cells such as cancer associated fibroblasts or endothelial cells. These cells secrete diverse cytokines, chemokines and growth factors. Several of these cytokines are potent EMT mediators and are also able to promote the formation of breast cancer stem cells (BCSCs). Among these cytokines, the ubiquitous transforming growth factor-β (TGF-factor-β) plays a major role in the regulation of proliferation, differentiation, migration, immunity and apoptosis. TGF-β is described to have dual functions in the tumour setting: during early stages, it exerts a cytostatic influence, but during later stages it contributes to progression. In breast cancer there is evidence that TGF-β leads to an elongated cell shape, low E-to-N-cadherin ratio and vimentin expression. Interleukin-6 (IL-6), produced both by activated fibroblasts, macrophages and breast cancer cells, stimulates growth and invasiveness of MCF-7 cells in vitro. IL-6 also drives BCSC self-renewal. In breast cancer it leads to JAK2/STAT3/SNAI1 activation, a decrease in E-cadherin and an increase in vimentin, N-cadherin and fibronectin expression. Tumour necrosis factor α (TNF- α) also stimulates growth and invasiveness in vitro. In MCF-7 cells, it promotes migration and invasion. In breast cancer TNF-α signalling leads to altered mRNA expression of SNAI1, ZEB1, E-cadherin, fibronectin, vimentin
and TGM2. High levels of TGF-β, TNF-α and/or IL-6 in patients is predictive of a poor prognosis, with a higher tumour grade and a likely presence of metastases.
Genetic predispositions can also contribute to the development of breast cancer, some of which can be linked to the EMT. Around 30% of all patients suffering from breast cancer have familial predispositions. These cases are associated with a number of high-, moderate- and low-penetrance susceptibility genes. Amongst the identified high penetrance genes stand BRCA1 and TP53 as well as BRCA2 and PTEN (S.E. Filippini, A.Vega. 2013). BRCA1 is a multi-functional protein mainly known for it’s tumour suppressor properties. It’s mutation in patients predisposes them to mammary and ovarian cancer. While its main role is to ensure genomic integrity by favouring DNA repair mechanism through homologous recombination (HR), Brca1 status has been linked to the metastatic potential of breast cancer cells. Indeed, BRCA1 mutations are accompanied by an upregulation of cytoskeletal markers such as vimentin and β-catenin, an upregulation in EMT transcription factors such as SNAI1/SLUG and TWIST and a down regulation of E-cadherin (Sengodan et al. 2018). The tumour suppressor protein TP53 has long since been hailed as the guardian of the genome. It now seems that it also plays the role of “epithelial guardian”. Indeed, experiments have shown that TP53 regulates EMT-MET plasticity by modulating miR-200c. TP53 mutation leads to a decrease in miR-200c levels, lifting its inhibition of ZEB1 and therefore enabling E-cadherin repression. In MCF12A cells, TP53 knockdown leads to an EMT phenotype instead of their usual cobblestone-like epithelial appearance (Chang et al. 2011).
The fate of a cell along the epithelial/mesenchymal spectrum is primarily determined by gene expression patterns. Depending on transcription factor activity, these patterns can be reversed at any time. However, in certain conditions repeated EMTs can lead to stable changes in the cells, affecting their entire lineage. One such example is the accumulation of de novo epigenetic modifications at biologically relevant sites in premalignant cells (Dumont et al 2008). In vitro, proliferating cells undergoing TGF-β induced EMT suffer mitotic abnormalities. The result of these abnormalities can be permanent changes to cell ploidy and genomic heterogeneity which can contribute to tumour progression (Comaills et al. 2016). We hypothesise that such cycles can also significantly impact the stemness of HMECs. Indeed EMT has been described to modulate mammary epithelial cells stemness due to similar gene expression profiles in cells undergoing EMT and stem cells, including up-regulation of SNAI1 and ZEB2. In vitro studies of TGF-β induced EMT have also revealed that it leads to the emergence of CD44+CD24- cells (Morel et al. 2008). These cells are reported to possess classic stem cell features and tumorigenic properties.
Here we enquire on the phenotypic consequences of cytokine-induced cycles of EMTs and METs on epithelial mammary cells. The object is to determine whether repeated EMT/MET cycles can have a lasting effect on these cell’s plasticity, and whether TP53 or BRCA1 mutations can modulate their response.
Materials and methods
Cell lines and culture conditions
The immortalized non-tumorigenic human mammary epithelial MCF10a cells (ATCC, CRL-10317) were cultured in DMEM/F12 (Gibco Thermo Fischer) supplemented with 5% horse serum (Sigma), 10ng/mL cholera toxin (Sigma), 10µg/mL insulin (Sigma), 0.5µg/mL hydrocortisone (Sigma), 20ng/mL human recombinant epidermal growth factor (StemCell Technologies), 1% Penicillin/Streptomycin (Gibco), 1% L-Glutamine (Lonza), and kept in a 5% CO2 atmosphere at 37°C. Medium was renewed every two days on average.
shRNA TP53 and Brca1 knockdown
Lentiviral particles were produced by transient transfection of 293T cells using FuGENE HD (Promega) reagent and 2nd generation lentiviral system. In details, a 100mm dish of 70-80% confluent 293T cells
were transfected by the vector mix (6µg psPAX2, 3µg pMD2.G and 10µg of plasmid). About 14-16h post-transfection media was replaced with 10mL basal DMEM/F12 media and the cells were grown for 48h. The virus particle containing media was collected, centrifuged at 2000g for 5 min and filtered through 0.45µm low protein binding membrane. For transduction, 60mm dishes containing 500 000 MCF10A cells were incubated overnight with 2mL of 1:1 mix of viral particle containing media and complete culture media. 2 days post transduction puromycine selection of stably transduced cells was started using a 5µg/mL concentration.
EMT/MET cycles
MCF10a cells were seeded at a density of 500 000 cells per 60mm culture dish, in complete media as described above. To induce EMT, cytokines were added to the media: TGF-β (5ng/mL) alone or in combination with TNF-α (10ng/mL) and/or IL-6 (10ng/mL). Cells were treated over a four day period. In order to induce MET, cells were cultured without cytokines for four days in between each EMT treatment phase. Media was systematically renewed every two days.
Flow cytometry
Stained cells were analysed by flow cytometry (MACSQuant ® analyzer 10, Miltenyi, Bergisch Gladbach, Germany). Data were analysed with FlowJo software (Tree Star, Ashland, OR). Freshly harvested cells were first stained with LiveDead for 20 minutes in obscurity. The cells were then either stained for EMT markers, E-cadherin and fibronectin, or for stemness markers, CD24, CD44 and CD49f. For the EMT markers, the cells were first stained with PE-conjugated anti-E-cadherin (Biolegend 324106) for 20 minutes at 4°C. The cells were then fixed using 1% PFA and permeabilised using 0.1% PBS-Triton X-100 before staining with APC-conjugated anti-fibronectin (ref??) for 20 minutes at 4°C. For the stemness markers, the cells were stained with APC-cy7a-conjugated anti-CD24 (Biolegend 311132), APC-conjugated anti-CD49f (ref??) and PE-conjugated anti-CD44 (BD Pharmingen 555479)
for 20 minutes at 4°C. For analysis, events were gated to single live cells. Positivity thresholds were set using unmarked unfixed cells for stemness markers and unstained fixed cells for EMT markers.
qPCR
Total RNA was extracted using the PureLink RNA kit (Invitrogen) according to the manufacturer’s instructions. cDNA synthesis was performed using High-Capacity cDNA Reverse Transcription kit (Applied Biosystems) with Oligo(dT) primers (Thermoscientific). 500ng of RNA were used for transcription. Real-time qPCR was performed with Quantstudio 5 (96 well format, Applied Biosystems) using FastStart Universal SYBR Green Master mix (Roche). Samples were used in replicates and melting curve analysis was performed for each run. Final results were expressed as relative mRNA levels calculated with the ΔΔCt method:
Immunofluorescence staining
Cells grown on 0.1% gelatine coated cover slips were fixed using a 1% paraformaldehyde at 4°C. Permeabilization was performed for 20 minutes at 4°C using a 0.1% Triton X-100 PBS solution. Non-specific antigen binding sites were blocked with a 0.1% Triton, 1% FBS PBS solution for 1 hour at room temperature. Cells were then incubated with anti-CDH1 (Santa Cruz SC21791, 1/200), anti-Oct4 (Santa Cruz SC8628, 1/400), Snai1 (Cell Signaling 3879T, 1/400), Zeb1 (1/400),
anti-Fibronectin (ref, 1/500) and anti- α-Tubulin (ref, 1/500) antibodies overnight at 4°C. After washing, cells were incubated with secondary antibodies for 60min and the nuclei were stained with DAPI for 10 minn which was also washed with PBS later. The stained cover slips were then fixed onto glass slides using Dako fluorescence mounting medium and stored away from light at 4°C. Imaging was performed using a Nikon eclipse 90i microscope coupled with a c-HGFIE precentered fiber illuminator and a Ds-Qi1Mc camera head. The images were saved as .jpg files with an RGB color space.
Abnormal nuclei quantification
Using the fiji software, images of DAPI stained nuclei were first split into red green and blue. Only the blue channel, containing the most information, was kept for the rest of the process. The images were then smoothed using gaussian blur with a sigma value set to 4 and the background was subtracted using a rolling value of 50. Next the images were thresholded to convert them to binary black and white pictures. Any holes that appeared in the nuclei were then filled and nuclei that were fused by the thresholding were separated using the watershed function. The resulting nuclei were counted using the “analyse particles” function. The transformed images as well as numbered nuclei outlines were saved.
ΔΔCt= (2- ΔCt(test))/(2-ΔCt(control)), where
Due to the strong variability in abnormal nuclei shapes and sizes automated counting proved to be unreliable. Therefore, the abnormal nuclei were counted by visual appreciation, using an overlap of the original images and the numbered nuclei outlines. This enabled us to keep track of which nuclei were counted as abnormal for future reference. The proportion of abnormal nuclei is expressed as the percentage of nuclei counted by fiji that were also manually counted as abnormal.
BRCA1 and TP53 immunofluorescence quantification
Using the Fiji software, images of cells stained for TP53 or BRCA1 were split into red green and blue channels. The channel which contained most of the information was kept for the next steps. Images were then converted to grey scales, their background was subtracted with a rolling value of 50, and a duplicate was created. The duplicates were then converted to binary images. Holes were filled and fused nuclei were separated using the watershed function. These binary images were used as a pattern to analyse the particles of the grey scale images. The integrated density of each particle was then measured by fiji and the mean was determined. For each cell line three different fields were counted and the overall mean was calculated.
Results
To be able to analyse the impact of BRCA1 and TP53 loss on the response of mammary epithelial cells subjected to cyclic EMT and MET induction, we first had to establish stable knockdowns for these genes in MCF10A cell lines. Two different shRNA constructs were used for both genes, using a pLKO1 backbone. Cells transfected with an empty pLKO1 backbone were used as a control. After transfection and puromycine selection of positive cells, we assessed the knockdown efficiency of each shRNA. To this end RNA was extracted for RT-qPCR quantification, and cells were seeded onto cover slips for immunofluorescence staining. Results show that the #3753 and #3754 shRNA constructs both led to a greater than 60% decrease in TP53 mRNA and protein levels (Fig. 3B, 3D, 3F). The #4984 and #4987 shRNA’s BRCA1 knockdown efficiency was more contrasted. BRCA1 mRNA levels were almost totally abolished by the #4984 shRNA. The effect of the #4987 shRNA was milder with a roughly 60% mRNA decrease (Fig. 3B, 3E, 3F). However, immunofluorescence analysis indicated a 50% decrease in BRCA1 protein levels for both the #4984 and #4987 shRNAs.
TGF-β, TGF-β + IL-6 or TGF-β + IL-6 + TNF-α cytokine treatments are potent EMT inducers
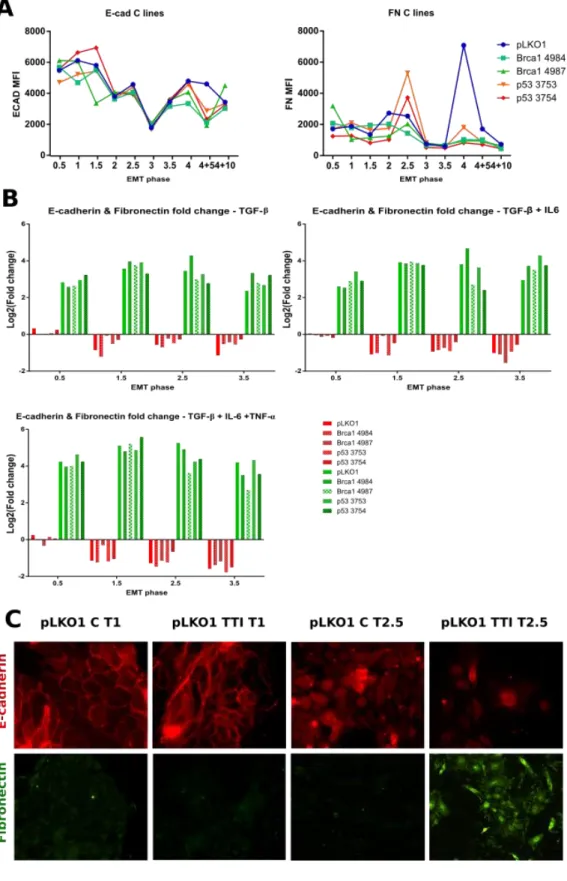
To investigate the influence of cyclic activation of EMT on the mammary epithelial cell plasticity we proceeded to treat MCF10A cells with different cytokine combinations (Fig. 4). We either used TGF-β on its own (T), in combination with IL-6 (TI), or in combination with IL-6 and TNF-α (TTI). As stated in the introduction, each of these cytokines have been shown to have pro-EMT and pro-stemness effects in breast tissue. Studying their different combinations gives us a chance to identify specific consequences and potential cumulative effects on epithelial mammary cells. After each EMT induction, some of the cells were harvested and either analysed by flow cytometry or frozen for further DNA and RNA extraction and analysis. We first had to verify that the EMT induction had worked. The fluctuation of E-cadherin and fibronectin during EMT has been extensively described. E-cadherin levels drop, and fibronectin levels rise as the cells shed their epithelial properties in favour of a mesenchymal phenotype. We therefore used these two proteins as markers of EMT. There are however experimental fluctuations in E-cadherin and fibronectin levels in untreated cells (Fig. 5A). Immunofluorescence images also underline the heterogeneity of the control cells with a marked decrease in E-cadherin expression in the T2.5 cells compared to T1 (Fig. 5C). This seems to be greatly dependent on cellular confluence and E-cadherin signal can still be observed where clear cell-cell junctions are present. Furthermore, the decrease in E-cadherin observed from T1 to T3 in control cells was consistent across all cell lines indicating that a change in the culture conditions could be responsible. To take these fluctuations into consideration and simplify data interpretation, protein expression variation is represented here as fold changes relative to their respective controls at each cycle phase (Fig. 5B). Each EMT induction was successful with a strong increase observed for fibronectin and a somewhat more subdued decrease of E-cadherin. It is worth noting that for all three experimental conditions, loss of E-cadherin was very limited during the first EMT induction (Fig. 5B, EMT phase = 0.5). Immunofluorescence analysis of the cellular
phenotype was performed in order to confirm the cytometry data (Fig. 5C). MCF10A pLKO1 cells are shown here, with no treatment or with TGF-β, IL-6 and
TNF-α (TTI)
. They are representative of what we observed for the other cell lines and treatment conditions. The images show an absence of fibronectin and an abundance of E-cadherin in control cells, located primarily along the cell-cell junctions. In TTI conditions there is a strong induction of fibronectin, the cells lose their cobblestone-like appearance, spread out and assume a spindle-like morphology. When looking at the difference between cells in T, TI or TTI conditions, there seems to be a cumulative effect of the cytokines: the fold changes observed for E-cadherin and fibronectin in T conditions are lower than those observed in TI and TTI conditions.EMT/MET cycles can increase or decrease stem-like cell populations in a cytokine-specific and mutation-specific manner
Having shown that T, TI and TTI experimental conditions reliably induce EMT in our different cell lines, we next looked at the fluctuations in cell populations which have been associated with stemness in the litterature. CD44+CD24- cells have been reported to possess stem-like properties. These markers are present on cancer stem cells (CSC) in various malignancies including breast cancer. CD49f is also reported to be expressed by many breast cancer stem cells and has been associated with increased aggressiveness. In control MCF10A cells, our data shows an enrichment in CD44+CD24- cells in the MET phases from T4 onwards (Fig. 6C). This enrichment remains visible ten days after the last EMT phase and does not seem strongly influenced by the nature of the cytokines used for EMT induction. In comparison, TGF-β treatment on its own is accompanied by a higher increase in CD44+CD24- cells in BRCA1 and TP53 knockdown cells (Fig 6A, 6B). The response of the knockdown cells to TI and TTI treatments also differ from what we observed in control cells. They initially show increased levels of CD44+CD24- cells compared to the control, but after three cycles of EMT/MET, this effect is lost and there no longer seems to be any real distinction between untreated cells, or cells treated with TI or TTI cytokine combinations (Fig. 6A, 6B).
In our control cells, the cytokine treatments had little to no effect on the proportion of CD49f+ cells present in the MET phases (Fig7C). In TP53 knockdown cells, TTI treatment was consistently accompanied by a moderate increase in CD49f+ cells from T4 onwards, with no return to control levels ten days after the last EMT phase (Fig 7A). The 4984 BRCA1 knockdown showed a strong increase in CD49f+ cells from T4 onwards upon TTI treatment (Fig. 7B). This effect was strongest ten days after the last EMT induction. In contrast, TTI treatment showed no effect in the 4987 BRCA1 knockdown, but TI treatment was accompanied by an increase in CD49f+ cells from T4 onwards which remained stable ten days after the last EMT induction. In view of this data, it seems that a decrease in either TP53 or BRCA1 can lead to an increase of stem-like cell populations during MET phases. Though this effect seems to require cellular exposure to TGF-β, TNF-α and IL-6 in cells deficient for TP53, the BRCA1 knockdown cells did not have a uniform response.
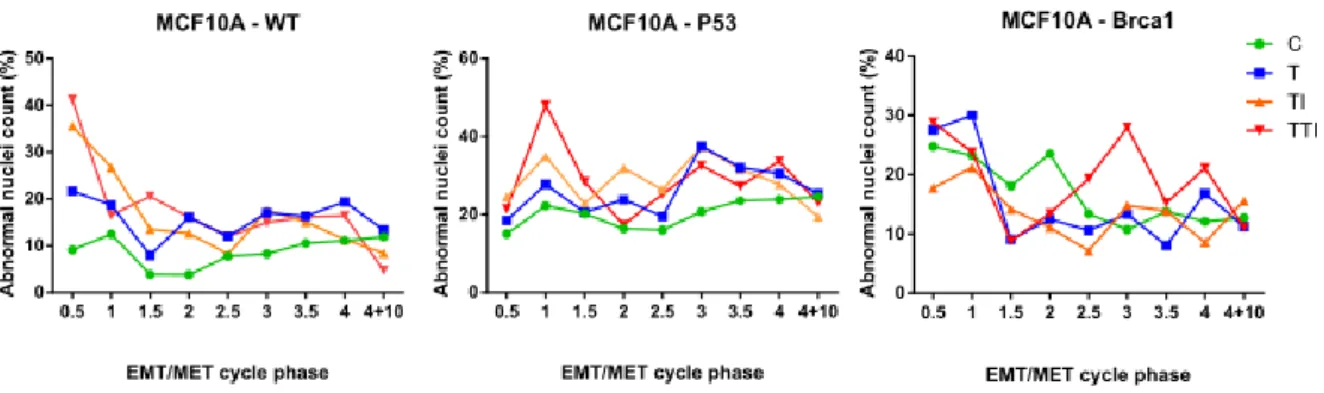
EMT/MET cycles can increase nuclear abnormalities
It has previously been shown that cells capable of proliferating while undergoing EMT in response to TGF-β are likely to sustain mitotic abnormalities which translate into nuclear defects (Comaills et al. 2016). During a previous experiment in which wild type, TP53 mutant of BRCA1 mutant MCF10A cells where subjected to EMT/MET cycles as described above, we observed a seemingly high proportion of abnormal nuclei. To investigate whether EMT/MET cycles were really impacting the proportion of abnormal nuclei, we performed quantification on images of DAPI stained cells in the different phases of the EMT/MET cycles. We found that there was indeed an increase in the proportion of nuclei presenting visual abnormalities such as micronuclei and polylobed nuclei. In wild type MCF10A cells, EMT/MET cycles initially increased the proportion of abnormal nuclei. TI and TTI conditions led to the most nuclear abnormalities, increasing the control baseline four-fold during the first EMT induction. However, from the second EMT onwards, little difference can be observed between treatment conditions, with abnormal nuclei counts averaging around 20%. TP53 mutant MCF10A cells presented twice as many nuclear abnormalities in control conditions as wild type cells, reaching an average of 20%. T, TI, or TTI treatment conditions further increased this proportion with no discernible difference between them. Though BRCA1 mutant cells seem to have an increased proportion of abnormal nuclei compared to wild type cells, they did not seem to be influenced by treatment conditions in the same way as wild type cells or TP53 mutants. Ten days after the last EMT induction, the proportion of abnormal nuclei was identical in cells having undergone EMT and MET cycles and in control cells. It’s therefore seems that although EMT and MET processes can increase nuclear defects, they don’t have a lasting effect. It remains to be seen whether these visual defects translate into genomic aberrations which could trigger oncogenesis in the breast tissue.
Figure 3. shRNA knockdown of p53 and BRCA1. A. pLKO1-puro backbone construct B, C. p53 and
BRCA1 relative mRNA levels obtained by RT-qPCR. D, E, F. Immunofluorescence images and quantification of p53 and BRCA1 protein levels.
Figure 4. Experimental design for cyclic induction of epithelial to mesenchymal and mesenchymal to epithelial transitions.
Figure 5. E-cadherin and fibronectin are differentially expressed in MCF10A cells treated with TGF-β (T), TGF-β and IL-6 (TI) or TGF-β, TNF-α and IL-6 (TTI). A. Variation of E-cadherin and fibronectin protein
expression in untreated cells, determined by flow cytometry. B. E-cadherin and fibronectin MFI fluctuation during EMT phases in T, TI or TTI treated cells relative to untreated cells. C. Representative images of E-cadherin and fibronectin expression during MET (T1) and EMT (T2.5) in untreated cells or in TTI treated cells.
Figure 6. Abundance of CD44+CD24- cell populations in MET phases is dependent on the cell line and EMT inducers. CD24+CD24- cells were identified by flow cytometry. Data are expressed as relative
change in positive proportion during MET compared to EMT, and compared to untreated cells. A. In TP53 knockdown cells. B. In BRCA1 knockdown cells. C. In pLKO1 control cells.
Figure 7. Abundance of CD49f+ cell populations in MET phases is dependent on the cell line and EMT inducers. CD49f positive cells were identified by flow cytometry. Data are expressed as the
relative change in positive cell proportions during MET compared to EMT and compared to untreated cells. A. In TP53 knockdown cells. B. In BRCA1 knockdown cells. C. In pLKO1 control cells.
Discussion
In conclusion our data suggests that in vitro EMT/MET cycles provide a favourable context to the appearance of cells with stem-like features in mammary epithelial cells. We showed that EMT induction was followed by an increase in CD24-CD44+ cells in control MCF10A cells irrespective of the cytokines that were used. However, when the cells lose TP53 or BRCA1, this effect is inconsistent. TP53 and BRCA1 knockdown cells respond in a more heterogeneous manner to TGF-β, TGF-β and IL-6 or TGF-β, TNF-α and IL-IL-6. In the knockdown cells repeated EMT/MET phases lead to a loss of the CD24-CD44+ induction upon TI or TTI treatment. T treatment however has the same pro-stemness effect on the knockdown cells as on the control cells. In all cases but one (TP53 3753 knockdown in T conditions), 10 days after the last EMT induction, the proportion of CD24-CD44+ cells had either regained a basal value or were showing a strong tendency to do so. This illustrates the capacity of these cells to become mesenchymal, acquire stem-like properties and revert to their initial epithelial state shortly after. It is these same properties which are reported to play a crucial role in metastatic progression of cancer. In contrast, CD49f+ is not strongly induced in control cells after EMT, but they are increased 1.5- to 3-fold in the knockdown cell lines and do not return to basal values for at least 10 days after the last EMT induction. This suggests that the effect on cell plasticity of EMT/MET cycles in vivo would be strongly affected by individual genetic makeup. However, there does not seem to be one particular type of response which we could associate with either P53 or BRCA1 mutations. Repeating the experiment would give more weight to the variations that we have seen. In the next steps of the project we will also be looking at the mRNA profiles for well known EMT genes which could provide more clues towards understanding the consequences of these mutations.
Résumé long
La transition épithélio-mésenchymateuse (TEM), réversible au cours duquel les cellules perdent leur polarité et leur adhérence à leurs voisines et gagnent en capacités migratoires. Ce processus et son inverse, la transition mésenchymo-épithéliale sont conservés dans différentes situations normales et pathologiques. On peut citer le développement embryonnaire, la réparation tissulaire ou bien le cancer. Effectivement, il est majoritairement accepté aujourd’hui que la TEM est le processus phare par lequel une cellule cancéreuse est capable de se détacher d’une tumeur primaire puis migrer dans les voies sanguines et lymphatiques. Ensuite, la TME permettrait à ces cellules de s’installer au sein d’une niche secondaire et ainsi former des métastases.
La TEM est régulée en premier lieu par des signaux extérieurs, principalement des cytokines. On peut citer parmi elles le TGF-β, le TNF-α et l’IL-6Via des récepteurs de surface à activité sérine/thréonine kinase, la voie WNT ou d’autres récepteurs à cytokines, elles sont capables de moduler l’expression de facteurs de transcription qui vont eux-mêmes réguler l’expression des gènes de l’EMT. On trouve parmi ces facteurs de transcription les protéines SNAI1, SNAI2, ZEB1, ZEB2 et TWIST1. Deux protéines sont communément décrites comme cible de cette régulation : les niveaux de E-cadhérine se retrouvent diminués et ceux de la fibronectine se retrouvent augmentés. En plus de ces effets, le TGF-β, le TNF-α et l’IL-6 sont décrites comme pouvant stimuler la croissance, la migration et l’invasion tumorale. Dans le contexte du cancer du sein, la mortalité est essentiellement due aux métastases. Il est donc crucial de mieux comprendre les mécanismes qui y conduisent. Dans le cancer du sein il faut aussi prendre en compte la participation de facteurs génétiques puisque 30% des patients sont atteints d’une forme familiale de la pathologie. Parmi les mutations les plus fréquentes, on retrouve TP53, BRCA1, PTEN et BRCA2. BRCA1 est connue avant tout pour son rôle crucial dans le maintien de l’intégrité génomique. Il s’avère que sa mutation pourrait aussi augmenter le potentiel métastatique des cellules en favorisant l’expression de facteurs de transcription pro-TEM tels que SNAI1 et SLUG (Sengodan et al. 2018). TP53 quant à elle a surtout été connue pour son rôle de « gardienne du génome ». Il semblerait qu’il faille y ajouter le titre de « gardienne de l’épithélium ». Effectivement, il s’avère que la mutation de TP53 conduit à une levée d’inhibition de ZEB1 qui provoque une répression de l’E-cadhérine (Chang et al. 2011).
Afin de savoir si l’induction cyclique de la TEM et la TME, ainsi que les mutations de TP53 et BRCA1 pourraient jouer un rôle sur la plasticité des cellules épithéliales mammaires, nous avons mis au point l’étude suivante. Des cellules épithéliales mammaires immortalisées MCF10A ayant subi ou non un knockdown de TP53 ou BRCA1 ont été traitées de façon intermittente et répétée avec des cytokines pro EMT. Elles ont ainsi soit reçu du TGF-β, soit du TGF-β et de l’IL-6, soit du TGF-β, de l’IL-6 et du TNF-α. Quatre traitements de quatre jours ont été effectués, séparés de quatre jours sans traitement. A l’issu de chaque phase, nous avons analysé le profil épithélial ou mésenchymateux des cellules ainsi que
des marqueurs de souchitude. Pour l’EMT, nous avons suivi l’expression d’E-cadhérine et de fibronectine. Pour le caractère souche, nous avons mesuré la proportion de cellules CD24-CD44+ et de cellules CD49+.
Les trois traitements, à savoir du TGF-β seul, du TGF-β avec de l’IL-6, ou du TGF-β, de l’IL-6 et du TNF-α, se sont tous montré efficaces pour induire la TEM. Effectivement, à chaque phase de TEM la fibronectine a fortement augmenté et la E-cadhérine a fortement diminué. Au niveau de leur morphologie, les cellules traitées sont également passées d’une organisation en plages très jointives à des cellules isolées plutôt allongées. A l’arrêt du traitement, les cellules reprennent leur aspect épithélial initial.