HAL Id: hal-02439687
https://hal.archives-ouvertes.fr/hal-02439687
Submitted on 14 Jan 2020
HAL is a multi-disciplinary open access
archive for the deposit and dissemination of
sci-entific research documents, whether they are
pub-lished or not. The documents may come from
teaching and research institutions in France or
abroad, or from public or private research centers.
L’archive ouverte pluridisciplinaire HAL, est
destinée au dépôt et à la diffusion de documents
scientifiques de niveau recherche, publiés ou non,
émanant des établissements d’enseignement et de
recherche français ou étrangers, des laboratoires
publics ou privés.
CAN WE PREDICT SELF-REPORTED CUSTOMER
SATISFACTION FROM INTERACTIONS?
Jeremy Auguste, Delphine Charlet, Geraldine Damnati, Frédéric Béchet,
Benoit Favre
To cite this version:
Jeremy Auguste, Delphine Charlet, Geraldine Damnati, Frédéric Béchet, Benoit Favre. CAN WE
PREDICT SELF-REPORTED CUSTOMER SATISFACTION FROM INTERACTIONS?.
2019
IEEE International Conference on Acoustics, Speech and Signal Processing (ICASSP), May 2019,
Brighton, United Kingdom. �10.1109/ICASSP.2019.8683896�. �hal-02439687�
CAN WE PREDICT SELF-REPORTED CUSTOMER SATISFACTION FROM
INTERACTIONS?
Jeremy Auguste
1Delphine Charlet
2Geraldine Damnati
2Frederic Bechet
1Benoit Favre
1(1) Aix Marseille Univ, Université de Toulon, CNRS, LIS, Marseille, France
(2) Orange Labs, Lannion, France
{jeremy.auguste, frederic.bechet, benoit.favre}@lis-lab.fr
{delphine.charlet, geraldine.damnati}@orange.com
ABSTRACT
In the context of contact centers, customers’ satisfaction after a conversation with an agent is a critical issue which has to be collected in order to detect problems and improve qual-ity of service. Automatically predicting customer satisfaction directly from system logs, without any survey or manual an-notation is a challenging task of a great interest for the field of human-human conversation understanding and for improving contact center quality of service. Unlike previous studies that have focused on questions directly related to the content of a conversation, we look at a more general opinion about a ser-vice which is called the “Net Promoter Score” (NPS) where customers are considered either as promoters, detractors or neutral. On a very large corpus of chat-conversations with customer satisfaction surveys, we explore several classifica-tion scheme in order to achieve this predicclassifica-tion task, only us-ing conversation logs.
Index Terms— Human-Human conversation mining, Net Promoter Score, Opinion Analysis, CNN models, Attention-based RNN models
1. INTRODUCTION
Contact centers from large companies like telephone or inter-net companies are a unique opportunity to study real human-human conversations between customers and operators.
Predicting automatically self-reported feedback to satis-faction survey after a conversation without asking customers is a very challenging scientific task of great practical applica-tion. This task was studied by previous studies in the context of human-computer interaction and call-centers satisfaction surveys [1, 2]. These studies targeted questions directly re-lated to a given conversation with an operator or a machine. In this study we look at a more general opinion about a ser-vice which goes beyond a single conversation, called the Net Promoter Score.
One of the most observed indicator in Customer Relation-ship Management is the Net Promoter Score (NPS). Beyond satisfaction, customers are asked if they would recommend
the company. In most cases, this recommendation has to be given on a scale ranging from 0 to 10. Customers who swer from 9 to 10 are considered as promoters, those who an-swer from 0 to 6 are considered as detractors and the others are considered as neutral or passive. The NPS is the differ-ence between promoters and detractors. Companies expect this difference to be positive, and to be as high as possible.
In this paper we are interested in studying to what extent the NPS could be predicted directly from conversation logs. On a large corpus of technical and commercial conversation chats, we compare several classification methods and answer the two following questions thanks to contrastive experiments and detailed performance analyses: Which metrics should be optimized in order to estimate NPS from a corpus of conver-sation logs? Can we estimate accurately the promoters and detractors distribution using only system logs?
2. RELATED WORK
In order to train classification models to evaluate customers satisfaction from system logs two kinds of supervision can be used: direct supervision thanks to self-reported customer sat-isfaction through surveys filled by customers after a conversa-tion [1, 2] and indirect supervision produced by experts from conversation logs [3, 4, 5]. For highly subjective measures such as NPS, only direct supervision through self-reported satisfaction can be used. As discussed in [1], this use of self-reported satisfaction raises 3 issues:
• only a small percentage of customers fill surveys lead-ing to a lack of annotated data with possible biases; • human rating is often asked with a 5 or a 10 levels scale,
should we consider each scale as a label, use regression instead of classification or group together scales to ob-tain labels?
• the last issue is about the feasibility of the task itself for subjective questions related to a global satisfaction which goes beyond the current conversation, such as
the NPS: do conversations contain enough objective ev-idence about these subjective opinions?
The first issue is not problematic in our case because we are using chat data: customers are more likely to click on a few boxes on a web interface after a chat than answering questions orally. Indeed a study on our corpus shows that 30% of the chat conversations have a survey, therefore we have no lack of data considering the size of the corpus we are processing in this study.
For the second issue, [1] addresses the problem of cus-tomer satisfaction prediction from call-center telephone con-versations with observations from the field of emotion anno-tation, stating that human ratings of emotion or opinion do not follow an absolute scale. Hence, they adopted the ordinal ranking paradigm in order to address the categorical scale is-sue. In this study we overcome this issue by using a mapping from rating scores to categories (detractor,passive,promoter) provided by the Customer Relationship Management field.
The last issue is one of the main motivation of this study: can we retrieve directly from conversation logs such subjec-tive opinions as NPS? By comparing results obtained by sev-eral state-of-the-art classifiers trained on very large quantities of data we will try to answer this question.
3. CONVERSATION CHAT DATA AND SURVEYS 3.1. Chat data description
Chat conversations are extracted from Orange customer ser-vices contact center logs. The corpus covers a wide variety of topics, ranging from technical issues (eg. solving a con-nexion problem) to commercial inquiries (eg. purchasing a new offer). They can cover several applicative domains (mo-bile, internet, tv). In [6], we compared these chat conver-sations with spoken telephone converconver-sations from equivalent contact centers. Even though chat conversation and telephone conversation present some obvious differences, they contain similar language register (spontaneous but formal interaction) and similar interaction properties.
From a Language Understanding point of view, process-ing spoken conversations or chat conversations both imply noisy input phenomena (ASR errors and disfluencies for the former and orthographic deviations for the latter). We have evaluated the ratio of orthographic deviations, that can be as-similated to a Word Error Rate for chat conversations. This WER is 4.3% on the overall with an unbalanced distribution of errors: about 10.1% for Customers and 1.6% for Agents. 3.2. Customer surveys
At the end of a conversation, customers have the option to fill in a survey among which can be found several questions re-garding various specific dimensions (e.g. satisfaction on the quality of explanations, advises, support, solutions,...) as well
as a more general question: "Considering your contact with our company, how likely would you be to recommend us to your friends or family?". This question reflects a general ap-preciation for which customers can express a broader feeling than the conversation per se. It is a Key Performance Indica-tor that is closely moniIndica-tored for Customer Relationship Man-agement (CRM). For this latter question, the customer is re-quired to provide an answer along a scale ranging from 0 to 10. Following CRM conventions, these appreciations can be grouped into 3 categories: detractors (from 0 to 6), passives (7 or 8) and promoters (9 or 10). Data have been collected over a one month period, and we have selected the subset of conversations for which the customer has provided an answer to all questions. The training, development and test corpora are respectively constituted of 47, 685, 15, 899 and 15, 892 conversations. The training corpus is composed of 140, 000 different tokens. As mentioned in the previous section, the originality of this study is that the annotation supervision is directly provided by the protagonist. There are as many an-notators as conversations. The large amount of training and test data with this self-reported direct supervision (almost 80k conversations) is also relatively unusual for this type of study.
4. PREDICTING SELF-REPORTED SATISFACTION In this study we consider the problem of predicting if a cus-tomer is likely to recommend the company as a supervised classification problem where a set of classifiers using differ-ent textual represdiffer-entations are trained to predict a label for each customer interaction, among the set {detractor, passive or promoter}.
We compare several classification models trained follow-ing 3 different schemes:
• 3-label classification scheme: in this scheme we use a single classifier where all the three labels to predict have the same weight;
• 2 × 2-label classification scheme: we consider here two binary (yes/no) classifiers, the first one in charge of predicting the detractor label, the second one predict-ing the promoter label; the passive label is predicted when both binary classifiers return no;
• 2-label multitask classification scheme: this is a vari-ation of the previous scheme where only one classifier is used in a multitask process; we consider the predic-tion of the detractor and promoter labels as two tasks jointly performed, when both prediction are negative, the label given is the passive label.
We define these schemes since the 3 labels to predict are not equivalent from our applicative point of view: the NPS be-ing the difference between the proportions of promoters and detractors, a confusion between these two labels or with the passivelabel do not have the same applicative impact.
We have implemented these schemes with three different state-of-the-art classification methods: Support Vector Ma-chines (SVM) with a linear kernel and a bag-of-word repre-sentation; Convolutional Neural Networks (CNN) with con-tiguous word blocks and Recurrent Neural Networks (RNN) with word and turn sequences.
For SVM the only information about the structure of the conversations that is kept is the speaker of each word. To do that, each word is concatenated with its speaker. For all exper-iments involving deep neural networks, we used embeddings of dimension 100, with no-pretraining. For the CNN model, we use the same architecture as described in [7]. We build our model with filters of size 3, 4 and 5 and 100 filters for each size. The RNN model is based on a Long Short Term Mem-ory(LSTM) model with an attention mechanism [8, 9] which allows the model to focus on the important words in each con-versation with respect to the targeted task. The hidden layers in the LSTM have a size of 128.
The 2-label multitask classification scheme is imple-mented only with the CNN and RNN classifiers. In this case, the 2 detectors are not trained independently, but trained jointly in order to share all the layers except the decision ones devoted to the specific classification.
5. EXPERIMENTS
In order to compare the different models and classification schemes, we use 4 metrics:
• accuracy: classification accuracy simply measures the percentage of correct decision;
• F1: this is the F-measure, estimated for each label l as the harmonic mean of precision P and recall R for l such as F 1(l) = 2×P ×RP +R
• macroF1: this is the non-weighted average of the F1 measure over our 3 labels;
• SER (Serious Error Rate): we consider a confusion between labels detractor and promoter being more se-riousthan one with the passive label, since the impact on the NPS will be greater; therefore we define the SER as the percentage of confusion between these two ex-treme classes.
5.1. Comparing classification methods and schemes Table 1 reports results obtained by using different types of models with different classification schemes. It can be noted that all models achieve better results than simply taking the majority class by at least 10 points on the accuracy and 26 points on the macroF1. However, the highest accuracy and macroF1 are only of 57.5% and 53.8% respectively. These re-sults are significantly lower than previous reported rere-sults on customer satisfaction prediction such as [3], however we have
to keep in mind that we are dealing here with self-reported sat-isfaction not only about a given call, but about a general opin-ion on the service and the company, making the task much harder.
The 3-label and 2-label schemes clearly show different be-haviors: the 3-label obtains the best accuracy although the 2-label favors the macroF1 and SER metrics. The 3-2-label clas-sification scheme obtains very poor results for predicting the passivelabel. This can be explained by the difficulty of mod-elling directly this passive class that is much more diverse than the other classes which should contain some explicit con-tent for justifying the positive or negative opinions.
Comparatively, all the models that use a 2-label with re-jection classification scheme greatly improve the prediction of the passive class with F1-scores ranging from 36% (CNN) to 40% (SVM, RNN). And even if the F1-scores of the other two labels are slightly lower by 3 to 6 points, the improvements on the passive class allows us to improve the macroF1 score by at least 5 points on all models. The SER is also greatly reduced by the 2-label+rejection classification scheme models.
This is an expected behavior coming from the fact that in the 3-label models any bad prediction of a promoter/detractor-labeled conversation would result in a serious error since they barely ever use the passive label, whereas the 2-label models can predict that a sample is labeled with neither promoter nor detractor. The main drawback of the 2-label models is that they get 2 (CNN) to 4 (SVM, RNN) fewer points in accuracy than the 3-label models.
Among the 2-label models, it is interesting to note that multitask and independent models achieve very similar re-sults. However, the independent models require to train two distinct models, thus it takes twice as long to do the training.
As a first conclusion we can argue that the classification scheme to choose depends on the metrics to optimize. In our case, since the NPS score depends only on the estimation of the correct proportion of detractor and promoter customers, the macro F1 and the SER are more important than the accu-racy, therefore we choose the 2-label scheme.
All classification methods for the 2-label scheme achieve rather similar performance, although CNN is slightly better in terms of macro F1.
5.2. Contrastive experiments
In a first experiment, we want to know which speaker’s turns are the most important to the task. It is expected that the client’s turn input the most information since he’s the one that will give his opinion in the survey. Macro F1 scores obtained according to the input stream are reported in Table 2. As ex-pected, the models trained using only the client’s turns get better results than the ones that use the agent’s turns, however combining agent and client turns shows a small improvement. In the second experiment, we want to evaluate the robust-ness of the different models when we limit the vocabulary size
3-label classification scheme
Model Accuracy SER MacroF1 F1 detractor F1 passive F1 promoter
majority class 42.7 30.9 19.9 - - 59.9
SVM 56.9 14.7 48.3 63.5 14.9 66.3
CNN 57.5 15.5 46.2 64.4 7.2 67.0
RNN+att 57.5 15.8 44.5 64.3 1.8 67.3
2-label+reject classification scheme
Model Accuracy SER MacroF1 F1 detractor F1 passive F1 promoter
SVM 2x2 labels 52.7 6.2 52.7 58.4 39.6 60.0
CNN 2x2 labels 55.2 7.7 53.8 61.0 36.1 64.2
CNN 2 labels multitask 55.0 7.6 53.5 59.8 36.3 64.4
RNN+att 2x2 labels 53.5 6.5 53.0 58.2 39.4 61.3
RNN+att 2 labels multitask 53.5 6.5 52.7 58.0 37.7 62.4
Table 1. Models comparison with a 3-label and a 2-label+rejection classification schemes
input/macroF1 SVM CNN RNN+att
all turns 52.7 53.5 52.7
client turns 51.1 52.3 52.5
agent turns 47.2 48.2 47.6
Table 2. Models comparison with macroF1 according to the input stream: all turns, only client turns, only agent turns
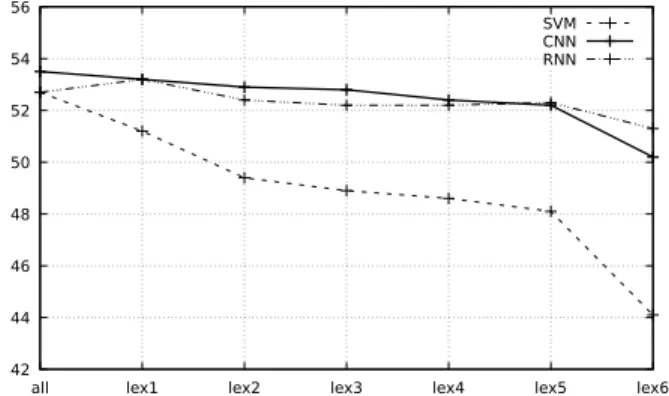
to the most frequent words. This robustness is an interesting feature as it is closely linked to the adaptation capabilities of the models to process new data from other domains. Indeed by using only frequent words, the models are less likely to be driven by topical words of a given domain. In this experiment we define several lexicons lex1 to lex6 with several vocab-ulary sizes. For an experiment with lexicon lexi, all words
that do not occur in lexiare removed from the corpus prior to
model training. Results from these experiments can be found in Figure 1. all corresponds to the whole corpus vocabulary (119165 words); lex1 contains words occurring at least 10K times (308 words); lex2, words occurring at least 20K times (173 words); lex3, words occurring at least 30K times (128 words); lex4, words occurring at least 40K times (108 words); lex5, words occurring at least 50K times (92 words) and lex6, words occurring at least 100K times (42 words).
As expected, the SVM which uses a simple bag of words as its input sees its macro F1 decrease when the size of the lex-icon decreases. However, neural networks methods are much more stable. Both CNN and RNN show very few variations in their macro-F1 scores, except on the smallest lexicon where it loses 2 points compared to the previous lexicon with the CNN and 1 point with the RNN. These results probably mean that the neural networks are capable of using more than just the presence of some words to do their predictions on this task, capturing some of the structure of the conversations.
42 44 46 48 50 52 54 56
all lex1 lex2 lex3 lex4 lex5 lex6
SVM CNN RNN
Fig. 1. Macro-F1 performance for SVM, CNN and RNN ac-cording to the lexicon size
6. CONCLUSION
We have shown in this study that self-reported satisfaction surveys can be used in a supervised classification paradigm for evaluating customer satisfaction directly from system logs. We have compared different classification schemes in order to classify each customer as detractors, passives and
promotersand shown that a 2-label scheme manages to
re-duce by 50% the amount of serious errors compared to a standard 3-label classification model (from 14.7% to 6.2% error rate). Contrastive experiments have shown that CNN and RNN methods were more robust than SVM to the reduc-tion of the input vocabulary, leading to a better generalizareduc-tion capability. Despite these good results, the general accuracy and macroF1 performance of the best models remains rather limited, indicating that there is still a lot of work to do in order to fully exploit the linguistic and interactive content of human-human conversations.
AcknowledgmentsThis work has been partially funded by the Agence Nationale pour la Recherche (ANR) through the following programs: ANR-15-CE23-0003 (DATCHA), ANR-16-CONV-0002 (ILCB) and ANR-11-IDEX-0001-02 (A*MIDEX).
7. REFERENCES
[1] Joseph Bockhorst, Shi Yu, Luisa Polania, and Glenn Fung, “Predicting self-reported customer satisfaction of interactions with a corporate call center,” in Ma-chine Learning and Knowledge Discovery in Databases, Yasemin Altun, Kamalika Das, Taneli Mielikäinen, Do-nato Malerba, Jerzy Stefanowski, Jesse Read, Marinka Žitnik, Michelangelo Ceci, and Sašo Džeroski, Eds., Cham, 2017, pp. 179–190, Springer International Pub-lishing.
[2] Jordi Luque, Carlos Segura, Ariadna Sánchez, Martı Um-bert, and Luis Angel Galindo, “The role of linguistic and prosodic cues on the prediction of self-reported satis-faction in contact centre phone calls,” Proc. Interspeech 2017, pp. 2346–2350, 2017.
[3] Atsushi Ando, Ryo Masumura, Hosana Kamiyama,
Satoshi Kobashikawa, and Yushi Aono, “Hierarchical
lstms with joint learning for estimating customer satisfac-tion from contact center calls,” Proc. Interspeech 2017, pp. 1716–1720, 2017.
[4] Shammur Absar Chowdhury, Evgeny A Stepanov, and Giuseppe Riccardi, “Predicting user satisfaction from
turn-taking in spoken conversations.,” in
INTER-SPEECH, 2016, pp. 2910–2914.
[5] Shourya Roy, Ragunathan Mariappan, Sandipan Danda-pat, Saurabh Srivastava, Sainyam Galhotra, and Balaji Peddamuthu, “Qa rt: A system for real-time holistic qual-ity assurance for contact center dialogues,” in Thirtieth AAAI Conference on Artificial Intelligence, 2016. [6] Géraldine Damnati, Aleksandra Guerraz, and Delphine
Charlet, “Web chat conversations from contact centers: a descriptive study.,” in LREC, 2016.
[7] Yoon Kim, “Convolutional neural networks for sentence classification,” in Proceedings of the 2014 Conference on Empirical Methods in Natural Language Processing (EMNLP), 2014, pp. 1746–1751.
[8] Dzmitry Bahdanau, Kyunghyun Cho, and Yoshua Ben-gio, “Neural machine translation by jointly learning to align and translate,” arXiv preprint arXiv:1409.0473, 2014.
[9] Kelvin Xu, Jimmy Ba, Ryan Kiros, Kyunghyun Cho, Aaron Courville, Ruslan Salakhudinov, Rich Zemel, and Yoshua Bengio, “Show, attend and tell: Neural image caption generation with visual attention,” in International Conference on Machine Learning, 2015, pp. 2048–2057.