HAL Id: hal-02445440
https://hal.archives-ouvertes.fr/hal-02445440
Submitted on 20 Jan 2020
HAL is a multi-disciplinary open access
archive for the deposit and dissemination of
sci-entific research documents, whether they are
pub-lished or not. The documents may come from
teaching and research institutions in France or
abroad, or from public or private research centers.
L’archive ouverte pluridisciplinaire HAL, est
destinée au dépôt et à la diffusion de documents
scientifiques de niveau recherche, publiés ou non,
émanant des établissements d’enseignement et de
recherche français ou étrangers, des laboratoires
publics ou privés.
Ethoacoustic by bayesian non parametric and stochastic
neighbor embedding to forecast anthropic pressure on
dolphins
Marion Poupard, Benjamin de Montgolfier, Hervé Glotin
To cite this version:
Marion Poupard, Benjamin de Montgolfier, Hervé Glotin. Ethoacoustic by bayesian non parametric
and stochastic neighbor embedding to forecast anthropic pressure on dolphins. OCEANS, Jun 2020,
Marseille, France. �hal-02445440�
Ethoacoustic by bayesian non parametric and
stochastic neighbor embedding to forecast anthropic
pressure on dolphins
Marion Poupard
(a,c), Benjamin de Montgolfier
(b), Hervé Glotin
(a)(a) Univ. Toulon, Aix Marseille Univ. CNRS, LIS, DYNI, Marseille, France (b) Aquasearch, Martinique, France
(c) Biosong, France
[email protected], [email protected], [email protected]
Abstract—Marine mammals are found in every sea worldwide and are at the highest level of the marine food chain. They communicate among themselves through sounds. It is complicated to study and to characterize these populations because they spend most of their time below the surface. Nevertheless, it is possible to analyze, characterize and classify different cetacean species through the use of bioacoustics. Our study focuses on the Pantropical spotted dolphin (Stenella attenuata), in particular on the influence of nautical tourism, i.e. whale-watching boats, in the Caribbean Sea on dolphin communications. The objective of this study was to observe the correlation between dolphin behaviours and whistles. The most appropriate methods had to be implemented in order to analyze ethoacoustic data. To achieve this, we compared a manual method with an automatic whistle detector. Then, we used different methods of projection (ACP and t-SNE) to reduce the dimension of acoustic data. We concluded by clustering the sounds versus the behavioural classes. The results showed that our automatic method was effective as different clusters were identified : pantropical spotted dolphin do not communicate in the same manner when they are surrounded by whale-watching boats, or during socialization. Therefore, acoustic survey is an efficient non-intrusive way to characterize the form of communication and to evaluate impacts of noise on cetaceans. Our method is effective and provides opportunities for acoustic surveys of anthropophonic pollution.
Index Terms—Ethoacoustics, t-SNE, Bayesian Non Parametric model, non linear reduction of dimensionality, PCA, whistles, cetacean, clustering, Stenella attenuata
I. INTRODUCTION
One of the best approaches of studying animals that pro-duce signals and live in an inaccessible environment is the use bioacoustics. Acoustic monitoring is a method used to study marine mammals, that gives us information to better understand cetacean life, such as their behaviour, movement or reproduction [1]. There are other methods to estimate and examine local species richness, but they are costly and
We thank Biosong SRL for the Phd funding of M. Poupard.This research has been partly funded by project Captile PACA CG TPM and pôle INP UTLN, and FUI 22 Abyssound, ANR-18-CE40-0014 SMILES, and MARIT-TIMO EUR GIAS projects. We thank MI CNRS MASTODONS SABIOD.org and EADM MADICS CNRS scaled bioacoustic research groups.
invasive [2]. This richness is represented by many species that reveal their presence through acoustic signals which can be recorded and analyzed. However, the principal problem of this method is the storage and analysis of this data, so automated analysis for captured sound is almost essential. The bioacoustic discipline is already developed in scientific research, whereas ethoacoustic is a method that combines acoustic, biology and ethology that allow us to establish a correlation between signals produced by animals and their behaviours. If we are able to access animal sounds, we will be able to access their ecology, and finally biodiversity conservation [3]. In this study we focused on the influence of whale-watching boats, in the Caribbean Sea, on the pantropical spotted dolphin (Stenella attenuata: Sa). The objective of the study was to identify the presence or not of a correlation between their behaviours and their whistles, and to develop a method to extract and analyze whistle characteristics. The number of whale-watching boats in the Caribbean Sea strongly increases every year [4]. Increases in maritime traffic, water scooters (jet skies) and whale watching may have consequences on marine life [5]. Whale-watching is a tourism activity, which consists to observe marine mammals in their natural habitat. However, for this activity, a boat is necessary and these approaches are not regulated. Currently, 25 whale-watching companies are present on the Martinique coast [4]. This study takes place in Martinique, a french island located in the Caribbean Sea (GPS position: 14 48’03N; 061 19’92 and 14 27’30N ; 061 07’70W). Marine fauna is abundant in these waters, partic-ularly marine mammals [4]. Pantropical spotted dolphin Sa is the main observed species. Protecting cetacean populations is fundamental. Therefore, it is critical to minimalize whale-watching development and to organize monitoring campaigns to maintain local tourism and the biodiversity of Martinique. To protect this population, we must know the ecology of this species, especially how they communicate. The purpose of this study was to analyze the impact of whale-watching on the whistle communication of pantropical spotted dolphin. Whistles produced in function of their behaviour and the number of boats present were compared.
Figure 1. Presentation of the study area and material (1: Hydrophone (in its protection), 2: recorder and 3: headphone).
II. DATA COLLECTION
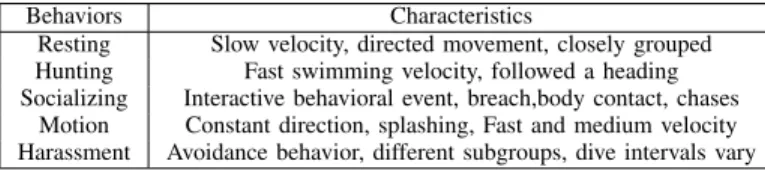
Recording samples were collected between 2013 and 2017. All recordings were conducted during morning sessions, on the West coast of Martinique (Fig. 1). The materials used: one hydrophone (H2a-XLR, Aquarian Audio Products) (1) connected to a recorder (2), and an audio headset (3) (Fig. 1). Acoustic recordings were realized at a depth of 15 m, in stereo with a sample rate of 48.1 kHz. Recordings were executed continuously from the detection of dolphins until they leaved. When a group of cetaceans is detected, a respectful approach was realized according to the "Charter of responsible approach and observation of marine mammals in Martinique". In addition to recordings, environmental data was collected such as the date, number of animals, specifying the number of adults and juveniles, as well as the behavioural state of the dolphins. Behavioural states are classified into five main categories: rest, socialization, hunting, harassment and motion (Table. I).
Table I
BEHAVIORAL STATES CATEGORIES AND THEIR DESCRIPTIONS
Behaviors Characteristics
Resting Slow velocity, directed movement, closely grouped Hunting Fast swimming velocity, followed a heading Socializing Interactive behavioral event, breach,body contact, chases
Motion Constant direction, splashing, Fast and medium velocity Harassment Avoidance behavior, different subgroups, dive intervals vary
III. DATA ANALYSIS A. Whistle tracking and feature extraction
As appose to manual extraction, an automatic method for selecting and categorizing whistles was used in order to obtain ample results and avoid user bias. Our algorithm is a spectral tracker [6]. The aim of this detector is to extract, quantify and date all whistles from a record sample. It is composed of two different parts. The first part is a binarization of the recording, and the second part is an algorithm that detects all whistle trajectories. This detector was implemented in 2012 [6]. The method presents two advantages: fast detection and increased precision in comparison to the manual method (visualizing and listening). All steps of the algorithm were conducted within the Octave Programming environment. The first step of the
Figure 2. Spectrogram of 13 seconds containing signals from Sa, and a representation of whistles identified from our detector.
algorithm is to represent the original audio signal in a time-frequency representation referred to as a spectrogram. Then, the detector analyzes each pixel from the spectrogram, and transforms it in a matrix containing 0s and 1s (binarization), where a value of one corresponds to a high amplitude. Thus, selected points have a higher intensity than the background noise of the ecosystem. In the last step, the algorithm will retain only points forming continuous trajectories on the spectrogram (Fig. 2). This last manipulation ignores ambient discontinues noise. Thus, the algorithm excludes noises such as motor noise, or wave sounds, in order to identify only signals of interest: dolphin whistles. To exclude this noise, the algorithm does not include the speed variation trajectory.
After the whistle detector, a number of acoustic parameters for each whistle was extracted:
• Minimum, maximum, median and mean frequency
• Whistle duration
• Whistle velocity (minimum, maximum, median, mean of velocity)
• Whistle acceleration (minimum, maximum, median, mean of acceleration)
For each whistle analyzed, 13 parameters were identified. Therefore, the whistles were described within these 13 dimen-sions.
B. Dimensional reduction and clustering
In order to represent the 13 dimensions, the dimensionality reduction technique t-SNE (Distributed Stochastic Neighbour Embedding) was implemented. This nonlinear dimensionality reduction is particularly well suited for the visualization of high-dimensional datasets [7]. Reduced dimensionality allows for a better visualization. In this case, data are represented in multiple dimensions, because each parameter (Start and end frequencies, duration, etc...) represents a dimension. Thus, it is possible to visualize our data in a map, and take into consideration all acoustic parameters. The representation can be in 2 or 3 dimensions. The t-SNE algorithmic process considers the similarity and dissimilarity of a data set : it cre-ates a probability distribution over pairs of high-dimensional objects. Similar points have a high probability to be close on the map, whereas dissimilar points have a small probability of being close. This representation should produce different ethoacoustic clusters.
After the previous method, it is possible to take the coordi-nates (abscissa and ordinate) of t-SNE to highlight clusters. This method allows us to validate the clusters found with t-SNE. Clustering has various applications for classification [8], allowing us to prove group compatibility according to a specific criterion [9].
In this study, we decided to do a Bayesian non para-metric clustering (BNP). Different clustering methods have been investigated for cetacean bioacoustics in [10], and they concluded BNP was optimal for bioacoustic data.
Then, we calculated NMI (Normalized Mutual Information scores), which is a measure of mutual dependence between two distributions, particularly between the true and the estimated clusters. NMI is a normalization of the mutual information (MI) score that scales the results between 0 (no mutual information) and 1 (perfect correlation between these two distributions) [11]. Essentially, cluster consistency is quantified using NMI [12].
The numerator (I) is the mutual information between X and Y, relative to clusters with a similar composition within the two partitions. The denominator depends on the entropy of each partitioning. In our case, X can be the distribution of clustering, and Y is the behavioural state (Equation. 1).
N M I(X, Y ) = I(X, Y )
pH(X)H(Y ) (1) Thus, NMI compares ethoacoustic clusters (found visually with t-SNE) versus theoretical clusters (found automatically with Bayesian non parametric clustering). The t-SNE (Dis-tributed Stochastic Neighbor Embedding) and clustering were conducted using Python programming language.
IV. RESULTS
147 minutes of recordings were analyzed, resulting in the detection of 2851 whistles. To increase the values of NMI, we used the 500 largest whistles and the 500 longest whistles. Whistle duration decreases according to the distance from the animal. Reception and intensity are positively correlated to distances from the dolphin. If the animals are too far away, some parts of the whistle are not detected. In fact, the whistle intensity is low if dolphins are far from the hydrophone, and therefore whistle duration is low too; explaining the fact that the further away from the boat, the shorter the whistle. By selecting the longest whistles, we indirectly chose dolphins close to the hydrophone.
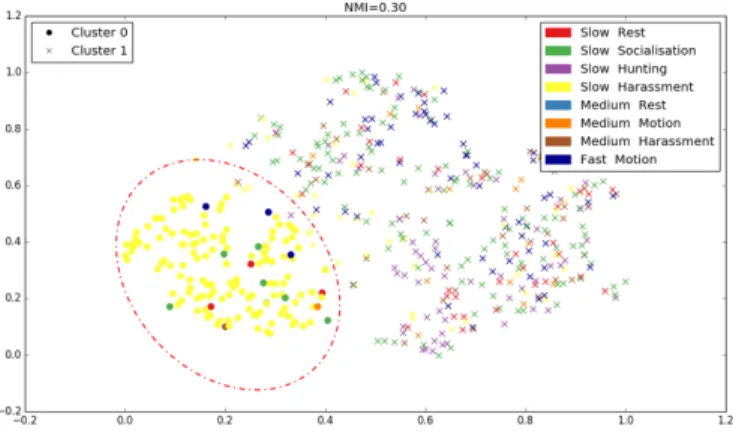
On Figure 3, we present t-SNE coordinates, and different labels: behaviours are represented by different colors, while the clusters are represented by shapes (found with the Clus-tering method). "slow", "medium" and "fast" represents the swimming velocity of dolphins. The objective is to maximize the normalized mutual information score by finding the op-timal number of clusters k. With a k =2, NMI is maximal (NMI=0.30). So, for this data set, the optimal number of clusters that maximizes the information is two. The cluster 1 is composed of slow socialization and medium harassment. These behaviours are different from the others. We are able
Figure 3. visualizing Dolphin Sa whistles (500 longest) in two-dimensions with t-SNE as a function of velocity and behaviours (with 13 important features), according to BNP clustering.
to deduct the presence of correlations between distributions of theoretical clusters (true) and distributions of ethoacoustic clusters.
V. DISCUSSION
A. Comparison between the manual and the automatic method In order to validate the automatic whistle extraction tech-nique, manual validation was realized. Using the same records, 489 pantropical spotted dolphin whistles were identified man-ually by listening to the recordings and looking at the spectro-gram. This step was made using the Program Spectrogram 5.0 (Electronics Lab, USA). Within the automatic method, series of objects were automatically recognized and parameters were extracted. Whereas in the manual method, records were ana-lyzed both visually and through listening, as the user collected parameters manually. Thus, for the exact same records, a user detected 489 whistles, whereas the automatic method recog-nized 2851 whistles (window size 512). Manual identification is time-consuming, detecting more than 489 whistles can take more than four weeks instead of one day with the automatic method, plus it is prone to error. It’s necessary to automatize the selection and the categorization of sounds. In many studies, animal sounds were detected and classified according to the auditory perception of human observers [13]. In fact, manual methods are difficult to repeat and to compare with other studies and species, due to operator bias. But, manual methods may be used to evaluate the automatic detector.
In [8], authors tested different normalization methods, and we have tested one of them. Thus, the value attributed to each feature (maximal, minimal, mean, median frequencies and duration) was log-transformed and normalized with a z-score transformation µ represents the mean and σ the standard deviation : − → fs= ln( − → Fs) (2) − → Zf s= − → fs− µf s σf s (3)
Derivatives (features 9 to 18) were also normalized with a different z-score transformation :
− → Zds= ds σs (4)
In this function, ds is the value of the feature (the derivative) and σs is the standard deviation. We removed the mean
(compared to the first function) to keep the sign of the derivative (ascendant or descendant whistles). However, after this normalization, the clusters were the same. Allowing us to conclude this kind of normalization did not modified our results.
B. Influence of surface behaviours on Sa whistles
There are many diverse factors that influence whistle vari-ation in cetacean, therefore identifying exactly which factors impact cetacean whistles and how remains mostly misunder-stood [14]. In this study we tested the behavioural influence on dolphin communication. There are variations of whistle struc-ture when the behaviour changed, particularly for harassment and socialization (Fig.3). Studies conducted on other dolphin species have already proved this affirmation [15]
Different studies have conducted analysis of dolphin be-haviours in the presence of boats [16]–[18]. Conclusions of these studies implied a faster swim, and less surface-time. Thus, we can correlate behaviours to acoustic features. [19] proved that whistle occurrence and production rates increased when boats were present in the area. [20] noted that Bottlenose dolphins emitted whistles with higher start frequencies in the presence of several boats. Therefore, it is possible to hypothesize, that when dolphins are harassed, they try to use the same acoustic communication when socializing (high frequencies and high production rates). But, it should be noted that acoustic emissions differ from one species to the next. Some studies observed different whistle types when comparing different populations of the same species [21], [22], and the authors noticed that intra-species variation of whistles between different regions was significant. These variations could be due to behavioural context. Additionally, some studies demon-strated there is an individual dolphin signature which transmits identity information for the dolphin in question [23]. Due to intra and inter-species variations, we can conclude it is rather difficult to compare two different species. Therefore, it is necessary to identify particular sounds produced for each behaviour, before studying variations between species. Only after will it be possible to compare vocalizations for each species, for a specific behaviour. Difficulty arises because there are variations between species, between populations and among individuals.
In conclusion, this study, developed for the first time, a new method of bioacoustic data mining on dolphin whistles. This method was applied to humpback whale vocalizations [24]. Our detector is efficient, allowing us to identify and interpret the vocal diversity of various marine mammals including dolphins and whales. Automation and classification of signals
are fundamental concepts, over the first phase to gain time and accuracy.
ACKNOWLEDGMENT
We thank the research office Aquasearch and Aliotis for this collaboration during the sea trip. We thank Jessica Chevallier for their comments on an earlier version of the manuscript and for proof-reading the text.
REFERENCES
[1] D. Mann, J. Locascio, and C. Wall, “Listening in the ocean: New dis-coveries and insights on marine life from autonomous passive acoustic recorders,” in Listening in the Ocean, pp. 309–324. Springer, 2016. [2] J. Sueur, S. Pavoine, O. Hamerlynck, and S. Duvail, “Rapid acoustic
survey for biodiversity appraisal,” PloS one, vol. 3, no. 12, pp. e4065, 2008.
[3] F. Samaran, O. Adam, and C. Guinet, “Detection range modeling of blue whale calls in southwestern indian ocean,” Applied Acoustics, vol. 71, no. 11, pp. 1099–1106, 2010.
[4] P. Mayol, B. De Montgolfier, M. Ratel, R. Bordes, L. Costales, and D. Iatropoulos, “Caractérisation des activités d’observation commerciale des cétacés à l’échelle du sanctuaire agoa,” Etude commandée par le sanctuaire Agoa, 2015.
[5] C. Erbe, “Underwater noise of small personal watercraft (jet skis),” The Journal of the Acoustical Society of America, vol. 133, no. 4, pp. EL326–EL330, 2013.
[6] R. Abeille, Y. Doh, O. Dufour, P. Giraudet, P. Halkias, H. Glotin, JM. Prévot, C. Rabouy, and J. Razik, “Detection et classification sur transect audiovisuel de populations de cetaces du nord pelagos aux iles d’or [decav],” PELAGOS, PNPC, DYNI USTV, 2012.
[7] L. Van der Maaten and G. Hinton, “Visualizing non-metric similarities in multiple maps,” Machine learning, vol. 87, no. 1, pp. 33–55, 2012. [8] K. Frasier, E. Elizabeth Henderson, H. Bassett, and M. Roch,
“Auto-mated identification and clustering of subunits within delphinid vocal-izations,” Marine Mammal Science, 2016.
[9] M. Lutz and E. Biernat, Data Science: fondamentaux et études de cas: Machine Learning avec Python et R, Editions Eyrolles, 2015. [10] M. Bartcus, F. Chamroukhi, and H. Glotin, “Hierarchical dirichlet
process hidden markov model for unsupervised bioacoustic analysis,” in Neural Networks (IJCNN), 2015 International Joint Conference on. IEEE, 2015, pp. 1–7.
[11] E. Fowlkes and C. Mallows, “A method for comparing two hierarchical clusterings,” Journal of the American statistical association, vol. 78, no. 383, pp. 553–569, 1983.
[12] A. Strehl and J. Ghosh, “Cluster ensembles—a knowledge reuse framework for combining multiple partitions,” Journal of machine learning research, vol. 3, no. Dec, pp. 583–617, 2002.
[13] C. Clark, “The acoustic repertoire of the southern right whale, a quantitative analysis,” Animal Behaviour, vol. 30, no. 4, pp. 1060–1071, 1982.
[14] L. May-Collado and D. Wartzok, “A comparison of bottlenose dolphin whistles in the atlantic ocean: factors promoting whistle variation,” Journal of Mammalogy, vol. 89, no. 5, pp. 1229–1240, 2008. [15] RG. Busnel and Albin. Dziedzic, “Acoustic signals of the pilot whale
Globicephala melaen a and of the porpoises Delphinus delphis and Phocoena phocoena,” Whales, dolphins and porpoises, pp. 607–646, 1966.
[16] V. Lesage, C. Barrette, M. Kingsley, and B. Sjare, “The effect of vessel noise on the vocal behavior of belugas in the st. lawrence river estuary, canada,” Marine Mammal Science, vol. 15, no. 1, pp. 65–84, 1999. [17] S. Nowacek, R. Wells, and A. Solow, “Short-term effects of boat traffic
on bottlenose dolphins, Tursipos Truncatus , in sarasota bay, florida,” Marine Mammal Science, vol. 17, no. 4, pp. 673–688, 2001.
[18] D. Lusseau, D. Bain, R. Williams, and J. Smith, “Vessel traffic disrupts the foraging behavior of southern resident killer whales Orcinus orca,” Endangered Species Research, vol. 6, no. 3, pp. 211–221, 2009. [19] T. Gridley, S. Elwen, G. Rashley, A. Badenas Krakauer, and J. Heiler,
“Bottlenose dolphins change their whistling characteristics in relation to vessel presence, surface behavior and group composition,” in Proceedings of Meetings on Acoustics 4ENAL. ASA, 2016, vol. 27, p. 010030.
[20] AR. Luís, M. Couchinho, and M. Santos, “Changes in the acoustic behavior of resident bottlenose dolphins near operating vessels,” Marine Mammal Science, vol. 30, no. 4, pp. 1417–1426, 2014.
[21] LE. Rendell, JN. Matthews, A. Gill, JCD. Gordon, and DW. Macdonald, “Quantitative analysis of tonal calls from five odontocete species, examining interspecific and intraspecific variation,” Journal of Zoology, vol. 249, no. 4, pp. 403–410, 1999.
[22] A. Gannier, S. Fuchs, P. Quèbre, and J. Oswald, “Performance of a contour-based classification method for whistles of mediterranean delphinids,” Applied Acoustics, vol. 71, no. 11, pp. 1063–1069, 2010. [23] V. Janik, L. Sayigh, and RS. Wells, “Signature whistle shape conveys
identity information to bottlenose dolphins,” Proceedings of the National Academy of Sciences, vol. 103, no. 21, pp. 8293–8297, 2006. [24] B. Bouchard, JY. Barnagaud, M. Poupard, H. Glotin, P. Gauffier,
Sara Torres Ortiz, J. Thomas, S. Campagna, M. Rasmussen, and A. Célérier, “Behavioural responses of humpback whales to food-related chemical stimuli,” PloS one, vol. 14, no. 2, pp. e0212515, 2019.