HAL Id: hal-00622336
https://hal-upec-upem.archives-ouvertes.fr/hal-00622336
Submitted on 26 Feb 2014
HAL is a multi-disciplinary open access
archive for the deposit and dissemination of
sci-entific research documents, whether they are
pub-lished or not. The documents may come from
teaching and research institutions in France or
abroad, or from public or private research centers.
L’archive ouverte pluridisciplinaire HAL, est
destinée au dépôt et à la diffusion de documents
scientifiques de niveau recherche, publiés ou non,
émanant des établissements d’enseignement et de
recherche français ou étrangers, des laboratoires
publics ou privés.
Detection of land cover change by integrating
information under lattice basing on completeness and
consistency
Thuc-Trung Pham, Robert Jeansoulin, Viet Phan Luong, Alexander J.
Comber
To cite this version:
Thuc-Trung Pham, Robert Jeansoulin, Viet Phan Luong, Alexander J. Comber. Detection of land
cover change by integrating information under lattice basing on completeness and consistency. 3rd
In-ternational Symposium on Spatial Data Quality (ISSDQ’04), Dept. for Geoinformation and
Carthog-raphy, Vienna University of Technology TUW, Apr 2004, Bruck am der Leitha, Austria. 12pp.
�hal-00622336�
DETECTION OF LAND COVER CHANGE BY INTEGRATING
INFORMATION UNDER LATTICE BASING ON THE
COMPLETENESS AND CONSISTENCY
T.T. Pham1, R. Jeansoulin1, V. Phan Luong1, A.J. Comber21
Université de Provence,
39 rue F. Joliot Curie, 13453 Marseille, France {pham, robert.jeansoulin, phan}@cmi.univ-mrs.fr
2
Department of Geography, University of Leicester, Leicester, UK
Abstract. This paper examines issues in detection of land cover changes. Several causes are
identified and treated separately before any relevant “change” decision: (a) errors in signal processing, (b) ontological disagreement on candidate classes, (c) real world updates.
Basing on these issues, we propose an information quality measure of information before detecting the land cover change. The approach to determine the change is composed the steps: (i) measurement of data quality, (ii) identification of semantic discordances to determine a possible common ontology of land cover classes, which is considered as an information lattice, (iii) integration of information integrating under a lattice based on quality.
Keywords: Land cover change, semantic heterogeneity, completeness, consistency, information lattice, data integration.
1 Introduction
Land cover change detection has become a more common area of research in recent years. It takes as input very large data sources, which can be over entire countries and continents, and compares them, in order to record changes. It has been made possible by the introduction of spatial techniques and of large database facilities. However, direct comparison is problematic because of the large variety of on-the-ground situations containing in a limited number of identified thematic classes, and the user may ignore how the abstraction process was undertaken from raw data to derived thematic products. It is necessary, before integrating these data for time comparison, to identify possible semantic heterogeneity.
This paper proposes a solution to conclude about land cover change by integrating of land cover information under lattice basing on quality information. We consider the Land Cover Map of Great Britain of 1990 (LCMGB) and the UK Land Cover Map 2000 (LCM2k) as case study.
Section 2 describes the land cover change issues as ontological heterogeneity, data quality, and comparison of dominant land cover classes.
Section 3 recalls the information lattice (Phan et al, 2003) which presents the basis for our solution. The notions of complementary and conflicting data are formalized, and the methods for integrating information to identify the consensus and aggregation are given. We propose a methodology to conclude about change, and the results for the case study with LCMGB and LCM2k in the Midlands. Finally, some concluding remarks and future work are presented in Section 4.
2 Issues of land cover change
Given two thematic maps of an area, with different dates, there are the problem to resolve before conclude about landscape change: semantic heterogeneity, ontology change, quality of information,…
2.1 Ontology heterogeneity
Land cover information, as one of the major sources of geographic information, is highly heterogeneous in formats and semantics. The heterogeneities arise because land cover data are produced basing on different definitions, standards. For example, LCMGB (Fuller et al, 1994) and LCM2k (Fuller et al, 2002, 2003) are produced by the same institution and from composite winter and summer satellite images. LCMGB is raster dataset, recording 25 Target land cover classes; LCM2k is vector dataset, data is provided as polygons of land parcel, and each parcel has a list of attributes attached to it. LCM2K contains different levels of class detail. The standard level of detail provides 26 Broad Habitat land cover classes. LCM2k is not directly comparable with LCMGB because of these heterogeneities.
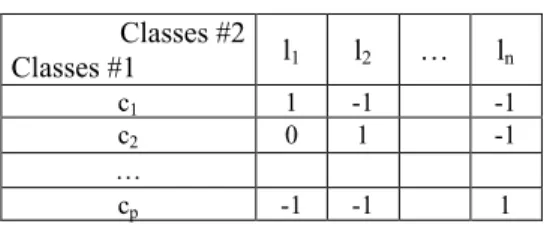
Solving the problem of ontology heterogeneity, is difficult, is an important task as a preparatory step to the information integration to conclude the landscape change. The aim of ontology integration is building a common ontology or to finding the relation between the concepts of two different ontologies. Several approaches to the integration of heterogeneous ontologies are proposed in Worboys et al (2001, 2002), Foncseca et al (2002) and Stumme et al (2001). Comber et al (2003b) propose a semantic statistical approach for identifying change from ontologically divers land cover data. We aim to build a common ontology of LCMGB and LCM2k. In Pham et al (2003) we have proposed a method to determine the associations between the classes of two ontologies basing on the information in datasets. Further, there are many possible associations between two classes from two different hierarchies (classification systems), some are likely similarities, and some are likely dissimilarities. It is rather difficult to formalize what we mean by similarity and dissimilarity, but when asking an expert, he is in general able to take a decision and to fill up a table such as:
Table 1. Example of an expert look-up table
Classes #2 Classes #1 l1 l2 … ln c1 1 -1 -1 c2 0 1 -1 … cp -1 -1 1
This matrix, called a “Look-Up Table” (short: LUT), and precisely an “Expert LUT” can be used to determine a probable transition status between parcels:
For a parcel A, suppose that ci is unique classes of A at first date and lj is unique classes of A at
second date,
if LUT(i,j) = 1, then A is unchanged, if LUT(i,j) = 0 then status of A is unknown, if LUT(i,j) = -1, then A is changed
We combine the result of our approach in Pham et al (2003) and the “Expert LUT” to determine a common ontology of LCMGB and LCM2k on each study zone.
For example, information lattice in Figure 1 represents the result of integration of ontologies. The node containing the classes of different datasets, for instance node in Figure 1, where 13.1 is a class of LCM2k and C1, C2 are classes of LCMGB, represents that there is the
correspondence between these classes. When we integrate the information of land cover classes (node) in a parcel A, if the consensus or aggregation is result in one of these nodes then A is unchanged, if the consensus of land cover classes in two dates is its super-class then we can conclude there are mismatches, or internal confusion, or reduced reliability. It depends on the distance between them and their consensus, if the consensus land cover classes in two dates is bottom then A is changed. We will clearly present this solution of change detection in Section 3.2.
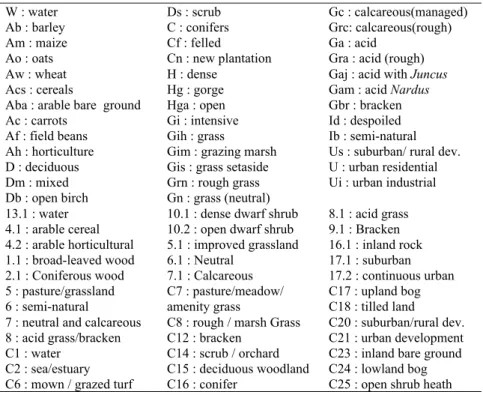
Fig. 1. Information lattice of common ontology of LCMGB and LCM2k
Table 2. the means of abbreviation in Figure 1 W : water Ab : barley Am : maize Ao : oats Aw : wheat Acs : cereals
Aba : arable bare ground Ac : carrots Af : field beans Ah : horticulture D : deciduous Dm : mixed Db : open birch Ds : scrub C : conifers Cf : felled Cn : new plantation H : dense Hg : gorge Hga : open Gi : intensive Gih : grass
Gim : grazing marsh Gis : grass setaside Grn : rough grass Gn : grass (neutral)
Gc : calcareous(managed) Grc: calcareous(rough) Ga : acid
Gra : acid (rough) Gaj : acid with Juncus Gam : acid Nardus Gbr : bracken Id : despoiled Ib : semi-natural Us : suburban/ rural dev. U : urban residential Ui : urban industrial 13.1 : water 4.1 : arable cereal 4.2 : arable horticultural 1.1 : broad-leaved wood 2.1 : Coniferous wood
10.1 : dense dwarf shrub 10.2 : open dwarf shrub 5.1 : improved grassland 6.1 : Neutral 7.1 : Calcareous 8.1 : acid grass 9.1 : Bracken 16.1 : inland rock 17.1 : suburban 17.2 : continuous urban 5 : pasture/grassland 6 : semi-natural
7 : neutral and calcareous 8 : acid grass/bracken C1 : water
C2 : sea/estuary C6 : mown / grazed turf
C7 : pasture/meadow/ amenity grass
C8 : rough / marsh Grass C12 : bracken C14 : scrub / orchard C15 : deciduous woodland C16 : conifer C17 : upland bog C18 : tilled land C20 : suburban/rural dev. C21 : urban development C23 : inland bare ground C24 : lowland bog C25 : open shrub heath
3.2 Uncertainty and quality of information in land cover datasets
It may be impossible to represent a true landscape if definitions of soil classes are inherently uncertain or vague. For example, the classes of grass (improved grassland, acid grass, neutral grass,…) is internally heterogeneous. Besides, the lack of information is related to the quantity of information needed for recovering the truth. The lack of information causes the incomplete of dominant subclasses in each parcel. Land cover information consists of basic information describing the land cover classes that occupy the territory, and its assessments via the cartographic representations. When the lack of information of land cover classes exists then the determination of majority class or Broad Habitat (BH) class in each parcel is not exact. For this reason, there exist parcels where the attributed BHs are not the generalization of the dominant subclasses in the complement data (metadata).
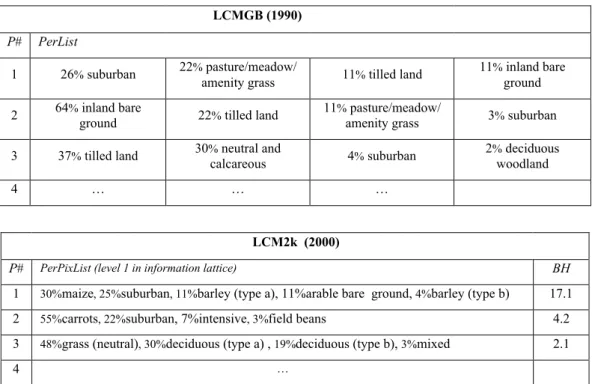
For example, the important information (to change detection) is the list of percentage of cover classes (of LCMGB) and the BHs and it metadata (of LCM2k). We note that the information is incomplete (sum of the not null values of percentage is not 100%) then gives rise to the possibility of the inconsistency between BH and it metadata (see an example of data in Table 3).
Table 3. an example of land cover information in LCMGB dataset and LCM2k dataset LCMGB (1990)
P# PerList
1 26% suburban 22% pasture/meadow/
amenity grass 11% tilled land
11% inland bare ground 2 64% inland bare
ground 22% tilled land
11% pasture/meadow/
amenity grass 3% suburban 3 37% tilled land 30% neutral and
calcareous 4% suburban
2% deciduous woodland
4 … … …
LCM2k (2000)
P# PerPixList (level 1 in information lattice) BH
1 30%maize, 25%suburban, 11%barley (type a), 11%arable bare ground, 4%barley (type b) 17.1 2 55%carrots, 22%suburban, 7%intensive, 3%field beans 4.2 3 48%grass (neutral), 30%deciduous (type a) , 19%deciduous (type b), 3%mixed 2.1
4 …
In LCMGB, the observation of land cover classes is imperfect because there exist the parcels which do not contain information of land cover. In LCM2k, the basic information is described by a list (Parcel#, PerPixList, BH,...) where PerPixList is a list of area percentages of the top five spectral subclasses recorded by satellite images within Parcel#. The descriptions of BHs (see Figure 1) were developed by the Joint Nature Conservation Committee. LCM2k aimed to contribute to the assessment of habitats by mapping, as far as possible, the widespread examples of terrestrial, freshwater and coastal Broad Habitats (Fuller et al, 2002). We remark that there exist parcels, where the attributed BHs are not the generalization of the dominant subclasses in the parcel. Moreover, the attributed BHs may correspond to non-dominant subclasses.
3.3 A data quality measure
There are many aspects of data quality (Veregin, 1999) as correctness, accuracy, precision, completeness, consistency, relevance and timeliness, etc. In this work, we propose a measure of completeness and consistency of data in LCMGB and LCM2k datasets. We consider:
Completeness of information: The sum of all percentages of non-null values of dominant classes is
incomplete. The smaller sum of percentages of dominant classes corresponds to the lower quality.
Consistency: For each PerPixList, we regroup the subclasses following the lattice structure. For
example, in the first line of Table 2, subclasses maize, barley (type a), barley (type b) are regrouped into class 4.1(arable cereal) with percentage 45, suburban is regrouped into class 17.1 with percentage 25, and arable bare ground is regrouped into class 4.2 (arable horticultural) with percentage 11 (see Figure 1). The result list is sorted in descending order of percentages, called “TopList”: 2.1, 45: 17.1, 25: 4.2, 11. We say that an estimated broad habitat value is consistent if it is the first value of the
TopList. Hence, for the first line of Table 2, BH is not consistent with PerPixList.
Basing on the above ideas, we propose a method for measure the completeness and consistency of parcel:
Completeness = Â(percentage of dominant classes) Consistency = Rang of BH in TopList
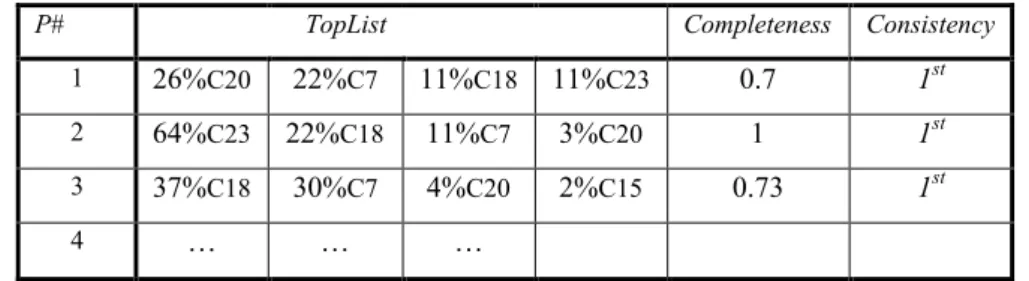
For example, Table 3 represents information after regrouping of information in Table 2 and completeness and consistency in each parcel of its information are presented in Table 4 and Table 5.
Table 4. Completeness and consistency of LCMGB information in Table 3
P# TopList Completeness Consistency
1 26%C20 22%C7 11%C18 11%C23 0.7 1st
2 64%C23 22%C18 11%C7 3%C20 1 1st
3 37%C18 30%C7 4%C20 2%C15 0.73 1st
4 … … …
Table 5. Completeness and consistency of LCM2k information in Table 3
P# TopList BH Completeness Consistency
1 45%2.1 25%17.1 11%4.2 17.1 0.81 2nd
2 58%4.2 22%17.1 7%5.1 4.2 0.87 1st
3 52%1.1 48%2.1 2.1 1 2nd
4 … … …
4 Land cover change
4.1 Existing methods
The problem of detecting change between thematic (land cover) maps is described by Fuller et al (2003) with reference to the accuracy of LCMGB and LCM2k. With the assumptions of random error
distribution, ignoring different types of thematic errors and change, they show the underlying problems of change detection that exist with respect to map accuracies stating that to detect a change of 17% (the likely rate of change cited by Fuller, 2003) with a 75% reliability both maps would have to be 97% accurate. In reality LCMGB and LCM2k are between 70% and 80% accurate.
Statistical approaches are based on commutating surface percentages for each class, at each date, then compiling “transition matrices” (Eiden et al 2003, Comber et al 2003c), and finally defining a threshold which splits between what should be interpreted as a “change” or not.
Most improvements proposed for theses approaches concern the way the “surfaces” are computed, paying attention to the “internal data quality”, not to the external quality. At the European scale, a lot of studies have been done for the CORINE Land-Cover program (see (IES)), whose LCMGB is the British subset. The overall results are used as very broad indicators only, and in general they are reputed “overestimated”.
Fuller et al (2003) indicate that a possible way forward for detecting land cover change between, is to utilize the vector structure of LCM2k to interrogate the LCMGB raster data. This provides local descriptions of LCMGB distributions, and allows change to be identified on a per-parcel basis. A complementary description of LCM2k parcel heterogeneity is provided by one of the LCM2k meta-data attribute PerPixList. Comber et al (2003a; 2003b; 2003c) have developed and applied a methodology that compares two parcel characterizations based on PerPixList attribution and the distribution of LCMGB classes, in order to identify locales of change.
4.2 Data quality based integration under lattice to detect the land cover change 4.2.1 Information lattice
An information lattice is a lattice (L, £), which contains top (inconsistent) and bottom (unknown). £ is partial order between the elements of L, top is maximal element and bottom is minimal element of L. Let x, y in L, if x £ y then y is called more complete or more specific than x. In the case L is a lattice of land cover classes if x £ y then y is subclasses of x. Let X Õ L such that X ≠ ∅, the set of all minimal (resp. maximal) elements of X is denoted by min(X) (resp. max(X)). The least upper bound of X, if exists, is denoted by ⁄X, and called the join of X. The greatest lower bound of X, if exists, is denoted by ŸX, and called the meet of X. In particular, if X = {x, y} then ⁄X and ŸX, respectively denoted by (x ⁄ y) and (x Ÿ y), always exist. We have (x Ÿ y) £x, y £ (x ⁄ y), and the following equivalence: x £ y if and only if x = (x Ÿ y), y = (x ⁄ y).
If (x ⁄ y) ≠ top, then x and y are called complementary to one another. If (x ⁄ y) = top, then x and y are called in conflict with each other. The conflict between x and y is called total if x Ÿ y = bottom, as x and y do not share any common information. Otherwise, the conflict is called partial, and x Ÿ y is called a consensus of x and y.
Let I and J be subsets of L. We define I J if I = ∅, or for each x Œ I, there exists y in J such that x£y. J contains the information of I. I is called an information containment of J.
Let I and J be subsets of L, I is called a information equivalence of J if and only if I is an information containment of J, and J is an information containment of I.
Let (L, £) be an information lattice. Let I and J be subsets of L. If I and J are non-empty, then define the consensus and the aggregation of I and J to be respectively
ƒ : I ƒ J = max{ x Ÿ y | xŒI, yŒJ }
Example: Figure 1 represents an information lattice of land cover classes, 4.1 £ A b or barley is
subclass of arable cereal: 4.1 £ A m or maize is subclass of arable cereal. The consensus of 1.1 (broad-leaved wood) and C16 (conifer) is woodland. 13.1 (water) is total conflict with 17.1 (suburban). 8.1 (acid grass) is partial conflict with C8 (rough / marsh Grass). 5.1 (improved
grassland) is a complement of 6.1 (neutral). There exists internal confusion between 5.1 (improved grassland) and 6.1 (neutral). It is called internal heterogeneity.
4.2.2 Data preparation
The necessary information to our methodology is:
- the information lattice which represents the common ontology of land cover classes, - the quality information is available in each datasets,
- the “toplist” (list of regrouping the subclasses into level of Broad Habitat, remark that this list is sorted in descending order of percentages).
It means that each parcel A is described by triplet (A | toplist | completeness, consistency) in LCMGB and LCM2k, where A is the code of parcel, toplist is information of land cover classes. The lattice information will be used for integration process.
4.2.3 Integration for determination of consensus
Suppose parcel A is covered by only one class Ci of LCMGB and class Lj of LCM2k. In section 1, the
consensus of Ci and Lj is Ci ƒ Lj = Ci Ÿ Lj = x. When x is in a same node of Ci and Lj, A is unchanged.
If Ci and Lj is subclasses of x then we can conclude there are the mismatch in A. In this case, the level
of change-nochange depends on the “distance” between x and Ci, Lj. If the x is bottom then we can say
that A is changed. The level of change is as following:
Ci Lj : ÿp (no change)
Ci Lj : ÿ p’ (no change with warning)
Ci Lj : p’ (indecision)
…
Ci Lj : p (change)
When the parcel A is covered by many classes {Ci} of LCMGB at first date, and many classes {Lj} of
LCM2k at second date. The change measure is calculated basing on the consensus of pair-wise of classes from two sources. This measure is represented in next section.
4.2.4 Query with the user’s constraints on quality
The users can specify a quality level when querying the integration of land cover information to detecting the change. When the constraints on quality of user’s queries are introduced, the integration process will choose the information, which satisfies the needs of user, for fusion. The constraint on quality is intended to limit the computation to parcels which present enough information for making a decision of change.
With the constraint on quality is completeness ≥ c1 and consistency = {I}. For each parcel A,
If com1(A) ≥ c1 and com2(A) ≥ c1 and con1(A) Œ {I}and con2(A) Œ {I} then
the change/nochange conclusion is realized by integration process for detecting of change. Else the parcel is colored by white (lack information for change conclusion).
The integration process for detecting of change in the parcel:
1st step: fusion toplist of LCMGB and toplist of LCM2K. It integrates a pair-wise of toplist to calculate the consensus of land cover classes.
Toplist of LCMGB Toplist of LCM2k 1st 1st 2nd 3rd 4th 5th 2nd 3rd 4th 5th
2nd step: build the preference order to conclude about change
In each toplist, the classes in descending order play the different part to detecting the “change”. The major class plays the important part of “change”. In order to present this, the classes of toplist are coded by binary code which is “degree of importance”, each toplist = (1st class, 2nd class, …, nth class) is coded by (2n-1, 2n-2, … ,20), with n is maximal number of element in toplist of all parcels. We note that if a toplist have k elements, k < n, then element k+1, k+2, …n is null classes. It means that and coef(1st class) = 2n-1, … coef(2nd class) = 2n-2…
The coefficient is assigned to each element (i,j) of this matrix:
coef(i,j) = coef(i) * coef(j)
For example, with the toplist = (1st class, 2nd class, 3rd class), the result of two toplist integration from two sources is:
f11 f12 f13 f21 f22 f23 f31 f32 f33
The “degree of importance” of the integration result of two toplist:
coef(1,1) = 16 coef(1,2) = 8 coef(1,3) = 4 coef(2,1) = 8 coef(2,2) = 4 coef(2,3) = 2 coef(3,1) = 4 coef(3,2) = 2 coef(3,3) = 1
We call d(fij) is short way from fij to bottom or the “near” of fij and “change”. By definition, if fij = bottom then d(fij) = 0, elseif “distance” from fij to bottom is k then d(fij)=2k.
The “quantitive nochange” is defined by
Âij (coef(i,j) * d(fij))
When the “quantitive nochange” is greater then the possible change is smaller. 3rd step: change decision basing on the preference order.
As an example to conclude the change: with the toplist = (1st class, 2nd class, 3rd class), d(fij) Œ{0,
2, 4, 8} (d(fij) = 0 if fij = bottom, d(fij) = 2 if fij is a successor of bottom, …). If the “nochange” is f11 = (1st of LCMGB ƒ 1st of LCM2k) f12 = (1st of LCMGB ƒ 2nd of LCM2k) f13 = (1st of LCMGB ƒ 3rd of LCM2k) f21 = (2nd of LCMGB ƒ 1st of LCM2k) f22 = (2nd of LCMGB ƒ 2nd of LCM2k) f23 = (2nd of LCMGB ƒ 3rd of LCM2k) f24 = (2nd of LCMGB ƒ 4th of LCM2k) …
concluded if the major classes of two toplist are a same node in information lattice, then the thresholds for change decision are:
Nochange if Âij (coef(i,j) * d(fij)) >= 512
Indecision if Âij (coef(i,j) * d(fij)) >= 256
Change if Âij (coef(i,j) * d(fij)) < 256
4.3 Results
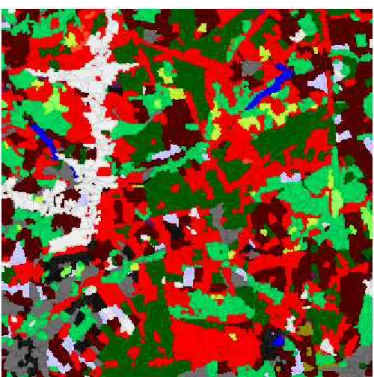
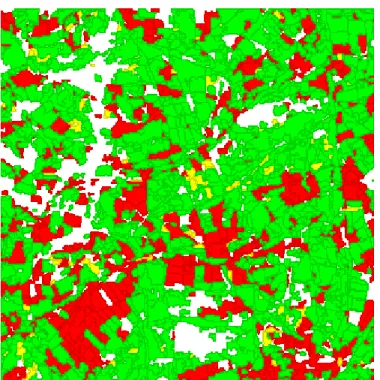
Figure 3 and Figure 4 display the same midland zone: Figure 3 shows the map of majority class taken from LCMGB; Figure 4 is the map of Broad Habitat of LCM2k, colored according to the LCM2k display class description. The parcels color white lack information of land cover classes.
Figure 5 displays the change when the integration takes as input the major class of LCMGB and Broad Habitat of LCM2k. The constraint on quality for query of integration is (completeness >=50%) and (consistence = first). This constraint is “strong”, for this reason there many parcels detected change. There are 40.22% nochange, 2.09% indecision, 38.23% change, 19.46% white.
[legend: no change= green, change= red, indecision= yellow, white= insufficient information for decision]
Figure 6 displays the result of integration query, which takes as input the “toplist” of LCMGB and “toplist” of LCM2k. The constraint on quality for query of integration is (completeness ≥ 50%) and (consistence = {first, second, third}). There are 40.22% nochange, 22.52% nochange with warning, 16.08 indecision, 1.72% change, 19.46% white.
[legend: no change= green, indecision= yellow, indecision “near change” = orange, change = red,
white= insufficient information for decision]
5 Conclusion and future works
We have presented a solution to conclude about of land cover change. This solution takes into account constraints on quality information related to the completeness and consistency degree of classification of each parcel and to internal conceptual consistency. Then it integrates the two land cover class hierarchies under a common information lattice and proposes a way to identify the consensus of land cover classes at two dates. This consensus is relevant for determining the mismatch of land cover classes, and is used to conclude about the level of land cover classes, and is used to conclude about the level of change. The constraint on quality is intended to limit the computation to parcels which present enough information for making a decision of change. Experimental results have been performed on real-scale data and show some interesting properties, reducing the overestimation of change which is frequently computed with classical statistical methods.
We have proposed a common ontology for LCMGB and LCM2k on a zone study. This ontology is determined combining the expert opinion and the real information in the datasets. Consequently the common ontology of a zone is not suitable another zone or the all case. So it is necessary to thoroughly examine the ontology heterogeneity.
Fig 4. Broad Habitat display of LCM2k Fig 3. LCMGB map display of majority class
Fig. 6. change with completeness ≥0.5 and consistency = {first, second, third} Fig. 5. majority class change completeness ≥0.5 and consistency = {first}
Acknowledgements
This work is supported by the European Community under contract IST-1999-14189: « REVIGIS » project of the « Future and Emerging Technologies » program of IST, in the 5th Framework Program. Data are provided by courtesy of CEH1, through an agreement with Department of Geography, University of Leicester.
References
[1] A.J. Comber, P.F. Fisher and R.A. Wadsworth. Actor Network Theory: a suitable framework to understand how land cover mapping projects develop?. In the J. of Land Use Policy, 20: 299-309. 2003a. [2] A.J. Comber, P.F. Fisher, R.A.Wadsworth. A semantic statistical approach for identifying change from
ontologically divers land cover data. Proc. 5th AGILE Conf. (eds. M. Gould, R. Laurini, S. Coulondre), 24-26th April, Lyon, France, pp 123-131, 2003b.
[3] A.J. Comber, P.F. Fisher, R.A. Wadsworth.. Identifying land cover change using a semantic statistical approach: first results. Proc. 7th International Conference on GeoComputation 8-10th, Univ. Southampton, UK, 2003c.
[4] G. Eiden, C. Vidal, N. Georgieva.. Land-cover/Land-use change detection using point area frame survey data. Building agro-environmental indicators, Focusing on the European survey LUCAS., 55-68, 2003. [5] F. Fonseca, M. Egenhofeer, C. Davis and G. Câmara. Semantic Granularity in Ontology-Driven Geographic
Information Systems. In AMAI Annals of Mathematics and Artificial Intelligence - Special Issue on
Spatial and Temporal Granularity, 36:121-151, 2002.
[6] Fuller, R.M., G.B., Groom, A.R. Jones. The Land Cover Map of Great Britain: an automated classification of Landsat Thematic Mapper data. Photogrammetric Engineering and Remote Sensing, 60: 553-562. 1994. [7] R.M. Fuller, G.M. Smith, J.M. Sanderson, R.A. Hill, A.G. Thomson, R. Cox, N.J. Brown, R.T Clarke, P.
Rothery and F.F. Gerard. Land Cover Map 2000, a guide to the classification system. Technical report of Centre for Ecology and Hydrology, 2002.
[8] R.M. Fuller, G.M. Smith, B.J. Devereux. The characterization and measurement of land cover change through remote sensing: problem in operational application?. in int. journal of applied earth Observation
and Geoinformation, 4: 243-253, 2003.
[9] V. Phan Luong, T.T. Pham and R. Jeansoulin. Integrating Information under Lattice Structure. In Proc. of
14th Int. Symposium on methodologies for intelligent system, ISMIS03, 83--87, Maebashi City, Japan,
October, 2003.
[10] T.T. Pham, V. Phan Luong and R. Jeansoulin. Correspondence between the attributes of ontologies. In
Proc. of Majecstic03, Marseille, France, October, 2003.
[11] G. Stumme and A. Maedche. FCA-Merge: Bottom-Up Merging of Ontologies. In Proc. 17th Int. Joint
Conf. on Artifical Intelligence, IJCAI01, 225--234, 2001.
[12] H. Veregin. Data quality parameters. In the journal of Geographical Information Systems, vol. 1, 177--189, 1999.
[13] M. Worboys and M. Duckham. Integrating spatio-thematic information. In Proc. of conference GIScience, Colorado, USA, 2002.
[14] M. Worboys and E. Clementini. Integration of Imperfect Spatial Information. In the journal of Visual
Languages and Computing, 12: 61--80, 2001.
[15] IES reports: Institute for Environment and Sustainability, http://www.ei.jrc.it/