S1
Ultrafast charging of LiFePO4 with gaseous oxidants under ambient
conditions – Electronic Supplementary Information
Christian Kuss, David Lepage, Guoxian Liang and Steen B. Schougaard*
Experimental Information
All LiFePO4 materials donated by Clariant (Canada) Inc., (former Phostech Lithium Inc.) were research grade. Micro-sized carbon coated LiFePO4 (C-LiFePO4) was produced according to US Patent 7,457,018. Carbon free LiFePO4 nano-powder was produced according to US Patent 7,807,121 B2. Particle size distribution of C-LiFePO4 was determined using dynamic light scattering (Zeta Plus Brookhaven Instruments Corporation).
Static XRDs were recorded on a Siemens D5000 diffractometer using a Co Kα X-ray source. ATR FTIR was performed on a Thermo Scientific Nicolet 6700 FTIR spectrometer with a diamond ATR crystal Smart iTR accessory in the wavelength range from 550 cm-1 to 4000 cm-1. XPS spectroscopy was performed with a PHI 5600-CI (Physical Electronics) XPS spectrometer using an Mg Kα anode. Calibration was performed by shifting the C 1s peak to 284 eV.
XRD and ATR FTIR spectroscopy were accomplished on samples exposed to high concentrations of nitrogen dioxide (Praxair), chlorine (Linde) and ozone (Welsbach T-408 Ozone Generator, 3-5 % O3 in dry O2 flow) gas respectively for at least 30 minutes. The wet nitrous oxide gas mixture produced in the reaction of copper with concentrated nitric acid led to the same results as presented for nitrogen dioxide.
The samples for atomic emission spectroscopy (AES) were washed with water and filtered. Washed FePO4 samples were dissolved in concentrated nitric acid. The wash water and the dissolved FePO4 were analysed at 670.8 nm by AES to determine the lithium content. The reported confidence interval is based on a Student’s t distribution at the 95% level using at least three measurements.
The samples for transmission electron microscopy (TEM) were suspended in acetonitrile and brought onto a lacey carbon TEM grid. Oxidation was then performed directly on the grid. Transmission electron micrographs were recorded on a Jeol JEM-2100F microscope with an acceleration voltage of 200 kV.
For battery testing, carbon coated nano LiFePO4 was oxidized using dry NO2 gas (Praxair). Completion of oxidation was confirmed by ATR FTIR. The product was then washed and dried at 60 °C under vacuum. A coating was prepared from a suspension of 85 % w/w active material, 6 % w/w PVDF binder (Kynar KF Polymer W#1100) and 9 % w/w carbon additive (Super C65 Timcal) in N-methylpyrrolidone (Sigma Aldrich) on carbon coated Al foil (Exopack #2651). The electrode coating thickness was 10 µm with a density of 0.6 g/cm3. A CR2032 type coin cell battery was prepared from this coating with a metal lithium anode (Alfa Aesar, 99.9 %), polyethylene separator (Celgard 2500) and a LiPF6 electrolyte in 1:1 ethylene carbonate and dimethyl carbonate mixture (BASF, Materials No 50316367). The battery was subsequently cycled under constant current conditions between 2.2 V and 4.2 V on a MTI Corporation BST8-WA eight channel battery cycler at a C/10 rate for the first cycle and a C/2 rate for subsequent cycles up to 53 cycles. Rate performance was subsequently tested on a Bio-Logic VMP3 8 channel potentiostat at a charge rate of C/5 and discharge rates from C/2 to 15 C.
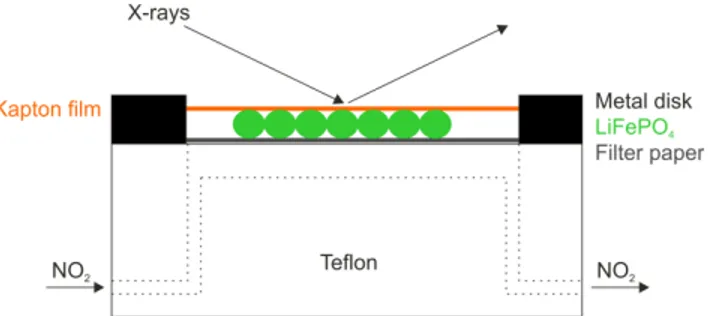
Time resolved X-ray diffractograms were recorded on a Bruker D8 Discover diffractometer using a Cu Kα X-ray source and a HI-STAR area detector. Dry NO2 gas was injected through a syringe pump injection system at a speed of approximately 20 ml/min. The gas was guided through Teflon® tubing to a Teflon® reaction chamber (Figure S1). There it passes underneath a filter paper and is evacuated through Teflon® tubing opposite the inlet. The sample (~10 mg) was placed onto the filter paper and covered with Kapton® film. The cell was then sealed using a metal disk and Teflon® tape.
Figure S1. Schematic representation of the in situ XRD cell. Electronic Supplementary Material (ESI) for Chemical Science
S2
The temperature was recorded in similar experiments without X-ray irradiation, using an infrared thermometer or a thermocouple, measuring three oxidations with each method.
The Ex-situ time resolved AES was performed by introducing a wet NO/NO2 gas mixture into an evacuated vessel at time t = 0 and removing the gas with a flow of dry air at time t. The formed lithium salt was then dissolved and quantified as described above.
For calculations of the thermodynamics of delithiations of LiFePO4 with gases, 20°C, 20.9% O2, 0.035% of CO2, and 70% rel. humidity were assumed.
The diffusion coefficient was estimated from the solution to
Fick’s 2nd law in one dimension.s1 Equation 3 of reference s1 can be differentiated and introduced into Fick’s first law to give 𝜕𝑛 𝜕𝑡 = 𝐴𝐷𝑐0� � 2 𝑅 exp �−�𝑚 +1� �2 2𝜋2𝐷 𝑅2 𝑡�� ∞ 𝑚=0 [1]
where n is the amount of substance, t is the time, A is the surface area, D is the lithium diffusion coefficient, c0 is the initial
lithium concentration in LiFePO4 and R is the average particle radius. Equation [1] can be integrated to give n:
𝑛 =2𝐴𝑅𝑐𝜋20� �(𝑚 + 1 2� )−2
�1 − exp �−�𝑚 + 1 2� �2𝜋𝑅22𝐷𝑡��� ∞
𝑚=0
[2]
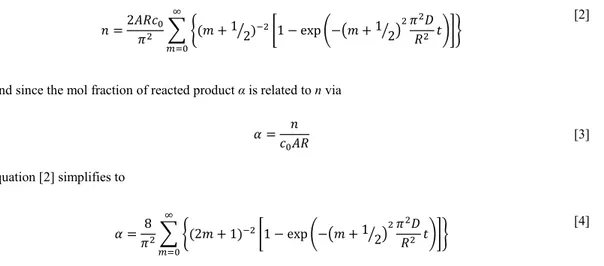
And since the mol fraction of reacted product α is related to n via
𝛼 =𝑐0𝐴𝑅𝑛 [3] equation [2] simplifies to 𝛼 =𝜋82� �(2𝑚 + 1)−2�1 − exp �−�𝑚 + 1 2� �2𝜋2𝐷 𝑅2 𝑡��� ∞ 𝑚=0 [4]
Time-resolved x-ray diffraction data (Figure 4 b) was used for estimating D, fitting to equation [4] with the summation expanded to the 7th term.
Rate performance
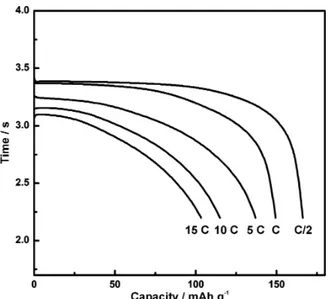
Figure S2 shows the rate performance of the oxidized material after the 50th cycle. Charges were performed at a rate of C/5. As can be seen, the material exhibits a rate performance that is common for LiFePO4.
Electronic Supplementary Material (ESI) for Chemical Science This journal is © The Royal Society of Chemistry 2013
S3
Figure S2. Discharge curves at different rates of the same battery presented in Figure 4.
Additional references
s1. D. Y. W. Yu, K. Donoue, T. Inoue, M. Fujimoto and S. Fujitani, J. Electrochem. Soc., 2006, 153, A835-A839.
Electronic Supplementary Material (ESI) for Chemical Science This journal is © The Royal Society of Chemistry 2013