1
SUPPLEMENTARY MATERIAL
Rauvolfianine, a new antimycobacterial glyceroglycolipid and other constituents from
Rauvolfia caffra. Sond (Apocynaceae)
Robert Ebeh Evinaa, Dominique Serge Ngono Bikoboa,e*, Auguste Abouem A Zintchema,b, Norbert Mbabi Nyemeck IIa,c, Esther Del Florence Moni Ndedid, Patrick Hervé Betote Dibouéd, Maximilienne Ascension Nyegued, Alex de Théodore Atchadéa, Dieudonné Emmanuel Pegnyemba, Christian Bochete and Ulrich Koertc
a
Department of Organic Chemistry, Faculty of Science, University of Yaoundé I, P.O Box 812, Yaoundé, Cameroon;
b
Department of Chemistry, Higher Training College, University of Yaoundé I, P.O Box 47, Yaoundé, Cameroon;
c
Philipps-Universität Marburg, Faculty of Chemistry, Hans-Meerwein-Strasse, D-35032 Marburg, Germany;
d
Department of Microbiology, Faculty of Science, University of Yaoundé I, P.O Box 812, Yaoundé, Cameroon;
e
Department Chemie, Universität Fribourg, CH du Musée 9, 1700 Fribourg, Switzerland;
*
Corresponding author: Tel: +237 675 05 54 68; Fax: +237 242 22 18 73 E-mail: ngono_serge@yahoo.fr (D. S. Ngono Bikobo).
Abstract
The chemical investigation of the extract of the dried leaves of Rauvolfia caffra (Sond)
(synonym Rauvolfia macrophylla) (Apocynaceae) led to isolation of a new glycoside
derivative, rauvolfianine (1) as well as six known compounds: oleanolic acid (2),
sitosterol-3-O-β-glucopyranoside (3), betulinic acid (4), vellosimine (5), sarpagine (6) and
D-fructofuranosyl-β-(2→1)-α-D-glucopyranoside (7). Compounds 1, 2, 3, 4 and 7 were evaluated for antitubercular activity. 1 and 2 were the most active (MIC = 7.8125 and 31.25 µg/mL) towards the Isoniazid resistant strain of Mycobacterium tuberculosis AC45. Their structures and relative stereochemistry were elucidated by spectroscopic methods.
Keywords: Rauvolfia caffra; Apocynaceae; Rauvolfianine; glycerol ester; 1D and 2D NMR;
2
Experimental section
General procedures
Melting points were uncorrected and were measured on a Mettler Toledo instrument. IR spectra were recorded on an Alpha FT-IR Spectrometer from Bruker, while 1D and 2D NMR spectra were obtained on a Bruker DRX 500 (500 MHz for 1H and 125 MHz for 13C spectra) spectrometer (Bruker, Rheinstetten, Germany) with chemical shifts reported in δ (ppm) using TMS (δH) as an internal standard. The HR-ESI-MS were obtained on LTQ-FT instrument (Thermo Scientific). UPLC-MS were measured by a Shimadzu UPLC-MS system. Optical rotations were measured on a Perkin-Elmer 341 polarimeter. Silica gel 60 (230–400 mesh E. Merck, Darmstadt, Germany) was employed for column chromatography, the solvent mixing systems for elution were mainly CH2Cl2/MeOH with increasing polarity each.
Plant material
The leaves of R. caffra were collected at Koumoul near Eséka division in the Centre Region of Cameroon in March 2014 and identified by a botanist. A voucher specimen (N° 48765 HCN) was deposited at the National Herbarium in Yaoundé, Cameroon.
Extraction and isolation
Dried and powdered leaves of R. caffra (910 g) was extracted with methanol (4.0 L, twice) at room temperature. The combined methanolic extract was evaporated under reduced pressure to give 28.4 g of dark gummy semisolid that was suspended in water and successively extracted with n-hexane, dichloromethane and ethyl acetate to afford the corresponding sub-fractions. Suitable size long cylindrical glass columns (based on the amount of the sample mentioned in the text) were used. For fractionation the column size was: 150 cm x 3 cm and for purification, it was: 120 cm x 2 cm. concerning flow rate, a quantity of 10-15 mL/min was collected for fractionation and for purification it was at 4 mL/min. The ethyl acetate soluble sub-fraction (12 g) was chromatographed over silica gel and eluted with a gradient solvent system (CH2Cl2/MeOH) to obtain five fractions I–V. Fraction I (2.02 g) was further purified by column chromatography eluting with CH2Cl2/MeOH (40/1 to 30/1) to afford compounds 3 (18 mg). Fraction II (1.98 g) obtained from CH2Cl2/MeOH (40/1 to 20/1) was chromatographed by column chromatography using CH2Cl2/MeOH (40/1-15/1) to afford compounds 2 (18 mg) and 4 (5 mg). Compound 1 (19 mg) was isolated from the fraction III (1.09 g) obtained from CH2Cl2/MeOH (20/1 to 10/1) eluted with gradient mixture CH2Cl2/MeOH (30/1-20/1). Fraction IV (2.97 g) was further separated by column chromatography to give three sub-fractions IVa (0.99 g), IVb (0.98 g) and IVc (1.00 g).
(+)-3 vellosimine (5, 18 mg) and sarpagine (6, 4 mg) were obtained from sub-fractions IVb eluted with the gradient mixture CH2Cl2/MeOH (25/1-10/1) over silica gel column. Fraction V (3.94 g) obtained from CH2Cl2/MeOH (5/1 to 1/1) and was further purified by silica gel column in gradient elution mixture solvent composed of CH2Cl2/MeOH (25/1-5/1) to provide compound
7 (10 mg).
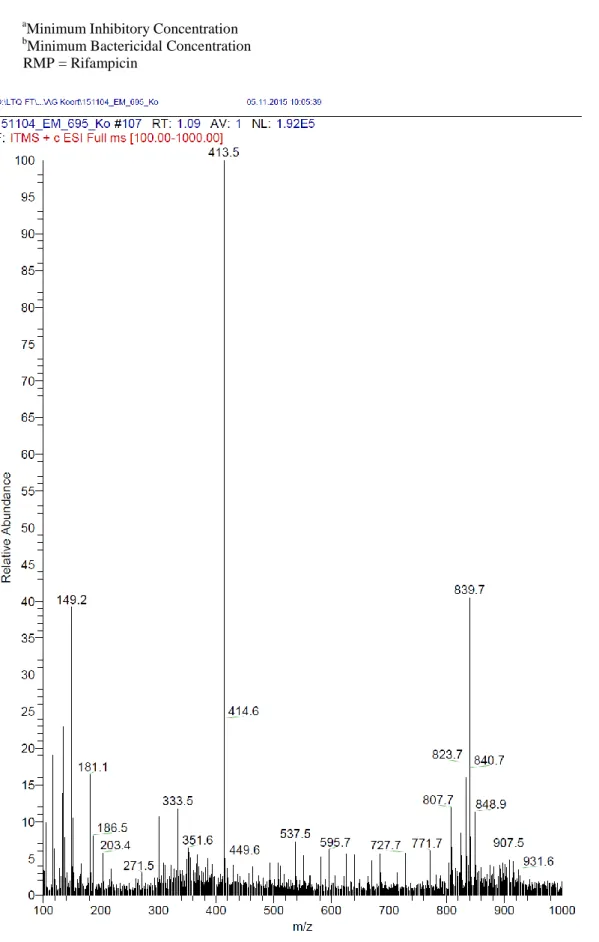
Rauvolfianine (1) C46H89NO9
White amorphous powder; M.p 119-121°; TLC Rf: 0.70 (CH2Cl2/MeOH; 15/1); IR (KBr) cm−1: 3412, 2955, 2849, 1728, 1639, 1058, 1035; 1H and 13C-NMR spectral data (500, 125 MHz, DMSO-d6), see Table 1; ESI-MS m/z: 807.7 [M+Li+H]+, 823.7 [M+Na+H]+ and 839.7
[M+K+H]+ (calcd for C46H89NO9: 807.69, 823.67 and 839.68 respectively). δH : 5.13 (1H, dddd, J = 2.6; 4.7; 7.3; 10.0 Hz, H-2), 4.40 (1H, d, J = 3.9 Hz, H-1′), 4.34 (1H, dd, J = 2.9; 9.2, H-1a), 4.14 (1H, dd, J = 2.8; 12.1,H-1b), 3.89 (1H, ddd, J = 6.0; 10.6; 16.4, Hz, H-3a), 3.39 (1H, ddd, J = 6.0; 16.4 Hz, H-3b), 3.76 (1H, ddd, J = 1.6; 5.3; 9.6 Hz, H-5′), 3.36 (1H, m, H-3′), 3.17 (1H, dd, J = 3.6; 9.8 Hz, H-2′), 2.89 (1H, m, J = 4.5 Hz, H-6′a), 2.86 (1H, m, H-4′), 2.52 (1H, dd, J = 6.6; 14.0 Hz, H-6′b), 2.29 (2H, t, J = 2.3; 7.3 Hz, H-2′′), 2.25 (2H, t, J = 2.3; 7.3; 14.7 Hz, 2′′′), 1.48 (4H, brs, J = 6.7 Hz, 3′′/3′′′), 1.24 (58H, brs, 4′′- 20′′/ H-4′′′-15′′′), 0.84 (6H, t, J = 6.5 Hz, H-21′′/16′′′);13C-NMR (125 MHz, DMSO-d6): δC : 172.2 (C-1′′′), 172.1 (C-1′′), 98.0 (C-1′), 74.0 (C-4′), 72.6 (C-3′), 71.3 (C-2′), 69.4 (C-2), 68.2 (C-5′), 64.3 (C-3), 62.3 (C-1) 54.4 (C-6′), 33.2 (C-2′′), 33.1 (C-2′′′), 28.7 (C-4′′-7′′, C-9′′-18′′/4′′′-7′′′, C-9′′′-13′′′), 28.4 (C-8′′/8′′′), 24.1 (C-3′′/3′′′), 21.8 (C-20′′/15′′′), 13.6 (C-21′′/16′′′). Antitubercular activity
For the present study, the mycobacteria (M. tuberculosis) used was a clinical isolated strain resistant to Isoniazid codifies as AC 45 (this strain was obtained from Sangmelima district’s Hospital in South Region of Cameroon). The genetical profile of the resistance has been carried out at Laboratory for Tuberculosis Research (Biotechnology Centre, University of Yaoundé I) through Line probe Assay method. The mycobacteria strain has been cultured at 37 oC for two week in Middlebrook 7H9 (Himedia, India) supplemented with 0.05% (v/v), 2% glycerol and 10% OADC (oleic acid-albumin-dextrose-catalase of Liofilchem s.r.l, Italia). The optical density of 0.45 to 0.55 was measured using spectrophotometer at 550 nm to obtain a suspension of 1.5 x10⁸ UFC/mL (Collins et al. 1997).
The activity of all phytochemicals (extract and pure compounds) against the aforementioned
4 previously by Collins et al. 1997 and Jiménez-Arellanes et al. 2003; 2007. In a 96 well microplates, all wells received 100 µL of supplemented Middlebrook 7H9 broth, then working metabolites solutions (100 µL) were poured into the first well of each row, from which two-fold dilution series were made through the microplate column. The test inoculum (100 µL) was added to all testing wells, as well as to the drug-free control wells. The final concentration of DMSO in wells was 7% v/v. The final concentrations tested ranged from 250 to 0. 244 µg/mL for pure compounds and 5000 to 4,882 µg/mL for extracts. Rifampicin was used as standard drug. Each concentration was assayed in triplicate. Each microplate was sealed with parafilm paper and incubated for 14 days at 37oC. After that, 40 µL of Alamar blue solution was added to two columns of each triplicate in other to show mycobacterial growth and the plate were re-incubated at 37oC for 24 h. After one day of incubation, the Minimal Inhibitory Concentration (MIC) was defined as the lowest concentration of phytochemicals that inhibited the bacterial growth (prevents a color change from blue to pink) after incubation time (CLSI 2011). The Minimal Bactericidal Concentration (MBC) determination, 50 μL of each wells which concentration were ≥ MIC was sub-cultured in 150 μL of Mbk 7H9 medium and incubated at 37 ° C. for 10 days, then mycobacterial growth was carried out by addition of 40 μL of alamar blue. MBC was defined as the lowest concentration of extract at which no visible growth of the germ was observed (CLSI 2011).
O O O HO OH OH NH2 O O O H H H H H H 1 2 3 1" 2" 21" 9" 1''' 2''' 16''' 8''' 16''' 1' 2' 5' 6' H H
5
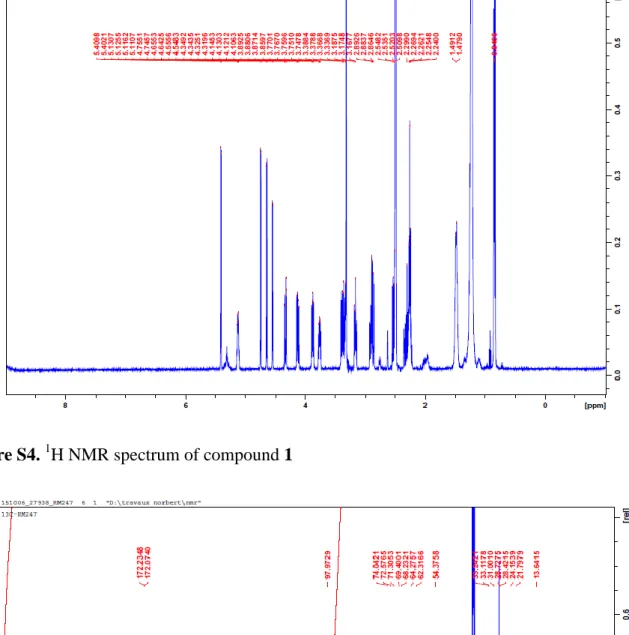
Table S1: 1H and 13C-NMR spectroscopic data of compound 1 (500 and 125 MHz in
DMSO-d6) δ in ppm Position δC DEPT δH (J in Hz) HMBC (C→H) 1 62.3 CH2 4.34 (dd, 2.9; 9.2) 4.14 (dd, 2.8; 12.1) H-C(2) ; H-C(3) 2 69.4 CH 5.13 (dddd, 2.6; 4.7; 7.3; 10.0) H-C(1) ; H-C(3) 3 64.3 CH2 3.89 (ddd, 6.0; 10.6; 16.4) 3.39 (m, 6.0; 16.4) H-C(1) ; H-C(2) Sugar 1′ 98.0 CH 4.40 (d, 3.9) C(2′) ; C(3); H-C(5′) 2′ 71.3 CH 3.17 (dd, 3.6; 9.8) H-C(1′) ; H-C(3′) 3′ 72.6 CH 3.36 (m) H-C(1′) ; H-C(4′) 4′ 74.0 CH 2.86 (m) H-C(2′) ; H-C(5′) 5′ 68.2 CH 3.76 (ddd, 1.6; 5.3; 9.6) H-C(1′) ; H-C(6′) 6′ 54.4 CH2 2.89 (m, 4.5) 2.52 (dd, 6.6; 14.0) H-C(4′) ; H-C(5′) Acyl (C21) 1′′ 172.1 C H-C(2) ; H-C(2′′) 2′′ 33.2 CH2 2.29 (t, 2.3; 7.3) H-C(3′′) ; H-C(4′′) 3′′ 24.1 CH2 1.48 (m, 6.7) H-C(2′′) 4′′-7′′ 28.7 CH2 1.24 (brs) H-C(2′′-8′′) 8′′ 28.4 CH2 1.24 (brs) H-C(7′′); H-C(10′′) 9′′-18′′ 28.7 CH2 1.24 (brs) H-C(11′′-20′′) 19′′ 31.0 CH2 1.24 (brs) H-C(20′′); H-C(21′′) 20′′ 21.8 CH2 1.24 (brs) H-C(21′′) 21′′ 13.6 CH3 0.84 (t, 6.5) H-C(19′′-20′′) Acyl (C16) 1′′′ 172.2 C C(1); C(2′′′); H-C(3′′′) 2′′′ 33.1 CH2 2.25 (t, 2.3; 7.3; 14.7) H-C(3′′′) 3′′′ 24.1 CH2 1.48 (brs) H-C(2′′′); H-C(4′′′) 4′′′-7′′′ 28.7 CH2 1.24 (brs) H-C(5′′′-9′′′) 8′′′ 28.4 CH2 1.24 (brs) H-C(9′′′) 9′′′-13′′′ 28.7 CH2 1.24 (brs) H-C(7′′′-15′′′) 14′′′ 31.0 CH2 1.24 (brs) H-C(16′′′) 15′′′ 21.8 CH2 1.24 (brs) H-C(16′′′) 16′′′ 13.6 CH3 0.84 (t, 6.5) H-C(15′′′)
Table S2. MIC and MBC values of the methanol extract and the isolated compounds against
clinical isolate strain of Mycobacterium tuberculosis (AC 45)
Plant species/Compounds MICa (µg/mL) MBCb (µg/mL) MBC/MIC
R. caffra 312.5 312.5 1
1 7.8125 31.25 4
2 31.25 125 4
3 62.5 125 4
6
7 125 125 1
RMP 0.976 7.8125 8
aMinimum Inhibitory Concentration b
Minimum Bactericidal Concentration RMP = Rifampicin
7
8
Figure S4. 1H NMR spectrum of compound 1
9
Figure S6. 1H- 1H COSY spectrum of compound 1
10
11
12
Figure S10. Genotype profile of M. tuberculosis codifies AC 45 References
Clinical and Laboratory Standards Institute. 2011. Susceptibility Testing of Mycobacteria, Nocardiae, and Other Aerobic Actinomycetes-Second Edition: Approved Standard M24-A2 Wayne, PA, USACLSI.
Collins L, Franzblau SG. 1997. Microplate alamar blue assay versus BACTEC 460 system for high-throughput screening of compounds against Mycobacterium tuberculosis and Mycobacterium avium. Antimicrob Agents Chemoth. 41: 1004–1009.
Jiménez-Alleranes A, Meckes M, Ramirez R, Torres J, Herrera-Luna J. 2003. Activity against multidrug-resistant Mycobacterium tuberculosis in Mexican plants used to treat respiratory diseases. Phytother Res. 17: 903-908.
Jiménez-Alleranes A, Meckes M, Torres J, Herrera-Luna J. 2007. Antimycobacterial triterpenoids from Lantana