HAL Id: hal-00298941
https://hal.archives-ouvertes.fr/hal-00298941
Submitted on 2 Apr 2008
HAL is a multi-disciplinary open access
archive for the deposit and dissemination of sci-entific research documents, whether they are pub-lished or not. The documents may come from teaching and research institutions in France or abroad, or from public or private research centers.
L’archive ouverte pluridisciplinaire HAL, est destinée au dépôt et à la diffusion de documents scientifiques de niveau recherche, publiés ou non, émanant des établissements d’enseignement et de recherche français ou étrangers, des laboratoires publics ou privés.
Observing soil moisture temporal variability under
fluctuating climatic conditions
A. Longobardi
To cite this version:
A. Longobardi. Observing soil moisture temporal variability under fluctuating climatic conditions. Hydrology and Earth System Sciences Discussions, European Geosciences Union, 2008, 5 (2), pp.935-969. �hal-00298941�
HESSD
5, 935–969, 2008 Soil moisture temporal patterns and variation A. Longobardi Title Page Abstract Introduction Conclusions References Tables Figures ◭ ◮ ◭ ◮ Back CloseFull Screen / Esc
Printer-friendly Version Interactive Discussion Hydrol. Earth Syst. Sci. Discuss., 5, 935–969, 2008
www.hydrol-earth-syst-sci-discuss.net/5/935/2008/ © Author(s) 2008. This work is distributed under the Creative Commons Attribution 3.0 License.
Hydrology and Earth System Sciences Discussions
Papers published in Hydrology and Earth System Sciences Discussions are under open-access review for the journal Hydrology and Earth System Sciences
Observing soil moisture temporal
variability under fluctuating climatic
conditions
A. Longobardi
Department of Civil Engineering, University of Salerno, Via Ponte Don Melillo, 84084 Fisciano(SA), Italy
Received: 18 February 2008 – Accepted: 18 February 2008 – Published: 2 April 2008 Correspondence to: A. Longobardi ([email protected])
HESSD
5, 935–969, 2008 Soil moisture temporal patterns and variation A. Longobardi Title Page Abstract Introduction Conclusions References Tables Figures ◭ ◮ ◭ ◮ Back CloseFull Screen / Esc
Printer-friendly Version Interactive Discussion
Abstract
The paper focuses on the observation of interannual and intra-annual climate variabil-ity impact on soil moisture temporal patterns and variation, for an experimental site lo-cated in Southern Italy and characterized by a typical Mediterranean climate. Analysed data consist of three years soil water content time series measured during the period 5
2004–2007, under intermediate (2004/2005), wet (2005/2006) and dry (2006/2007) climatological conditions. Results show that, for the case study, interannual precipi-tation fluctuation highly impact the annual soil moisture cycle, modifying the number and length of characteristic periods revealed by the cycle patterns. Annual rainfall vari-ation also affects the weight of the wet and dry soil moisture conditions, making the 10
distinction between preferred states more and more evident for increasing precipita-tion variability. Intra-annual precipitaprecipita-tion fluctuaprecipita-tion instead mainly impact soil moisture dynamic during the dry period of the year, shifting the position of the modes and the weight of the wet mode and nearly leading the dry mode to disappear for larger mean seasonal rainfall. Reported analyses would be a support and a premise for further 15
modeling implications.
1 Introduction
Soil moisture is a major control on many hydrological processes, especially runoff gen-eration, soil evaporation and plant transpiration. The role of soil moisture in a number of hydrological processes has been extensively studied and over the last two decades 20
the spatial and temporal variability of moisture content at the hillslope and catchment scales has received an increasing attention from the hydrological scientific community. To this aim dataset of observed in situ moisture measurements have been and are cru-cial. Unfortunately measured soil water content time series are not widely available and frequently simulated soil wetness series are used to support physical reasoning and 25
HESSD
5, 935–969, 2008 Soil moisture temporal patterns and variation A. Longobardi Title Page Abstract Introduction Conclusions References Tables Figures ◭ ◮ ◭ ◮ Back CloseFull Screen / Esc
Printer-friendly Version Interactive Discussion of its interaction with factors such as vegetation, soil types and topography (Wilson et
al., 2005). Above these, climate variability acts on soil water content dynamics as the external driving force through non linear processes.
The effect of climate characteristics on soil water balance turns into soil wetness dynamics that can be extremely different from each other. Grayson et al. (1997) dis-5
cussed average catchment wetness temporal patterns, estimated through a lumped conceptual model, for a number of climatic regions. They argued that, even though modelled average catchment wetness time series showed different patterns, there was evidence, in each series, for the presence of preferred wet and dry states and con-cluded stating that four basic modes of response in soil moisture do generally exist: 10
always dry, always wet, both wet and dry with rapid transition and both wet and dry with slow transition. The existence of preferred soil moisture states, both at the an-nual and seasonal growing temporal scale, has also been addressed in a stochastic soil water balance model at the point scale from many authors over a range of climatic environments (Rodriguez-Iturbe et al., 1991; D’Odorico et al., 2000; D’Odorico and 15
Porporato, 2004; Teuling et al., 2005). Analytical expression for the steady state prob-ability density functions of soil moisture was derived and the position and weight of the modes were investigated. As showed by the same authors, soil wetness modes are of great importance because indicate whether a system is located in one or another state and the transition between them is dominated by many variables such as climate, soil 20
type and vegetation.
Climate is however one of the major control on soil moisture dynamic and its vari-ability can have very important impacts, especially during the warm season, when soil water content is the result of the balance between precipitation input and enhanced evapotranspiration losses and when large and small soil moisture values are both 25
likely to occur, but with a different weight. An example of climate fluctuation effect on temporal soil wetness variability statistical properties has been given by D’Odorico et al. (2000). In a stochastic modelling approach they showed that, during the growing season, different combinations of climate, vegetation and soil types can lead to either
HESSD
5, 935–969, 2008 Soil moisture temporal patterns and variation A. Longobardi Title Page Abstract Introduction Conclusions References Tables Figures ◭ ◮ ◭ ◮ Back CloseFull Screen / Esc
Printer-friendly Version Interactive Discussion bimodal or unimodal modelled soil moisture distribution. A number of research papers
also appeared in the past literature, discussing the impact of climate fluctuation on vegetation patterns which are related to the soil water availability and thus, in turn, to the soil moisture dynamic (Rodriguez-Iturbe et al., 1999; Hupet and Vanclooster, 2002; Istanbulluoglu and Bras, 2006).
5
Based on observed soil moisture time series measured at the plot scale under ob-served fluctuating climatic conditions, in this paper the following points are addressed:
– soil water content annual cycle and characteristic phases assessment,
– existence of preferred dry and wet soil moisture states in a typical Mediterranean
climate; 10
– detection of changes in characteristic phases and modes of response induced by
climate variability;
– most probable soil moisture values and their weight under fluctuating climatic
con-ditions.
This research does not address the characterization of the statistical properties of soil 15
moisture variability for which the measurements temporal horizon would not be suffi-cient. The main objective is instead the observation of the impact of both intra-annual and interannual climate variability on soil moisture dynamic at the plot scale.
2 Experimental plot description
2.1 Plot set up 20
The experimental plot is located in Southern Italy, within the University of Salerno’s campus. The terrain consists of a smooth 35◦slope, with a flat area in the upper part which is contiguous to a car parking. Runoff from the car parking does not flow into the
HESSD
5, 935–969, 2008 Soil moisture temporal patterns and variation A. Longobardi Title Page Abstract Introduction Conclusions References Tables Figures ◭ ◮ ◭ ◮ Back CloseFull Screen / Esc
Printer-friendly Version Interactive Discussion experimental site. The slope is bounded by a 1 m retaining wall at the toe and a wood
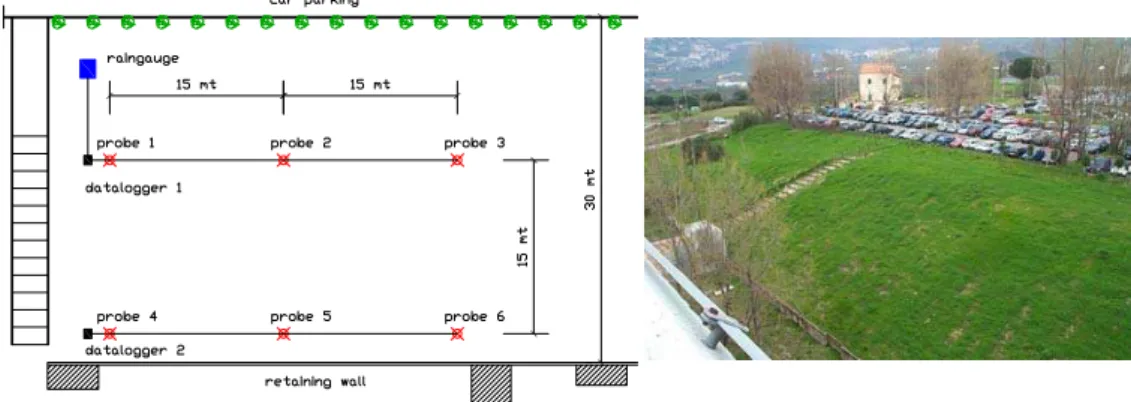
stairs was realized to cross it. The experimental plot has a 450 m2extension (15×30 m) and is located 15 m from the parking and 5 m from the stairs, within the slope area. The vegetation consists of perennial lawn grass (Fig. 1). Grain size distribution of collected samples shows a layered soil profile: a first layer ranging from 0 to 20 cm classified as 5
gravel with silt and clay, a second layer ranging from 20 to 60 cm classified as clay with silt sand and a third layer ranging from 60 to 80 cm classified as clayey silt with sand and gravel.
Meteorological and soil moisture measurements started in October 2004 and are currently in progress. Precipitation and air temperature are measured from an auto-10
matic weather station, every 10 min. Six EasyAG (Sentek Pty. Ltd., South Australia) capacitance probes were installed to continuously measure soil water content every 10 min. The probe consists of an access tube, with a 3.2 cm diameter, where four sen-sors (2.65 cm diameter) are inserted at 10, 30, 50 and 80 cm below the soil surface. Two data loggers are connected to the sensors and to the weather station and data are 15
send back to a remote computer.
A laboratory calibration, based on gravimetric water content determination, was car-ried out. Soil moisture measurements have an error standard deviation of ±2.72% V/V.
2.2 Regional and at-site climatic features 20
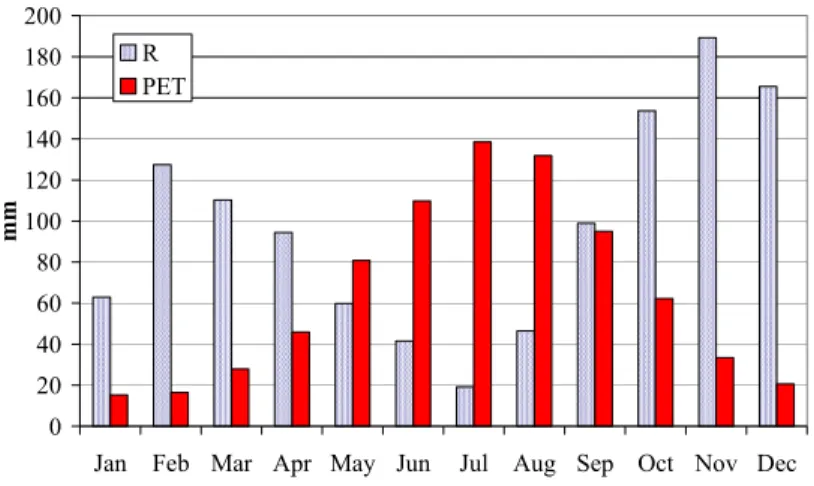
Mean monthly and yearly precipitation variability for the studied area has been ex-plained in a regional framework analysis as a log-linear function of terrain elevation (Longobardi et al., 2007). Figure 2 shows the climatic regime of the region. Pre-cipitation and temperature are in opposite phase: rainfall deficit and rainfall excess are clearly recognizable respectively during summer and winter time, as for a typi-25
cal Mediterranean climate. According to the Thornthwaite classification the climate is humid, with average regional annual rainfall equal to 1170 mm and average regional annual potential evapotranspiration equal to 780 mm.
HESSD
5, 935–969, 2008 Soil moisture temporal patterns and variation A. Longobardi Title Page Abstract Introduction Conclusions References Tables Figures ◭ ◮ ◭ ◮ Back CloseFull Screen / Esc
Printer-friendly Version Interactive Discussion At-site climatic features during the monitored period, from October 2004 to
Octo-ber 2007, revealed both an interannual, year-to-year, and an intra-annual, season-to-season, fluctuation: cumulate annual rainfall is different from year-to-year but also the way cumulate annual precipitation is distributed within the year is different from year-to-year. From now on we will intend the measurements period as split in three 5
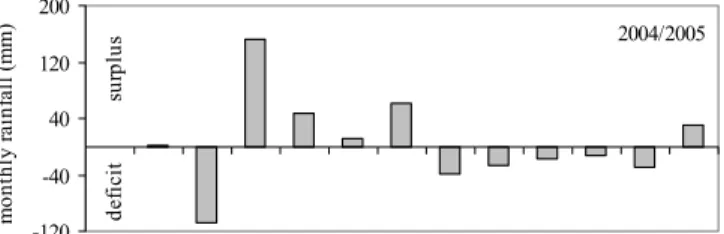
hydrological years, 2004/2005–2005/2006–2006/2007. Interannual climate fluctuation is showed through considerable precipitation excess, of about 38%, and precipitation deficit, of about 34%, occurred respectively during the year 2005/2006 and 2006/2007, compared to mean regional values. Surplus and deficit amounts, on a monthly scale, computed as the difference between observed and regional monthly rainfall amount, 10
are plotted in Fig. 3. Precipitation surplus and deficit throughout the year 2005/2006 and 2006/2007 are rather evident. Beside a fluctuation in the cumulative precipitation, annual rainfall variability is also evident as indicated by the precipitation coefficient of variation cv, a measure of sample variability computed as the ratio between the stan-dard deviation and the mean and used to compare sample characterized by different 15
mean value: years 2005/2006 and 2006/2007 are also in this case at the extremes, being characterized respectively by the lowest and the largest cv (Table 1).
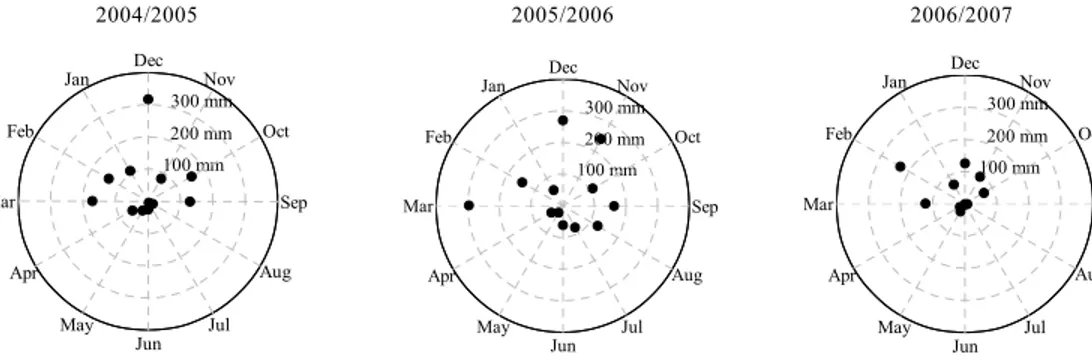
Interannual fluctuations are followed by season-to-season fluctuations. Monthly pre-cipitations are displayed in a polar plot in Fig. 4. The upper semicircle is representative of the wet winter season whereas the lower semicircle is representative of the dry 20
summer season. Wet and dry periods are indeed different from year-to-year. Large rainfall volume are pronounced in 2005/2006 wet and dry seasons whereas small rain-fall volume are evident in 2006/2007 wet and dry periods, with a peak in late winter time that will strongly affect the soil system dynamic, as later shown. More rainfall pattern characteristics have been empirically calculated to compare the seasonal pre-25
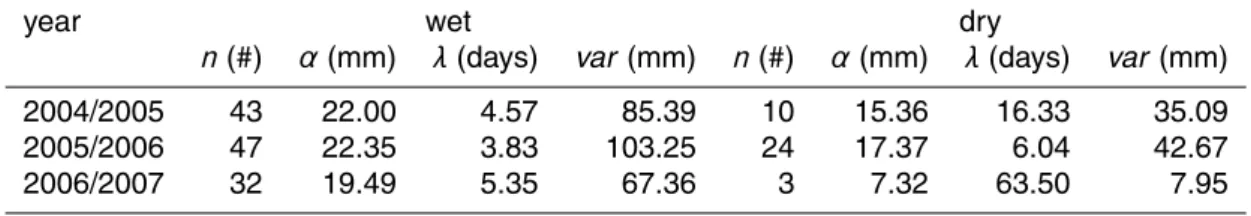
cipitation regimes: number of storm events (n), average storm depth (α) and average time of storm arrival (λ) for the wet and dry seasons are illustrated in Table 2. Wet winter season are comparable in terms of α and λ and mainly differ for the number of storm events, with abundant and scarce precipitation event occurred respectively
HESSD
5, 935–969, 2008 Soil moisture temporal patterns and variation A. Longobardi Title Page Abstract Introduction Conclusions References Tables Figures ◭ ◮ ◭ ◮ Back CloseFull Screen / Esc
Printer-friendly Version Interactive Discussion in 2005/2006 and 2006/2007. Dry summer semester showed instead a notable
intra-annual fluctuation: the number of events in 2005/2006 was more than double the num-ber of events in 2004/2005 whereas in 2006/2007 they were less than a third and about half the average storm depth. The average time of storm arrival λ, which is related to the precipitation coefficient of variation, is also highly variable, causing a strong vari-5
ability in the rainfall process during the dry periods.
Observed rainfall fluctuation, in this context, is not used as a measure of climate change and climate change impact on soil water dynamic, but as the input toward the characterization of the variability of soil moisture values and patterns. A monitored pe-riod characterized by such climate variability allows the assessment of the importance 10
and the effects of a different meteorological input over observed soil moisture dynamics at a particular site.
3 The experimental plot monitored soil moisture evidences: the annual average soil moisture pattern
As an example, Fig. 5 shows the temporal variability of near surface (10 cm) and deep 15
(80 cm) soil moisture during the monitored period, at probe 1 indicated in Fig. 1. To filter high-frequency variations in soil moisture values a 10 day running mean was applied to the data. In the same picture the bar chart of 10 days cumulate rainfall is also represented. Both surface and deep soil moisture response to rainfall input is very rapid, with soil water content increase occurring respectively within 10 min and 20
1 h. A seasonal pattern is clearly visible. Soil moisture approaches the largest values in winter time, about 35% V/V, close to the average soil porosity (n=0.41) when soil is saturated or nearly saturated because of precipitation excess over evapotranspiration. On the other hand the lowest values are approached in summer time, about 10% V/V, when soil is near its field capacity because dried out by enhanced evapotranspiration 25
losses. Evapotranspiration losses rate decrease from near surface to deeper layer and deep soil moisture lower threshold, about 15% V/V, is overall larger than the lower
HESSD
5, 935–969, 2008 Soil moisture temporal patterns and variation A. Longobardi Title Page Abstract Introduction Conclusions References Tables Figures ◭ ◮ ◭ ◮ Back CloseFull Screen / Esc
Printer-friendly Version Interactive Discussion threshold corresponding to surface layers. Even though the concept of preferred states
in soil wetness pattern was derived by Grayson et al. (1997) at the catchment scale, prolonged wet and dry conditions are also evident at the plot scale for the case study. Many of the illustrated pattern features are indeed common to other experimental sites (Robock et al., 2000) but what is important to underline is however that the pattern 5
appears dissimilar from year-to-year.
With the aim to observe and characterize the experimental plot annual soil wetness cycle, daily soil moisture values, over a year round period, have been calculated by averaging observed values during the monitored period. Comparisons between drying and wetting trends and differences between different soil depths have also been con-10
sidered. The observed soil moisture cycle shows a strong seasonality and reveals the existence of a wet and a dry phase and of two transition periods in between them, the drying and the wetting transition periods (Fig. 6). The wet phase occurs during Novem-ber to late March and is characterized by the largest soil water content, regardless to the measurement level. Soil moisture profiles are almost identical, with the 50 cm soil 15
layer profile sensibly higher, perhaps because of the vertical soil heterogeneity with an high clay content layer at this depth that reduces the infiltration rate and is responsible for a different saturation degree. During an initial period, from November to February, soil moisture series show an evident sinusoidal pattern, caused by the balance be-tween forces that remove or replenish soil water content. At the end of this period the 20
largest fraction of winter rainfall volume has occurred and soil moisture is at or near saturation with a rather constant profile lasting for about two months until the end of the wet phase. In late March, when air temperature starts to increase, the drying tran-sition period begins. It is characterized by soil water depletion process, which appears to occur in a two subsequent steps: a first steep decline lasting for one to two weeks, 25
from late March to April, followed by a steady period lasting about a month, from April to May, followed again by a second steep decline lasting for one to two weeks, from late May to June. Soil moisture depletion is greater for the surface layer (10 and 30 cm) for which the impact of evapotranspiration is greatest, but the rate of soil depletion is
sim-HESSD
5, 935–969, 2008 Soil moisture temporal patterns and variation A. Longobardi Title Page Abstract Introduction Conclusions References Tables Figures ◭ ◮ ◭ ◮ Back CloseFull Screen / Esc
Printer-friendly Version Interactive Discussion ilar for all the soil layers. At the end of the drying transition period, in June, soil water
content approaches the lowest residual values and the dry phase starts, lasting until late August. During this phase, soil moisture series show again a sinusoidal pattern, similarly to the wet phase, more evident for the near surface layer, which is the buffer layer between the soil and the atmosphere and thus exposed to an enhanced variability 5
in losses and input to the system. The sinusoidal pattern rise, also in this case, from the balance between forces that remove or replenish soil water content. In late August, when air temperature starts to decrease and rainfall exceeds evapotranspiration, the wetting transition period begins lasting for about a month and showing a steep increase in soil moisture content, which approaches the largest value at the beginning of the wet 10
phase. The rate of observed moisture replenishment is larger compared to the rate of observed moisture depletion likely because of the stronger non linearity of the wetting up process caused by an enhanced lateral redistribution during the winter period for large soil moisture values (Grayson et al., 1997).
A similar annual cycle was found in a conceptual modelling approach applied in the 15
same climatic environment, even though the modelled annual cycle revealed a rather short and less evident dry phase (Longobardi and Villani, 2006). Perhaps the climate fluctuation during the monitored period strongly affected the illustrated average soil moisture annual cycle, evaluated over a relatively short record, and is perhaps respon-sible for some unusual features. Further discussions about cycle temporal variability 20
are dealt with in the following paragraphs.
The same daily averaged soil moisture series have been used to investigate the av-erage soil moisture temporal variability within the year, at each depth. The coefficient of variation cv has been assumed as a measure of variation to compare average mois-ture contents which are strongly different from month to month. It has been calculated 25
on a monthly base and plotted in Fig. 7. Temporal variability, as well as the annual soil moisture cycle, revealed a seasonal pattern, with the largest variability that appears during the summer months. In winter time the coefficients of variation are smaller, with the lowest values from February to March, as it would have been expected from the
HESSD
5, 935–969, 2008 Soil moisture temporal patterns and variation A. Longobardi Title Page Abstract Introduction Conclusions References Tables Figures ◭ ◮ ◭ ◮ Back CloseFull Screen / Esc
Printer-friendly Version Interactive Discussion observation of the average soil moisture cycle, and the profiles are almost coincident,
that is water content variability during the wet periods is the same at each soil depth. In summer time the coefficients of variation are larger and the profiles are not longer coincident, with seasonal temporal variability increasing from deeper to near surface layers.
5
Soil moisture spatial variability does not represent a focus point in this paper but, for sake of completeness, Fig. 8 compares water content temporal patterns measured at the six probes, at 30 cm depth. An evident similar temporal pattern has been found at the remaining probes, even though soil heterogeneity that occur both vertically and horizontally is responsible for a different saturation degree at each monitored point. 10
Mean soil moisture values range from a minimum of 22.5% at probe 1 up to 42.8% at probe 2, with a pattern similarity between vertically aligned probes, which are probe 1– probe 4 and probe 2–probe 5. A less permeable layer above 30 cm is likely the cause of larger soil water content values along the middle vertical alignment (probe 2–probe 5) compared to remaining ones. Same findings hold at 10 cm and at 80 cm depth, while 15
soil moisture monitored at 50 cm appears to be rather uniform over the plot.
4 Soil moisture temporal variability under fluctuating climatic conditions
Soil moisture temporal variability is firstly explored over a year round base and, be-cause of a large intra-annual variability of climate conditions, also on a wet period and dry period base. The wet and dry periods we refer to in this paragraph respectively 20
represent the climatological wet and dry season for the studied area: the wet season, from October to April, is characterized by rainfall surplus (rainfall exceeding evapotran-spiration), whereas the dry season, from May to September, is characterized by rainfall deficit (evapotranspiration exceeding rainfall). Since soil water content measurements from multiple depths were available, time series, mean and standard deviation statis-25
tics, histograms and empirical probability density functions have been evaluated, plot-ted and analysed for each depth. Moreover, to capture the soil behaviour over the
HESSD
5, 935–969, 2008 Soil moisture temporal patterns and variation A. Longobardi Title Page Abstract Introduction Conclusions References Tables Figures ◭ ◮ ◭ ◮ Back CloseFull Screen / Esc
Printer-friendly Version Interactive Discussion rooting-zone, depth averaged soil moisture conditions have also been determined.
Dif-ferent methods of finding average can be used (Miller et al., 2007): an arithmetic or equal weighted mean, a zone weighted mean, root probability distribution weighted mean. In this study a weighted depth average has been used, dividing the root zone into portions represented by each measurement.
5
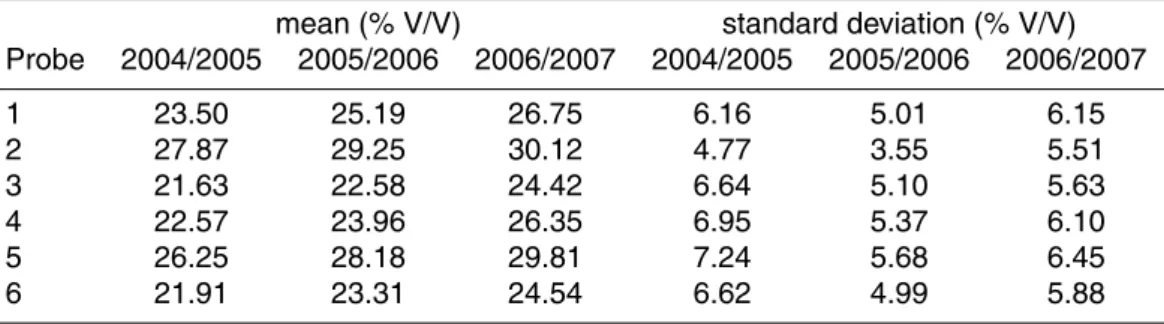
Mean depth averaged soil moisture are illustrated in Table 3, at each probe, with their statistics on a year round base over the monitored period. Contrarily to what would have been expected given the discussed precipitation regimes, which showed a particularly wet condition during the year 2005/2006, mean depth averaged soil wa-ter content appears higher during the year 2006/2007, when the annual precipitation 10
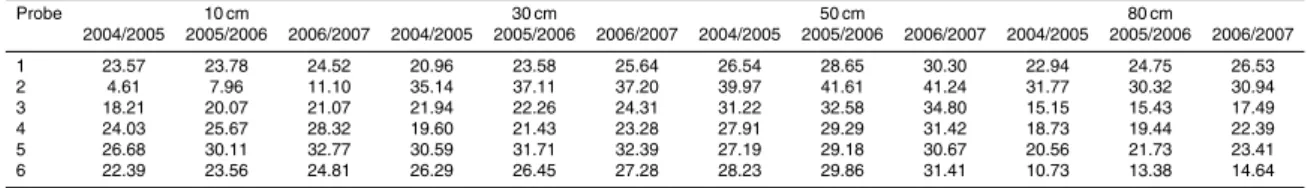
amount was in deficit, of about 34%, compared to mean regional values. Similar re-sults are found in Table 4, where mean observed soil water content are illustrated at each probe, at each monitored depth and over the monitored period. Perhaps this unexpected response is not related neither to the particular method used to estimate depth averaged soil water content nor to the relative rainfall amount occurred during a 15
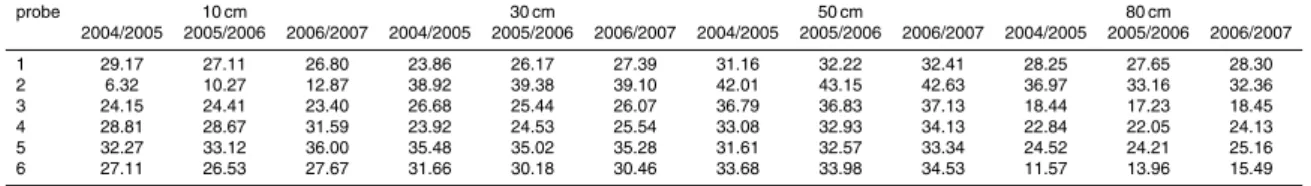
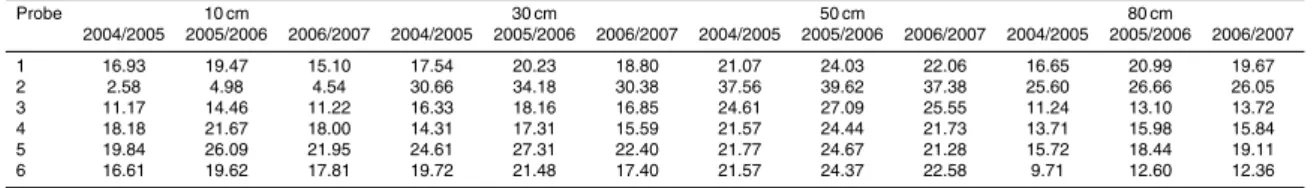
particular year. The soil system response is, in this case, more likely to be related to the seasonal rainfall pattern and to the rainfall intra-annual variability. Larger mean soil moisture values found in year 2006/2007 on a year round base, are explained by the large mean soil moisture values during the wet period of the same year which, even though represents the driest year within the investigated period, had 95% of annual 20
rainfall amount occurred within the wet season and a large portion occurred during the last months of that season, causing high water content values at the begin of the dry period (Table 5). On the contrary the wettest year, 2005/2006, had a rainfall occur-rence of 28% of annual precipitation within the dry season, explaining the large mean soil moisture values during this period of the year (Table 6).
25
To better understand the effects of climate fluctuations over soil moisture and its variability at the studied site, annual cycle patterns and their variability are discussed in the following paragraphs.
HESSD
5, 935–969, 2008 Soil moisture temporal patterns and variation A. Longobardi Title Page Abstract Introduction Conclusions References Tables Figures ◭ ◮ ◭ ◮ Back CloseFull Screen / Esc
Printer-friendly Version Interactive Discussion 4.1 Annual soil moisture patterns
To underline the impact of climate year-to-year and seasonal variability, the annual soil moisture cycles pattern for the whole monitored period has been plotted in Fig. 9. Comparisons are made with the annual average soil moisture cycle in Fig. 6.
In 2004/2005 the dry phase is not recognizable: the drying period, which starts 5
earlier, last until late August, immediately followed by the wetting period. The rate of moisture depletion is reduced whereas the rate of moisture replenishment is enhanced. The near surface soil layer shows the larger variability with the highest and lowest mois-ture content respectively during the wet and dry climatological season. The sinusoidal pattern only persists during the drying transition phase.
10
In 2005/2006 the four discussed phases are all recognizable. The drying transition phase is shorter and faster for the 10 and 30 cm soil layer. The dry phase is longer, from early May to late August, but wetter and a sinusoidal pattern persists for the shallower soil layers. These features are the result of the higher concentration of annual rainfall during the dry climatological season. The wetting transition phase is longer and evident 15
and has a similar rate of replenishment for all the soil layers.
The 2006/2007 is characterized by very dry climatological condition throughout the year and a prolonged period of three months, from June to August, where no rainfall occurred, which represent an extreme condition also for a typical Mediterranean cli-mate. Nevertheless soil water dynamic seems not to be significantly affected, in that 20
water content dynamic during this hydrological year is very similar to 2004/2005, when no such extreme climatological conditions were experienced. A large rainfall volume occurred at the end of the wet season is perhaps responsible for high soil moisture val-ues at the beginning of the dry season and of the evident and steep drying transition period, rapidly followed by the wetting transition period. The dry prolonged phase does 25
not appear also in 2006/2007. As during the remaining years, the drying and wetting transition periods have a sinusoidal pattern, with a rate of replenishment that is faster than the rate of depletion.
HESSD
5, 935–969, 2008 Soil moisture temporal patterns and variation A. Longobardi Title Page Abstract Introduction Conclusions References Tables Figures ◭ ◮ ◭ ◮ Back CloseFull Screen / Esc
Printer-friendly Version Interactive Discussion A result gained from the observation of soil moisture annual patterns for the case
study is that the soil system response is strongly affected by climatic conditions: mean soil water content, both at the annual and seasonal scale, change under fluctuating climatic conditions, but what is more important is that also annual pattern features change under fluctuating climate conditions, modifying the number and the extension 5
of characteristic soil moisture phases. For a typical Mediterranean climate, with winter dominating rainfall and opposite phase between temperature and precipitation, pro-longed wet winter periods as well as propro-longed dry summer periods would have been expected. Figure 9 shows that, given occurred climatological conditions, a soil wetness dry persistent and prolonged warm period is not typical for the case study climate. An 10
extended warm period of soil wetness fluctuating around a constant value was only detected in 2005/2006, perhaps induced by the large rainfall volume occurred during this period. Average water content is about 17%, well above 7% approached during the warm seasons in 2004/2005 and 2006/2007, thus it cannot be considered as a real dry phase. The mode of response of the soil system seems then not to be unique, 15
but potentially changing from year-to-year, depending on the distribution of cumulate annual rainfall during the year. This finding has important implications for soil moisture dynamics models implementation and for seasonal rainfall-runoff models that often use variable model parameters according to predefined seasons or moisture phases. 4.2 Most probable values and their weight under fluctuating climatic conditions 20
Illustrated soil moisture annual cycles underline the existence of wet and dry persis-tent soil moisture conditions, even though their weight is different from year-to-year. They have been termed in the past as preferred states and represent, in a probabilis-tic framework, the most probable conditions in which soil wetness is located in. The existence and characterization of preferred dry and wet states in observed data has 25
been investigated through the inspection of empirical soil moisture probability density functions (PDF). The shifting of the wet and dry modes and their weight variability are reported as the effect of precipitation fluctuation. Results are presented for the near
HESSD
5, 935–969, 2008 Soil moisture temporal patterns and variation A. Longobardi Title Page Abstract Introduction Conclusions References Tables Figures ◭ ◮ ◭ ◮ Back CloseFull Screen / Esc
Printer-friendly Version Interactive Discussion surface layer at 10 cm and for the deep layer at 80 cm respectively in Fig. 10a and b).
On the year round base, PDF are overall bimodal, regardless to the soil depth, and the effect of climate interannual variability is more evident on near surface layer than it is on deeper layers. Compared to the dry mode, the wet mode is always associ-ated to a larger weight, because of climatic conditions inducing wet persistent state 5
for prolonged period of the year, and it is also evident that the ratio between the wet and dry mode probabilities is different from year-to-year. Coefficients of variation in Table 1 underline a low rainfall variability in 2005/2006 and an high rainfall variability in 2006/2007. It seems thus that an increase in rainfall variation determines an increase in the difference between the dry and wet mode weights (Rodriguez-Iturbe et al., 1991). 10
This would be a consequence of an enhanced dynamic process of switching between two preferential states caused by highly fluctuating precipitation input. Over interan-nual, intra-annual rainfall variability also affects the PDF shape: while the wet modes appear comparable from year-to-year, as it will be later discussed, the dry mode in 2005/2006 is larger compared to the remaining year, as it would have been expected 15
given the summer seasonal rainfall regime of this particular year.
On the wet period base the PDFs are overall unimodal regardless to the soil depth and the interannual rainfall fluctuation seems not significantly to affect the soil mois-ture dynamic. The mean values of the distribution (the wet mode) are similar from year-to-year but larger for the near surface layer compared to deep layer. The intra-20
annual variability affects the weight of the peak of the distribution and its variation: as previously commented, the examined wet periods appear rather similar in terms of number of storm events, average storm depth, average time of storm arrival (Table 3) and only differ for the variance of the precipitation occurred during the wet climatolog-ical season. Large seasonal rainfall variability is associated to low peak and broad 25
soil moisture PDF distribution. The year 2005/2006 soil moisture PDF shows indeed a larger variability compared to the remaining, because of the winter seasonal rainfall regime of this particular year, with a large percentage of annual rainfall occurred during the dry season and the larger seasonal variability.
HESSD
5, 935–969, 2008 Soil moisture temporal patterns and variation A. Longobardi Title Page Abstract Introduction Conclusions References Tables Figures ◭ ◮ ◭ ◮ Back CloseFull Screen / Esc
Printer-friendly Version Interactive Discussion In the past literature soil moisture PDF during the dry season have been reported as
bimodal PDF over a range of climatic environment (D’Odorico et al., 2000; D’Odorico and Porporato, 2004; Teuling et al., 2005; Teuling et al., 2007). Summer measured water contents at the studied plot show indeed a bimodal frequency distribution as a signature of a switching process between two preferential states, characterized by 5
either dry or wet average soil moisture conditions, which also occurs during the dry season of a Mediterranean climate. Nevertheless the shape of the bimodal distribution changes form year-to-year because of the interannual rainfall variability. A moderate increase in the average storm depth associated to a large reduction in the average time of storm arrival (Table 3), which occurred in 2005/2006, determines a shift in the posi-10
tion and the weight of the dry mode which approaches the wet mode and gives a nearly unimodal shape to the probability distribution function. On the other hand, a large re-duction in the average storm depth associated to a large increase in the average time of storm arrival (Table 3), which occurred in 2006/2007, determines an increase in the dry mode weight over the wet mode. Similar results were found by D’Odorico et al. (2000) 15
in measuring the impact of climate fluctuation on preferential states of seasonal soil moisture through a stochastic model of soil water balance. While the positions of the modes seem mainly dictated by rainfall depth and frequency, the difference between dry and wet modes weight seems, as in the case of the annual time scale, to be as-sociated to the rainfall variability (lower cv, Table 1), in that reduced rainfall variation 20
turns into a reduction in the difference between preferred states probabilities.
Within the dry period, soil depth affects the PDF shape and characteristics at a larger extent than it does during the wet period. In a climatological intermediate year, near surface soil moisture profile is highly variable between a dry and a wet water content threshold, with a consequent similar weight for the dry and wet mode. Deeper soil 25
moisture profile, where evapotranspiration losses are smaller, is instead less variable with an initial high but short water content plateau and a following smooth depletion curve, an evident different weight for the dry and wet mode and a dominant dry mode weight. In extremely dry years, also near surface soil moisture profile is less variable
HESSD
5, 935–969, 2008 Soil moisture temporal patterns and variation A. Longobardi Title Page Abstract Introduction Conclusions References Tables Figures ◭ ◮ ◭ ◮ Back CloseFull Screen / Esc
Printer-friendly Version Interactive Discussion and the weight of the dry mode becomes more evident. It is also worth remark that
hydraulic soil properties at considered depths are different, because of a vertical soil heterogeneity, and that observed different behaviours may also be a consequence of soil types effect.
5 Summary and conclusions 5
In this paper the impact of both intra-annual and interannual climate fluctuation on observed soil moisture dynamic, at the plot scale, is investigated.
At the annual temporal horizon, four distinct phases have been observed in soil mois-ture cycle. These are a wet phase, from November to late March, characterized by the largest soil water content and a low variability, a drying transition period, from April 10
to late June, which shows a water content depletion caused by increasing evapotran-spiration losses over precipitation input, a dry phase, characterized by the lowest soil moisture values and the larger variability, and a wetting transition period from Septem-ber to late OctoSeptem-ber, which shows the soil moisture replenishment process, caused by increasing precipitation input, characterized by a faster rate compared to the depletion 15
process. Prolonged wet and dry conditions are evident but their weights change from year-to-year. While the wet phase and the transitional periods have been observed in all years of the monitored period, the dry prolonged phase has only been observed in 2005/2006 which was an extremely wet year and had a large summer seasonal rainfall. Indeed it has an average water content well above the values approached during the 20
warm seasons of the monitored period and cannot be considered as a real dry phase. This would lead to the thesis that the soil system mode of response is not unique but potentially changing from year-to-year under fluctuating climatic conditions. This finding has important implications for soil moisture dynamics models implementation and for seasonal rainfall-runoff models that often use variable parameters according to 25
predefined seasons or moisture phases.
relation-HESSD
5, 935–969, 2008 Soil moisture temporal patterns and variation A. Longobardi Title Page Abstract Introduction Conclusions References Tables Figures ◭ ◮ ◭ ◮ Back CloseFull Screen / Esc
Printer-friendly Version Interactive Discussion ship has been moreover investigated through the inspection of empirical soil moisture
probability density functions (PDF). The shifting of the wet and dry modes and their weight variation has been reported as the effect of precipitation fluctuation. On an annual time scale, two distinct preferred states are evident but their characteristics change from year-to-year. The distinction between preferred states weights, with the 5
wet dominating the dry mode because of climatic conditions inducing wet persistent state for prolonged period of the year, is more and more evident for increasing precip-itation variability. On a wet seasonal scale, soil moisture dynamic is not significantly affected by precipitation variability: a moderate increase in the mean soil moisture (wet mode) is associated to larger seasonal rainfall. Soil moisture dynamic during the dry 10
climatological season is instead affected at a larger extent by precipitation fluctuation. Two distinct preferred states and a bimodal distribution function are also evident, for the case study, during this period of the year. The states shift in the position (modes value) and in their weight (probability values) mainly depending on rainfall depth and frequency and seasonal rainfall variability. The larger wet mode weights appear as-15
sociated to the larger seasonal rainfall and the same is responsible for a shift of the dry mode toward the wet mode which lead to a nearly unimodal shape of the proba-bility distribution function. A reduction of rainfall variaproba-bility is instead associated to a reduction in the difference between dry and wet modes weights and vice versa.
Presented results and discussions for the investigated site are only based on em-20
pirical analyses of a relatively short record and would represent a premise for further modeling implications.
Acknowledgements. The author is beholden to P. Villani, who contributed to this work with
stimulating discussions. This research was financially supported by the Department of Civil Engineering, University of Salerno and by the Instruction, University and Research Italian
Min-25
istry (MIUR) under the grant PRIN 2005 2005080490 003 and PRIN 2004 085575 002. The mention of trade name or manufacturer names is made for information only and does not imply an endorsement nor recommendation by the author.
HESSD
5, 935–969, 2008 Soil moisture temporal patterns and variation A. Longobardi Title Page Abstract Introduction Conclusions References Tables Figures ◭ ◮ ◭ ◮ Back CloseFull Screen / Esc
Printer-friendly Version Interactive Discussion
References
D’Odorico, P., Ridolfi, L., Porporato, A., and Rodriguez-Iturbe, I.: Preferential states of soil moisture: The impact of climate fluctuation, Water Resour. Res., 36(8), 2209–2219, 2000. D’Odorico, P. and Porporato, A.: Preferential states in soil moisture and climate dynamics, Proc.
Natl. Acad. Soc., 101(24), 8848–8851, 2004.
5
Grayson, R. B., Western, A. W., Chiew, F. H. S., and Bloschl, G.: Preferred states in spatial soil moisture patterns: Local and nonlocal controls, Water Resour. Res., 33(12), 2897–2908, 1997.
Hupet, F. and Vanclooster, M.: Intraseasonal dynamics of soil moisture variability within a small agricultural maize cropped field, J. Hydrol., 261, 86–101, 2002.
10
Istanbulluoglu, E. and Bras, R. L.: On the dynamics of soil moisture, vegetation, and ero-sion: Implications of climate variability and change, Water Resour. Res., 42, W06418, doi:10.1029/2005WR004113, 2006.
Longobardi, A., Rossi, F., and Villani, P.: A case study: main hydrological drought indexes analysis in a GIS environment, in: Water resources assessment and management under
15
water scarcity scenarios, edited by: La Loggia, G., Aronica, T. A., and Ciraolo, G., edizioni CSDU, Milano, 29-48, 2007.
Longobardi, A. and Villani, P.: Seasonal response function for daily streamflow investigation, Phys. Chem. Earth, 31, 1107–1117, 2006.
Miller, G. R., Baldocchi, D. D., Law, B. E., and Meyers, T.: An analysis of soil moisture dynamics
20
using multi-year data from a network of micrometeorological observation sites, Adv. Water Resour., 30, 1065–1081, 2007.
Robock, A., Vinnikov, K. Y., Srinivasan, G., Entin, J. K., Hollinger, S. E., Speranskaya, N. A., Liu, S., and Namkhai, A.: The Global Soil Moisture Data Bank, B. Am. Meteorol. Soc., 81, 1281–1299, 2000.
25
Rodriguez-Iturbe, I., Entekhabi, D., and Bras, R. L.: Nonlinear dynamic of soil moisture at climate scale. 1. Stochastic analysis, Water Resour. Res., 27(8), 1899–1906, 1991.
Rodriguez-Iturbe, I., D’Odorico, P., Porporato, A., and Ridolfi, L.: On the spatial and temporal links between vegetation, climate and soil moisture, Water Resour. Res., 35(12), 3709–3722, 1999.
30
Teuling, A. J., Uijlenhoet, R., and Troch, P. A.: On bimodality in warm season soil moisture observations, Geophys. Res. Lett., 32, L13402, doi:10.1029/2005GL023223, 2005.
HESSD
5, 935–969, 2008 Soil moisture temporal patterns and variation A. Longobardi Title Page Abstract Introduction Conclusions References Tables Figures ◭ ◮ ◭ ◮ Back CloseFull Screen / Esc
Printer-friendly Version Interactive Discussion Teuling, A. J., Hupet, F., Uijlenhoet, R., and Troch, P. A.: Climate variability effects on spatial soil
moisture dynamics, Geophys. Res. Lett., 34, L06406, doi:10.1029/2006GL029080, 2007. Wilson, D. J., Western, A. W., and Grayson, R. B.: A terrain and data-based method for
gener-ating the spatial distribution of soil moisture, Adv. Water Resour., 28, 43–54, 2005.
HESSD
5, 935–969, 2008 Soil moisture temporal patterns and variation A. Longobardi Title Page Abstract Introduction Conclusions References Tables Figures ◭ ◮ ◭ ◮ Back CloseFull Screen / Esc
Printer-friendly Version Interactive Discussion Table 1. Mean regional and observed cumulate precipitation (cum sum) and coefficient of
variation (cv) for the wet, dry and year round period.
cum sum (mm) cv
regional 2004/2005 2005/2006 2006/2007 regional 2004/2005 2005/2006 2006/2007
wet 903 1028 1166 732 0.34 0.58 0.62 0.64
dry 267 209 456 109 0.55 1.19 0.59 1.53
HESSD
5, 935–969, 2008 Soil moisture temporal patterns and variation A. Longobardi Title Page Abstract Introduction Conclusions References Tables Figures ◭ ◮ ◭ ◮ Back CloseFull Screen / Esc
Printer-friendly Version Interactive Discussion Table 2. Precipitation characteristics: number of storm events (n), average storm depth (α),
average time of storm arrival (λ), precipitation variance (var ) during the wet and the dry periods.
year wet dry
n(#) α(mm) λ(days) var (mm) n(#) α(mm) λ(days) var (mm)
2004/2005 43 22.00 4.57 85.39 10 15.36 16.33 35.09
2005/2006 47 22.35 3.83 103.25 24 17.37 6.04 42.67
HESSD
5, 935–969, 2008 Soil moisture temporal patterns and variation A. Longobardi Title Page Abstract Introduction Conclusions References Tables Figures ◭ ◮ ◭ ◮ Back CloseFull Screen / Esc
Printer-friendly Version Interactive Discussion Table 3. Depth averaged soil moisture statistics (% V/V) – year round period.
mean (% V/V) standard deviation (% V/V)
Probe 2004/2005 2005/2006 2006/2007 2004/2005 2005/2006 2006/2007 1 23.50 25.19 26.75 6.16 5.01 6.15 2 27.87 29.25 30.12 4.77 3.55 5.51 3 21.63 22.58 24.42 6.64 5.10 5.63 4 22.57 23.96 26.35 6.95 5.37 6.10 5 26.25 28.18 29.81 7.24 5.68 6.45 6 21.91 23.31 24.54 6.62 4.99 5.88
HESSD
5, 935–969, 2008 Soil moisture temporal patterns and variation A. Longobardi Title Page Abstract Introduction Conclusions References Tables Figures ◭ ◮ ◭ ◮ Back CloseFull Screen / Esc
Printer-friendly Version Interactive Discussion Table 4. Observed soil moisture mean values at different depths (% V/V) – year round period.
Probe 10 cm 30 cm 50 cm 80 cm 2004/2005 2005/2006 2006/2007 2004/2005 2005/2006 2006/2007 2004/2005 2005/2006 2006/2007 2004/2005 2005/2006 2006/2007 1 23.57 23.78 24.52 20.96 23.58 25.64 26.54 28.65 30.30 22.94 24.75 26.53 2 4.61 7.96 11.10 35.14 37.11 37.20 39.97 41.61 41.24 31.77 30.32 30.94 3 18.21 20.07 21.07 21.94 22.26 24.31 31.22 32.58 34.80 15.15 15.43 17.49 4 24.03 25.67 28.32 19.60 21.43 23.28 27.91 29.29 31.42 18.73 19.44 22.39 5 26.68 30.11 32.77 30.59 31.71 32.39 27.19 29.18 30.67 20.56 21.73 23.41 6 22.39 23.56 24.81 26.29 26.45 27.28 28.23 29.86 31.41 10.73 13.38 14.64
HESSD
5, 935–969, 2008 Soil moisture temporal patterns and variation A. Longobardi Title Page Abstract Introduction Conclusions References Tables Figures ◭ ◮ ◭ ◮ Back CloseFull Screen / Esc
Printer-friendly Version Interactive Discussion Table 5. Observed soil moisture mean values at different depths (% V/V) – wet period.
probe 10 cm 30 cm 50 cm 80 cm 2004/2005 2005/2006 2006/2007 2004/2005 2005/2006 2006/2007 2004/2005 2005/2006 2006/2007 2004/2005 2005/2006 2006/2007 1 29.17 27.11 26.80 23.86 26.17 27.39 31.16 32.22 32.41 28.25 27.65 28.30 2 6.32 10.27 12.87 38.92 39.38 39.10 42.01 43.15 42.63 36.97 33.16 32.36 3 24.15 24.41 23.40 26.68 25.44 26.07 36.79 36.83 37.13 18.44 17.23 18.45 4 28.81 28.67 31.59 23.92 24.53 25.54 33.08 32.93 34.13 22.84 22.05 24.13 5 32.27 33.12 36.00 35.48 35.02 35.28 31.61 32.57 33.34 24.52 24.21 25.16 6 27.11 26.53 27.67 31.66 30.18 30.46 33.68 33.98 34.53 11.57 13.96 15.49
HESSD
5, 935–969, 2008 Soil moisture temporal patterns and variation A. Longobardi Title Page Abstract Introduction Conclusions References Tables Figures ◭ ◮ ◭ ◮ Back CloseFull Screen / Esc
Printer-friendly Version Interactive Discussion Table 6. Observed soil moisture values at different depths (% V/V) – dry period.
Probe 10 cm 30 cm 50 cm 80 cm 2004/2005 2005/2006 2006/2007 2004/2005 2005/2006 2006/2007 2004/2005 2005/2006 2006/2007 2004/2005 2005/2006 2006/2007 1 16.93 19.47 15.10 17.54 20.23 18.80 21.07 24.03 22.06 16.65 20.99 19.67 2 2.58 4.98 4.54 30.66 34.18 30.38 37.56 39.62 37.38 25.60 26.66 26.05 3 11.17 14.46 11.22 16.33 18.16 16.85 24.61 27.09 25.55 11.24 13.10 13.72 4 18.18 21.67 18.00 14.31 17.31 15.59 21.57 24.44 21.73 13.71 15.98 15.84 5 19.84 26.09 21.95 24.61 27.31 22.40 21.77 24.67 21.28 15.72 18.44 19.11 6 16.61 19.62 17.81 19.72 21.48 17.40 21.57 24.37 22.58 9.71 12.60 12.36
HESSD
5, 935–969, 2008 Soil moisture temporal patterns and variation A. Longobardi Title Page Abstract Introduction Conclusions References Tables Figures ◭ ◮ ◭ ◮ Back CloseFull Screen / Esc
Printer-friendly Version Interactive Discussion
HESSD
5, 935–969, 2008 Soil moisture temporal patterns and variation A. Longobardi Title Page Abstract Introduction Conclusions References Tables Figures ◭ ◮ ◭ ◮ Back CloseFull Screen / Esc
Printer-friendly Version Interactive Discussion 0 20 40 60 80 100 120 140 160 180 200
Jan Feb Mar Apr May Jun Jul Aug Sep Oct Nov Dec
mm
R PET
HESSD
5, 935–969, 2008 Soil moisture temporal patterns and variation A. Longobardi Title Page Abstract Introduction Conclusions References Tables Figures ◭ ◮ ◭ ◮ Back CloseFull Screen / Esc
Printer-friendly Version Interactive Discussion 2004/2005 -120 -40 40 120 200
oct nov dec gen feb mar apr may jun jul aug sep
d e fi c it s u rp lu s m ont hl y r a inf a ll ( m m ) 2005/2006 -120 -40 40 120 200
oct nov dec gen feb mar apr may jun jul aug sep
d e fi c it s u rp lu s m o nt hl y r a inf a ll ( m m ) 2006/2007 -120 -40 40 120 200
oct nov dec gen feb mar apr may jun jul aug sep
d e fi c it s u rp lu s m ont hl y r a inf a ll ( m m )
HESSD
5, 935–969, 2008 Soil moisture temporal patterns and variation A. Longobardi Title Page Abstract Introduction Conclusions References Tables Figures ◭ ◮ ◭ ◮ Back CloseFull Screen / Esc
Printer-friendly Version Interactive Discussion 100 mm 200 mm 300 mm Oct Apr Nov May Dec Jun Jan Jul Feb Aug Mar Sep 100 mm 200 mm 300 mm Oct Apr Nov May Dec Jun Jan Jul Feb Aug Mar Sep 100 mm 200 mm 300 mm Oct Apr Nov May Dec Jun Jan Jul Feb Aug Mar Sep 2004/2005 2005/2006 2006/2007
HESSD
5, 935–969, 2008 Soil moisture temporal patterns and variation A. Longobardi Title Page Abstract Introduction Conclusions References Tables Figures ◭ ◮ ◭ ◮ Back CloseFull Screen / Esc
Printer-friendly Version Interactive Discussion 0 50 100 150 200 250 1 0 d ay c u m u la te ra in fa ll (m m 0 10 20 30 40 1 0 d ay a v era g e w at er c o n te n t (% V /V rain 10 cm 80 cm 2004/2005 2005/2006 2006/2007
Fig. 5. Temporal variability of 10 day average soil moisture at probe 1: the black line represents the surface soil moisture pattern; the grey line represents the deep soil moisture pattern. Bar chart of 10 day cumulate rainfall is also represented.
HESSD
5, 935–969, 2008 Soil moisture temporal patterns and variation A. Longobardi Title Page Abstract Introduction Conclusions References Tables Figures ◭ ◮ ◭ ◮ Back CloseFull Screen / Esc
Printer-friendly Version Interactive Discussion 0 5 10 15 20 25 30 35 40 45 nov dec jan feb mar apr may jun jul aug sep oct so il w at er c o n te n t ( % V /V 10 cm 30 cm 50 cm 80 cm drying period
wet phase dry phase wetting period
HESSD
5, 935–969, 2008 Soil moisture temporal patterns and variation A. Longobardi Title Page Abstract Introduction Conclusions References Tables Figures ◭ ◮ ◭ ◮ Back CloseFull Screen / Esc
Printer-friendly Version Interactive Discussion 0 0.05 0.1 0.15 0.2 0.25 0.3 0.35 0.4 0.45 nov dec jan feb mar apr may jun jul aug sep oct co ef fi ci en t o f v ar ia ti o 10 cm 30 cm 50 cm 80 cm
HESSD
5, 935–969, 2008 Soil moisture temporal patterns and variation A. Longobardi Title Page Abstract Introduction Conclusions References Tables Figures ◭ ◮ ◭ ◮ Back CloseFull Screen / Esc
Printer-friendly Version Interactive Discussion 0 5 10 15 20 25 30 35 40 45 nov dec jan feb mar apr may jun jul aug sep oct so il w at er c o n te n t ( % V /V probe 1 probe 2 probe 3 probe 4 probe 5 probe 6
HESSD
5, 935–969, 2008 Soil moisture temporal patterns and variation A. Longobardi Title Page Abstract Introduction Conclusions References Tables Figures ◭ ◮ ◭ ◮ Back CloseFull Screen / Esc
Printer-friendly Version Interactive Discussion 5 10 15 20 25 30 35 40
Nov Nov Nov Nov
so il w at er c o n te n t ( % V /V 10 cm 30 cm 50 cm 80 cm 2004 2005 2006 2007
HESSD
5, 935–969, 2008 Soil moisture temporal patterns and variation A. Longobardi Title Page Abstract Introduction Conclusions References Tables Figures ◭ ◮ ◭ ◮ Back CloseFull Screen / Esc
Printer-friendly Version Interactive Discussion (a) (b) annual period 0.00 0.02 0.04 0.06 0.08 0.10 0 10 20 30 40 50
volumetric water content Θ (% V/V)
p ( Θ ) 2004/2005 2005/2006 2006/2007 annual period 0.00 0.05 0.10 0.15 0.20 0.25 0 10 20 30 40 50
volume tric wate r conte nt Θ (% V/V)
p ( Θ ) 2004/2005 2005/2006 2006/2007 wet period 0.00 0.04 0.08 0.12 0.16 0.20 0.24 0.28 0 10 20 30 40 50
volumetric water content Θ (% V/V)
p ( Θ ) 2004/2005 2005/2006 2006/2007 wet period 0.00 0.04 0.08 0.12 0.16 0.20 0 10 20 30 40 50
volumetric water content Θ (% V/V)
p ( Θ ) 2004/2005 2005/2006 2006/2007 dry period 0.00 0.05 0.10 0.15 0.20 0.25 0 10 20 30 40
volumetric water content Θ (% V/V)
p ( Θ ) 2004/2005 2005/2006 2006/2007 dry period 0.00 0.02 0.04 0.06 0.08 0.10 0 10 20 30 40
volumetric water content Θ (% V/V)
p ( Θ ) 2004/2005 2005/2006 2006/2007
Fig. 10. Empirical soil moisture probability distribution function for: (a) near surface layer (10 cm) and (b) deep layer (80 cm).