HAL Id: hal-00852260
https://hal.inria.fr/hal-00852260
Submitted on 22 Aug 2013
HAL is a multi-disciplinary open access archive for the deposit and dissemination of sci-entific research documents, whether they are pub-lished or not. The documents may come from
L’archive ouverte pluridisciplinaire HAL, est destinée au dépôt et à la diffusion de documents scientifiques de niveau recherche, publiés ou non, émanant des établissements d’enseignement et de
Effect of gaseous cement industry effluents on four
species of microalgae
Amélie Talec, Myrvline Philistin, Frédérique Ferey, Günther Walenta,
Jean-Olivier Irisson, Olivier Bernard, Antoine Sciandra
To cite this version:
Amélie Talec, Myrvline Philistin, Frédérique Ferey, Günther Walenta, Jean-Olivier Irisson, et al.. Effect of gaseous cement industry effluents on four species of microalgae. Bioresource Technology, Elsevier, 2013, 143, pp.353 - 359. �10.1016/j.biortech.2013.05.104�. �hal-00852260�
1 2 3 4 5 6 7 8 9 10 11 12 13 14 15 16 17 18 19 20 21 22 23 24 25 26 27 28 29 30 31 32 33 34 35 36 37 38 39 40 41 42 43 44 45 46 47 48 49 50 51 52 53 54 55 56 57 58
Effect of gaseous cement industry effluents on four species of
microalgae
Amélie Talec a, b, Myrvline Philistin a, b, Frédérique Ferey c, Günther Walenta c, Jean-Olivier Irisson a, b, Olivier Bernard d, Antoine Sciandra a, b*
a. CNRS, UMR 7093, LOV, Observatoire Océanologique, F-06234 Villefranche-sur-Mer, France
b. UPMC Université Paris 06, UMR 7093, LOV, Observatoire Océanologique, F-06234 Villefranche-sur-Mer, France
c. Lafarge Centre de Recherche, F-38291 Saint-Quentin Fallavier cedex, France d. INRIA, BIOCORE, F-06902 Sophia Antipolis, France
Abstract: Experiments were performed at lab scale in order to test the possibility to grow microalgae with CO2 from gaseous effluent of cement industry. Four microalgal species (Dunaliella tertiolecta, Chlorella vulgaris, Thalassiosira weissflogii, and
Isochrysis galbana), representing four different phyla were grown with CO2 enriched
air or with a mixture of gases mimicking the composition of a typical Cement Flue Gas (CFG). In a second stage, the culture submitted to the CFG received an increasing concentration of dust characteristic of cement industry. Results show that growth for the four species is not affected by the CFG. Dust was added at realistic concentrations do not have any impact on growth. For dust concentrations in two ranges of magnitude higher, microalgae growth was inhibited.
Keywords: biodiesel, microalgae, CO2 mitigation, industrial CO2, toxicity
*
Corresponding Author. email address: [email protected], tel: +33 493 76 38 19, fax: +33 493 76 38
*Manuscript
1 2 3 4 5 6 7 8 9 10 11 12 13 14 15 16 17 18 19 20 21 22 23 24 25 26 27 28 29 30 31 32 33 34 35 36 37 38 39 40 41 42 43 44 45 46 47 48 49 50 51 52 53 54 55 56 57 1. Introduction
Marine and freshwater photosynthetic microalgae have the ability to assimilate inorganic dissolved carbon into organic matter. These processes represent massive fluxes on earth where one third of the atmospheric CO2 emitted by human activities is absorbed by phytoplankton (Sabine et al., 2004). The idea to reproduce and intensify this natural process to mitigate industrial emissions of CO2 is more and more
considered, with potential biomass valorization through lipid or carbohydrate storage (Abd El Baky et al., 2012). As phytoplankton is diluted in natural biotopes, the
dissolved inorganic carbon generally does not limit primary production, which is mostly controlled by photon and nutrient fluxes. This is not the case for intensive microalgae cultivation devices such as high rate ponds or photobioreactors, where the high biomass concentrations require the supply of large amounts of inorganic carbon, as gaseous CO2 or bicarbonate.
The overall objective of this study is to evaluate the feasibility of using cement-plant flue gas as a source of CO2 for microalgae cultivation. The cement process can be represented as a counter-current flow of matter and gas: the raw materials enter the process at ambient temperature and are continuously heated by the counter-current flow of hot gases produced by the burner at the end of the furnace. The gases then pass through filters before being exhaust at the chimney around 120°C. The dust collected at this stage proceeds from the whole process, and is composed of both un-reacted and partially reacted raw matter, clinker and dust of combustion. It follows that the Cement Flue Gas (CFG) comprises two gaseous and solid components, also known as cement kiln dust. Potentially toxic compounds such as carbon monoxide, nitrogen and sulfur
1 2 3 4 5 6 7 8 9 10 11 12 13 14 15 16 17 18 19 20 21 22 23 24 25 26 27 28 29 30 31 32 33 34 35 36 37 38 39 40 41 42 43 44 45 46 47 48 49 50 51 52 53 54 55 56 57 58
evaluate their effects on algal physiology, and the corresponding tolerance threshold for phytoplankton. Carbon monoxide, at 3 ppm, was proven to be without effect on
microalgae (Doucha et al., 2005). Moderate SOx and NOx contents (a few tens of ppm) can be tolerated by microalgae (Brown, 1996; Lee et al., 2000, 2002). But higher concentrations have been shown to have moderate (Negoro et al., 1993) to strong inhibiting effects (Yanagi et al., 1995) on microalgae production, depending on culture conditions and species. The causes of toxicity are not always easy to highlight, as these molecules can act directly on the organism physiology, or indirectly by altering the properties of their medium. For example, the deleterious effects of SOx (Matsumoto et al., 1997) and NOx (Jin et al., 2005; Lee et al., 2002) can be significantly attenuated if the pH of the media is regulated within physiological acceptable ranges. Besides the gas itself, dust can contain potentially detrimental compounds, such as soot (Matsumoto et al., 1997) or trace metals (Borkenstein et al., 2011).
This study is aiming at evaluating the effects of CFG, including dust, on both the growing potential and biochemical composition of photosynthetic microorganisms. A fully controlled culturing device was used to regulate the gaseous flow rate in the
culture, through pH adjustment (Sciandra et al., 2003). Four phytoplankton species were used for the experiments: Dunaliella tertiolecta, Chlorella vulgaris, Thalassiosira
weissflogii, and Isochrysis galbana, in order to assess the CFG impact on different
1 2 3 4 5 6 7 8 9 10 11 12 13 14 15 16 17 18 19 20 21 22 23 24 25 26 27 28 29 30 31 32 33 34 35 36 37 38 39 40 41 42 43 44 45 46 47 48 49 50 51 52 53 54 55 56 57
2. Material and Methods
2.1 Culture devices
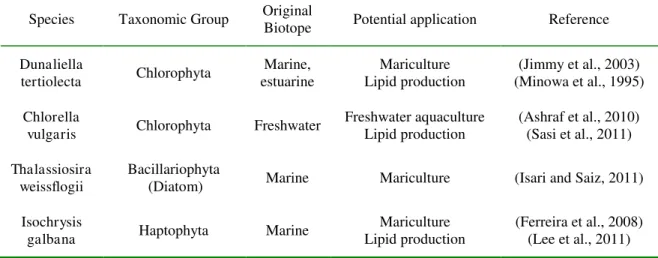
Four autotrophic microalgae were selected (Table 1). The choice was driven first by the desire of using a panel of species belonging to: 1) different phyla, 2) different biotopes (seawater vs. fresh water), 3) different industrial applications, and second, by the
suitability of these species to be to grown properly in photobioreactors within long term experiments. The culture vessels consisted of water-jacketed 2-liter cylinders connected to a circulating water bath that maintain constant temperature of 25±0.1°C. Plexiglas lid, fitted with a toric seal, insured a hermetic closure of bioreactors. Glass tubes, passing through the lid, allow exchanges of fluids and gas, and sampling for analysis. Cultures were subject to continuous gentle stirring and bubbling with sterile-filtered air, which passed through a 0.2-µm Whatman filter and activated charcoal. The entire culture system and its analytical resources are detailed in Sciandra et al. (2000) and Stramski et al. (2002). For marine species, the growth medium was prepared using 0.2-µm Millipore filtered and autoclaved (110°C for 20min) seawater and nutrient
enrichment according to f/2 formulation (Guillard and Ryther, 1962). For freshwater species, the culture medium was prepared from autoclaved (110°C for 20min)
demineralized water, enriched with BG11 broth, trace metals, and vitamins according to Rippka et al. (1979). After cooling and sterile addition of nutrients, the medium was transferred to the culture vessels through a 0.22-µm sterile filter (Sartobran-300, Sartorius Stedim), using a peristaltic pump (Gilson 3). Flow rate was regularly controlled by weighing the inflowing medium. The cultures were grown under
continuous illumination from two clusters of neon tubes, which provide a high output of radiations in the whole visible spectra (Bruyant et al., 2001). Photosynthetically active
1 2 3 4 5 6 7 8 9 10 11 12 13 14 15 16 17 18 19 20 21 22 23 24 25 26 27 28 29 30 31 32 33 34 35 36 37 38 39 40 41 42 43 44 45 46 47 48 49 50 51 52 53 54 55 56 57 58
radiation (PAR) was measured with a quantum scalar irradiance meter (QSL-100, Biospherical Instruments) by immersing the spherical collector in the cultures.
Measurements of PAR before and after additions of dust solution into the cultures (see below) showed that light intensity and presumably light spectrum were not modified by these additions. Inorganic carbon was provided to the cultures by controlled injections of CO2, using a pH-stat approach (Sciandra et al., 2003). When the uptake of Dissolved Inorganic Carbon (DIC) leads the pH to exceed a fixed value, pure CO2 was bubbled into the chemostats to lower the pH, using solenoid valves. The pH was measured at 0.5s intervals using electrodes (Fisherbrand, gelled electrolyte) regularly calibrated. This regulation system enabled to keep a constant pH during the whole experiment. For the marine species, pH was maintained at 8.0±0.02, for which the DIC concentration is not limiting for photosynthesis. For the freshwater species, pH was maintained at 7.5±0.04 as advised for BG-11 growth medium preparation (Rippka et al., 1979).
2.2 Culture and biochemical analyses
The mean diameter, number and total biovolume of microalgae were estimated from their size distribution measured daily with two particle counters (Hiac Royco - Pacific Scientific and Multisizer III - Beckman). All biochemical analyses were made in triplicates. For each replicate, 5 ml of culture were filtered onto glass fiber filters (Whatman GF/C, porosity 1.2µm) previously burned 4 hours at 450°C. All samples were then stored at -20°C until analyses, except the filtered samples for elemental C and N analyses that were dried at 60°C. Particulate organic carbon (POC) and nitrogen (PON) were analyzed with a Perkin-Elmer CHN analyzer. Chlorophyll, extracted with a mix of 90% acetone / dimethyl sulfoxide in the proportion 3:2 (v/v) (Shoaf and Lium,
1 2 3 4 5 6 7 8 9 10 11 12 13 14 15 16 17 18 19 20 21 22 23 24 25 26 27 28 29 30 31 32 33 34 35 36 37 38 39 40 41 42 43 44 45 46 47 48 49 50 51 52 53 54 55 56 57
1976) was measured with a Turner 10-AU fluorimeter (exc. 436nm; em. 680nm), following Welschmeyer (1994). Proteins were extracted and solubilized by filter sonication in a detergent buffer. The bulk proteins were measured from the absorbance measured at 750 nm with a spectrophotometer (Perkin-Elmer UV/VIS Lambda2), after a colorimetric reaction derived from Lowry et al. (1951), using the “Bio-Rad” detection kit (DC Protein Assay Kit II, ref 500-0112-MSDS). As the algae proteins do not give exactly the same signal intensity as the standard (protein BSA bovine serum albumin), data are given in BSA equivalents. Carbohydrates were measured using the colorimetric method from Sun et al. (1984). After a treatment with phenol and sulfuric acid, samples were heated at 100°C, and absorbance measured between 480nm and 490nm (Perkin-Elmer UV/VIS Lambda2).
2.3 Experimental design
To compare the respective effects of gas and dust on the species Dunaliella tertiolecta,
Chlorella vulgaris, Thalassiosira weissflogii, and Isochrysis galbana, four separate
experiments with two parallel cultures were carried out. For each experiment, the
control culture (C1) was submitted to standard, optimal growing conditions, whereas the test culture (C2) was subsequently submitted to three treatments: 1) the same conditions as in the control culture C1, 2) bubbled with CFG, and 3) provided with cement industry dust.
The growth rate µ (d-1) for a variable x in a culture renewed with the dilution rate D (d -1
) can be estimated from measurements x1 and x2 made at times t1 and t2 respectively:
1 2 1 2 ln t t x x + D = 1 2 3 4 5 6 7 8 9 10 11 12 13 14 15 16 17 18 19 20 21 22 23 24 25 26 27 28 29 30 31 32 33 34 35 36 37 38 39 40 41 42 43 44 45 46 47 48 49 50 51 52 53 54 55 56 57 58
The cultures were systematically inoculated at low cell concentration within batch mode (no culture renewal) to verify that the maximum division rates were in agreement with the values of the literature. It thus validated the optimality of the culture setups for each species (culturing system, axenicity, medium, temperature and light conditions). Once the algal culture reached a sufficient level of biomass, the dilution was started with a rate equal to the maximum previously measured growth rate. Using this turbidostat mode, cultures were continuously renewed with fresh medium and maintained at steady state within non-limited growth conditions. During this stabilization phase, the dilution rate could be slightly adjusted to compensate any variations of the culture level.
Gas test
Once the cultures were stabilized, the pure CO2 injected into the C2 culture was
replaced by a mixture composed with the major gases found in the emissions of a plant chosen for this study and stored in the same gas cylinder: N2 (732 943 ppm), CO2 (167 772 ppm), NO (677 ppm), CO (568 ppm) and SO2 (41 ppm). Oxygen (98 000 ppm) was brought independently. C1 and C2 cultures were sampled for biochemical analyses at the end of the stabilization phase, and after the gas treatment.
Dust test
The concentration of dust in the gas flowing out of the factory’s chimney is 30 mg/Nm3 . Considering the parameters of a classical production pond (1kg/m3 of biomass, uptake of 1.8kg of CO2 per kg of biomass, half of the bubbled CO2 being lost), assuming no dust storage within the pond (i.e. the same dilution rate than for the liquid phase), the
final concentration of dust at equilibrium in the pond is 0.33mg/L.
The first experiment with the dust was carried out on the species Dunaliella tertiolecta.
1 2 3 4 5 6 7 8 9 10 11 12 13 14 15 16 17 18 19 20 21 22 23 24 25 26 27 28 29 30 31 32 33 34 35 36 37 38 39 40 41 42 43 44 45 46 47 48 49 50 51 52 53 54 55 56 57
series of two media previously incubated with increasing concentrations of dust, and filtered. The two concentrations chosen for the tests were 20 and 40 times the estimated real concentration, more precisely 6.8mg/L and 13.6mg/L.
The second experiment was performed with much higher concentrations of dust. Dust addition was carried out in the cultures where CFG was tested, after a period where only the artificial gas without dust was bubbled. After a first period with only gas injection, 100 mL of medium previously incubated with dust (11 g/L) and filtered, were added. It results in a final concentration of 680mg/L, two thousand times higher than the
expected concentration in a real installation. This operation was repeated for 5 days. During this phase, the control culture C1 received the same volume of growth medium. C1 and C2 cultures were sampled for biochemical analyses at the end of the dust treatment.
Dust analysis
The X-Ray Diffraction analysis revealed the presence of four unreacted raw materials in the dust: Calcite CaCO3, Quartz SiO2, Kaolinite Al2Si2O5(OH)4 and Muscovite
(K0.82Na0.18)(Fe0.03Al1.97)(AlSi3)O10(OH)2. Four media, prepared without dust and with increasing dust incubations (6.8mg/L, 68mg/L and 680mg/L), were analyzed by atomic emission spectrometry ICP – AES (Varian 720-ES). 5% of hydrochloric acid was added in the liquid sample before the measurement. The quantitative analyses were obtained from a standard curve. Standards were measured every 10 samples to control the
stability of the instrument. To validate the data, the error measured for the standards run must stay below 5% of relative error compared to theoretical values. Table 2 shows that among the detected elements, some increased with the dust concentration (SiO2 and
1 2 3 4 5 6 7 8 9 10 11 12 13 14 15 16 17 18 19 20 21 22 23 24 25 26 27 28 29 30 31 32 33 34 35 36 37 38 39 40 41 42 43 44 45 46 47 48 49 50 51 52 53 54 55 56 57 58
Al2O3), whereas others appeared with the dust addition but remained constant (Cu, Mn, Mo and Se).
2.4 Statistical analysisof biochemical data set
Cell contents of nitrogen, chlorophyll a, proteins and carbohydrates were normalized by
cell carbon to make the comparison between treatments independent from culture biomass. It follows that the result interpretation involves statistical analyses of ratios. Because the different compounds were measured on independent triplicate samples, it is not possible to calculate one single ratio by averaging the ratios of the three replicate. Instead, by considering that measurement errors were normally distributed, the mean and standard deviation of each compound concentration were computed, and the parameters of the probability density distribution of the ratio of two normal random variables were estimated (Hinkley, 1969). Assuming additionally that the normal distribution of each compound concentration has a nearly vanishing density at zero, the density of the ratio is:
2 2 2
2 2 / 3 2 2 2 2 2 2 exp 2 + x x x + x + = x C N C N C N N C C N r where N2 and N are the variance and mean of the numerator, respectively, and C2 and C the variance and mean of the denominator (carbon here, hence the C index). The mean and variance of the ratios were estimated by computing the usual integrals of a probability density function.
Whereas the ratios measured during each of the 3 phases of the experiments
(stabilization, gas and dust treatments) could not be compared directly, the difference of ratios between the control culture C1 and test culture C2 could be. Monte Carlo
1 2 3 4 5 6 7 8 9 10 11 12 13 14 15 16 17 18 19 20 21 22 23 24 25 26 27 28 29 30 31 32 33 34 35 36 37 38 39 40 41 42 43 44 45 46 47 48 49 50 51 52 53 54 55 56 57
simulations of the error concentration measurements shows that the differences of the ratios were normally distributed and could be therefore compared with a t-test, using Welch's approximation for the degrees of freedom to account for possibly unequal variances. The mean, variance, and sample size of each difference were computed from the mean, variance, and sample sizes of the ratios with E
XY
= E X E Y ,
X Y
= 2
X + 2Y2
, nXY= nX+nY2 (Zar, 1999). All computations were done with the R software (R Development Core Team, 2011).
3. Results and discussion
3.1 Effect of CFG on growth rate and biochemical composition of microalgae
The experiments showed that the CFG had noticeable effects neither on the growth rate, nor on the biochemical composition of the four algal species tested in this study. One example is given here, for the diatom Thalassiosira weissflogii (similar observations
were made for the three other species). Figure 1A displays that algal biomass increased rapidly in both the control (C1) and test (C2) cultures, insuring that suitable growing conditions were met for this species. On day 4, cell density expectedly started to decrease as the dilution was switched on, but the growth rate remained unchanged (turbidostat mode). After 1 week of CFG bubbling, the biomass levels were close in the C1 and C2 cultures. Note that during the CFG treatment, the rate of variation of
Thalassiosira weissflogii was even slightly greater in C2 than in C1. Figure 2 also
shows that using CFG did not generate noticeable changes in the biochemical composition of T. Weissflogii: nitrogen, protein or carbohydrate contents in the test
1 2 3 4 5 6 7 8 9 10 11 12 13 14 15 16 17 18 19 20 21 22 23 24 25 26 27 28 29 30 31 32 33 34 35 36 37 38 39 40 41 42 43 44 45 46 47 48 49 50 51 52 53 54 55 56 57 58
D), and the differences observed during the stabilization phase for the chlorophyll a
content (Fig. 2B) are not modified after the gas test phase. Table 3 illustrates that the same conclusion applies to the other tested species. This comparison of the two cultures after the stabilization phase and after the CFG treatment, for the four species,
demonstrates that the gas does not have any significant impact (Table 3).
3.2 Effect of cement dust on growth rate and biochemical composition of microalgae
The first experiment with the dust was carried out with concentrations 20 times and 40 times higher than the nominal dust concentration in a standard installation. Figure 1B shows that those concentrations (6.8mg/L and 13.6mg/L) had no harmful effect on growth rate. Indeed, no modification of the growth rate was noticed for Dunaliella
tertiolecta: it was measured at 0.50 ± 0.06 d-1 during the stabilization phase, at 0.47 ±
0.02 d-1 when grown with 6.8mg/L of dust and 0.49 ± 0.06 d-1 with 13.6mg/L of dust. Since there was no noticeable response to dust addition, a dust shock was applied in a second experiment. The dust concentration was set to two thousand times the one
expected in a CFG treating pond. As shown by the arrow II in Figure 1A, the addition of concentrated dust extracts induced an immediate decrease of the biomass in the culture. And this has been observed for the four cultivated microalgae: the growth rate
decreased the day after the first injection, except for Isochrysis galbana, for which it
took 3 days before any effect appeared. Nevertheless, this species showed the strongest reaction to the dust: its growth rate became even negative, reaching -1.2d-1, indicating that the algae not only stopped dividing but were also dying. It is worth noting that this toxic effect was observed with dust concentrations 2000 times higher (i.e. 680mg/L) than the expected concentration in a real installation.
1 2 3 4 5 6 7 8 9 10 11 12 13 14 15 16 17 18 19 20 21 22 23 24 25 26 27 28 29 30 31 32 33 34 35 36 37 38 39 40 41 42 43 44 45 46 47 48 49 50 51 52 53 54 55 56 57
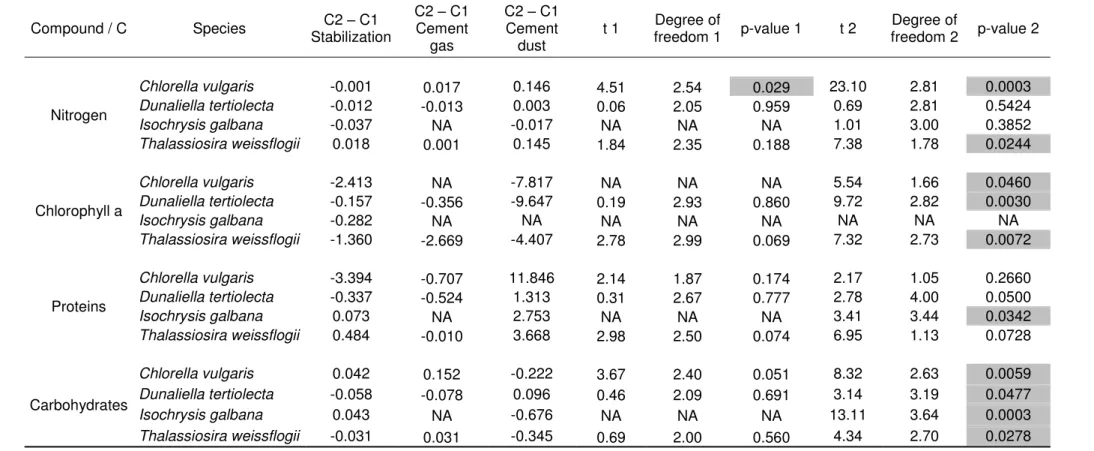
The same biochemical analyses than for the CFG treatment were carried out on the cultures contaminated with 680 mg/L of dust. Table 3 shows that the introduction of concentrated dust extracts in C2 caused a significant difference on the set of measured ratios. Figure 3 details these effects for Thalassiosira weissflogii: the N/C ratio and the
protein content both increased (Fig. 3A, C) whereas the chlorophyll as well as the carbohydrates decreased (fig 3B, D).
Table 3 shows the same variations for almost all the analyzed compounds of the four species. The N/C changes were consistent with the proteins/C changes, as this result supports the fact that a large part of the cellular N is devoted to protein synthesis. The raise in nitrogen and protein content observed after the dust shock reveals that the cellular machinery drives even more of the nitrogen pool toward protein synthesis, including probably repairing or detoxification proteins, to the detriment of pigments synthesis as shown by the decrease of the chlorophyll cell content. Similarly,
chlorophyll and carbohydrates ratios show parallel reductions in the culture after the injection of the dust extracts. At constant temperature and constant light, the chlorophyll cell content is the main regulator of the photosynthetic activity. This study shows that this regulation has a double impact on carbohydrates, as the primary product of the photosynthesis but also as an energy source supply. Thus, in case of deficient
photosynthesis, the carbohydrates are produced with a poorer yield and rapidly breathed
and degraded to compensate for the insufficient energetic provision of the cellular metabolic machinery. It has to be noted that the decrease of the pigment synthesis was visible during the terminal phase of the dust-treated cultures, because the microalgae bleached.
1 2 3 4 5 6 7 8 9 10 11 12 13 14 15 16 17 18 19 20 21 22 23 24 25 26 27 28 29 30 31 32 33 34 35 36 37 38 39 40 41 42 43 44 45 46 47 48 49 50 51 52 53 54 55 56 57 58 3.3 Dust analysis
As shown in Figure 1B, realistic dust concentrations in the medium have no impact on the cell growth. But when the dust concentration rises, some toxic effect appears and can even be lethal (Figure 1A), which means that the cement dust probably contains at least one compound which becomes inhibiting for growth.
Table 2 shows that among the compounds detected in the culture medium, the
concentration of six of them increased with the introduction of dust in the water. As the toxic effect is only seen with high dust content, inhibition is probably due to some elements, which concentration increase with the dust concentration. Both compounds Al2O3 and SiO2, have been reported to inhibit growth: aluminum oxide has shown a lethal effect on nematodes (Wang et al., 2009) and on bacteria (Jiang et al., 2009), and silicon dioxide has shown toxicity towards bacteria and Daphnia ( Jiang et al., 2009). In
this study, Al2O3, SiO2, and/or possibly an undetected compound are responsible, if highly concentrated, of a metabolic disturbance of all the tested species of microalgae. This metabolic disturbance, shown by a modified intracellular N/C ratio, leads to a growth stop that may be related to the strong decrease of Chl a. This may indicate a
drastic reduction of the photosynthetic activity in the cultures. It is likely that this blocking of synthesis is not limited to the photosynthetic apparatus but also concerns a large part of the cellular material. Thus, the loss of pigmentation seen on the algae is probably one of the physiologic consequences of the poisoning with the dust extract, among many others, altogether driving to the cell division stop.
1 2 3 4 5 6 7 8 9 10 11 12 13 14 15 16 17 18 19 20 21 22 23 24 25 26 27 28 29 30 31 32 33 34 35 36 37 38 39 40 41 42 43 44 45 46 47 48 49 50 51 52 53 54 55 56 57
3.3 Potential temperature effect of CFG from a real plant
Finally, only the chemical impact of CFG was tested through the effect of the considered compounds in the gas or in the dust. However, using industrial CFG will also lead to the injection of a hot gas in the microalgal culture medium. As a
consequence, an increase of temperature will be expected in the bioreactor. As shown in Bernard and Rémond, (2012), such temperature raise can benefit to the microalgae during cold period, where temperature can reduce growth, but it may have deleterious effects during the warm seasons, where inhibitory or even lethal temperatures could be reached. Adaptation mechanisms in industrial plants fed with hot CFG may however lead to the selection and development of strains which are tolerant to higher
temperatures (Ras et al. 2013).
4. Conclusions
This study shows that both the outflow gas and the dust produced by a cement plant are tolerated by four species of microalgae, even though the dust can release compounds inhibiting the microalgae production at concentrations much higher than the ones that should be reached in a real case.
However, these results have to be validated by experiments carried out with the real CFG including dust emitted by a cement industry plant. Such a study would also highlight a possible effect due to a temporal variability of the gas composition or of its dust content.
1 2 3 4 5 6 7 8 9 10 11 12 13 14 15 16 17 18 19 20 21 22 23 24 25 26 27 28 29 30 31 32 33 34 35 36 37 38 39 40 41 42 43 44 45 46 47 48 49 50 51 52 53 54 55 56 57 58 Acknowledgments
We thank Bruno Sialve for his technical help in growing the Chlorella vulgaris species
and for constructive discussions.
References
1. Abd El Baky, H.H., El-Baroty, G.S., Bouaid, A., Martinez, M., Aracil, J., 2012. Enhancement of lipid accumulation in Scenedesmus obliquus by optimizing CO2
and Fe3+ levels for biodiesel production. Bioresour. Technol. 119, 429–432. 2. Ashraf, M., Ullah, S., Rashid, T., Ayub, M., Bhatti, E.M., Naqvi, S.A., Javaid, M.,
2010. Optimization of indoor production of fresh water rotifer (Brachionus
calyciflorus): A Preliminary Study. Int. J. Agric. Biol. 12, 719–723.
3. Bernard, O., Rémond, B., 2012. Validation of a simple model accounting for light and temperature effect on microalgal growth. Bioresour. Technol. 123, 520–527. 4. Borkenstein, C.G., Knoblechner, J., Fruehwirth, H., Schagerl, M., 2011. Cultivation
of Chlorella emersonii with flue gas derived from a cement plant. J. Appl. Phycol.
23, 131–135.
5. Brown, L.M., 1996. Uptake of carbon dioxide from flue gas by microalgae. Energy Convers. Manage. 37, 1363–1367.
6. Bruyant, F., Babin, M., Sciandra, A., Marie, D., Genty, B., Claustre, H., Blanchot, J., Bricaud, A., Rippka, R., Boulben, S., Louis, F., Partensky, F., 2001. An axenic cyclostat of Prochlorococcus PCC 9511 with a simulator of natural light regimes. J.
1 2 3 4 5 6 7 8 9 10 11 12 13 14 15 16 17 18 19 20 21 22 23 24 25 26 27 28 29 30 31 32 33 34 35 36 37 38 39 40 41 42 43 44 45 46 47 48 49 50 51 52 53 54 55 56 57
7. Doucha, J., Straka, F., Livansky, K., 2005. Utilization of flue gas for cultivation of microalgae (Chlorella sp.) in an outdoor open thin-layer photobioreactor. J. Appl.
Phycol. 17, 403–412.
8. Ferreira, M., Fabregas, M.J., Otero, A., 2008. Enriching rotifers with “premium” microalgae. Isochrysis affinis galbana clone T-ISO. Aquaculture 279, 126–130. 9. Guillard, R., Ryther, J., 1962. Studies of marine planktonic diatoms.1. Cyclotella
nana Hustedt, and Detonula confervacea (Cleve) Gran. Can. J. Microbiol. 8, 229– 239.
10. Hinkley, D., 1969. On ratio of two correlated normal random variables. Biometrika 56, 635–639.
11. Isari, S., Saiz, E., 2011. Feeding performance of the copepod Clausocalanus lividus
(Frost and Fleminger, 1968). J. Plankton Res. 33, 715–728.
12. Jiang, W., Mashayekhi, H., Xing, B., 2009. Bacterial toxicity comparison between nano- and micro-scaled oxide particles. Environ. Pollut. 157, 1619–1625.
13. Jimmy, R.A., Kelly, M.S., Beaumont, A.R., 2003. The effect of diet type and quantity on the development of common sea urchin larvae Echinus esculentus.
Aquaculture 220, 261–275.
14. Jin, Y.M., Veiga, M.C., Kennes, C., 2005. Bioprocesses for the removal of nitrogen oxides from polluted air. J. Chem. Technol. Biotechnol. 80, 483–494.
15. Lee, J.H., Lee, J.S., Shin, C.S., Park, S.C., Kim, S.W., 2000. Effects of NO and SO2 on growth of highly-CO2,-tolerant microalgae. J. Microbiol. Biotechnol. 10, 338– 343.
1 2 3 4 5 6 7 8 9 10 11 12 13 14 15 16 17 18 19 20 21 22 23 24 25 26 27 28 29 30 31 32 33 34 35 36 37 38 39 40 41 42 43 44 45 46 47 48 49 50 51 52 53 54 55 56 57 58
16. Lee, J.S., Kim, D.K., Lee, J.P., Park, S.C., Koh, J.H., Cho, H.S., Kim, S.W., 2002. Effects of SO2 and NO on growth of Chlorella sp KR-1. Bioresour. Technol. 82, 1– 4.
17. Lee, S.-J., Go, S., Jeong, G.-T., Kim, S.-K., 2011. Oil production from five marine microalgae for the production of biodiesel. Biotechnol. Bioprocess Eng. 16, 561– 566.
18. Lowry, O., Rosebrough, N., Farr, A., Randall, R., 1951. Protein measurement with the Folin Phenol reagent. J. Biol. Chem. 193, 265–275.
19. Matsumoto, H., Hamasaki, A., Sioji, N., Ikuta, Y., 1997. Influence of CO2, SO2 and NO in flue gas on microalgae productivity. J. Chem. Eng. Jpn. 30, 620–624.
20. Minowa, T., Yokoyama, S., Kishimoto, M., Okakura, T., 1995. Oil production from algal cells of Dunaliella tertiolecta by direct thermochemical liquefaction. Fuel 74,
1735–1738.
21. Negoro, M., Hamasaki, A., Ikuta, Y., Makita, T., Hirayama, K., Suzuki, S., 1993. Carbon-dioxide fixation by microalgae photosynthesis using actual flue-gas discharged from a boiler. Appl. Biochem. Biotechnol. 39, 643–653.
22. Ras, M., Steyer, J. P., Bernard, O., 2013. Temperature effect on microalgae: a crucial factor for outdoor production. Reviews in Environmental Science and Bio/Technology. 12, 153-164.
23. R Development Core Team, 2011. R: A Language and Environment for Statistical Computing. Vienna, Austria.
24. Rippka, R., Deruelles, J., Waterbury, J., Herdman, M., Stanier, R., 1979. Generic assignments, strain histories and properties of pure cultures of cyanobacteria. J. Gen. Microbiol. 111, 1–61.
1 2 3 4 5 6 7 8 9 10 11 12 13 14 15 16 17 18 19 20 21 22 23 24 25 26 27 28 29 30 31 32 33 34 35 36 37 38 39 40 41 42 43 44 45 46 47 48 49 50 51 52 53 54 55 56 57
25. Sabine, C.L., Feely, R.A., Gruber, N., Key, R.M., Lee, K., Bullister, J.L.,
Wanninkhof, R., Wong, C.S., Wallace, D.W.R., Tilbrook, B., Millero, F.J., Peng, T.-H., Kozyr, A., Ono, T., Rios, A.F., 2004. The Oceanic Sink for Anthropogenic CO2. Science 305, 367–371.
26. Sasi, D., Mitra, P., Vigueras, A., Hill, G.A., 2011. Growth kinetics and lipid production using Chlorella vulgaris in a circulating loop photobioreactor. J. Chem.
Technol. Biotechnol. 86, 875–880.
27. Sciandra, A., Harlay, J., Lefevre, D., Lemee, R., Rimmelin, P., Denis, M., Gattuso, J.P., 2003. Response of coccolithophorid Emiliania huxleyi to elevated partial
pressure of CO2 under nitrogen limitation. Mar. Ecol. Prog. Ser. 261, 111–122. 28. Sciandra, A., Lazzara, L., Claustre, H., Babin, M., 2000. Responses of growth rate,
pigment composition and optical properties of Cryptomonas sp to light and nitrogen
stresses. Mar. Ecol. Prog. Ser. 201, 107–120.
29. Shoaf, W., Lium, B., 1976. Improved extraction of a and Chlorophyll-b from algae using dimethyl-sulfoxide. Limnol. Oceanogr. 21, 926–928.
30. Stramski, D., Sciandra, A., Claustre, H., 2002. Effects of temperature, nitrogen, and light limitation on the optical properties of the marine diatom Thalassiosira
pseudonana. Limnol. Oceanogr. 47, 392–403.
31. Sun, M., Qian, Z., Hu, W. 1984. On the method for determining total dissolved carbohydrates in sea water, temperature effect of phenol sulfuric acid. Coll. Ocean. Works. 7, 84.
32. Wang, H., Wick, R.L., Xing, B., 2009. Toxicity of nanoparticulate and bulk ZnO, Al2O3 and TiO2 to the nematode Caenorhabditis elegans. Environ. Pollut. 157, 1171–1177.
1 2 3 4 5 6 7 8 9 10 11 12 13 14 15 16 17 18 19 20 21 22 23 24 25 26 27 28 29 30 31 32 33 34 35 36 37 38 39 40 41 42 43 44 45 46 47 48 49 50 51 52 53 54 55 56 57 58
33. Welschmeyer, N., 1994. Fluorometric analysis of chlorophyll-a in the presence of chlorophyll-b and pheopigments. Limnol. Oceanogr. 39, 1985–1992.
34. Yanagi, M., Watanabe, Y., Saiki, H., 1995. CO2 fixation by Chlorella sp HA-1 and
its utilization. Energy Convers. Manage. 36, 713–716.
35. Zar, J.H., 1999. Biostatistical analysis, 4th ed. ed. Prentice Hall, Upper Saddle River N.J.
TABLES
Species Taxonomic Group Original
Biotope Potential application Reference Dunaliella tertiolecta Chlorophyta Marine, estuarine Mariculture Lipid production (Jimmy et al., 2003) (Minowa et al., 1995) Chlorella
vulgaris Chlorophyta Freshwater
Freshwater aquaculture Lipid production (Ashraf et al., 2010) (Sasi et al., 2011) Thalassiosira weissflogii Bacillariophyta
(Diatom) Marine Mariculture (Isari and Saiz, 2011) Isochrysis
galbana Haptophyta Marine
Mariculture Lipid production
(Ferreira et al., 2008) (Lee et al., 2011)
Table 1: Autotrophic phytoplankton species tested.
Sample medium 20x dust 200x dust 2000x dust As (mg/L) 0.01 0.01 0.01 0.01 CaO (mg/L) 658 645 644 634 Cd (mg/L) < 0.005 < 0.005 < 0.005 0.01 Co (mg/L) < 0.005 < 0.005 < 0.005 0.01 Cr (mg/L) < 0.005 < 0.005 < 0.005 < 0.005 Cu (mg/L) < 0.005 0.01 0.01 0.01 Hg (mg/L) 0.01 0.01 < 0.01 0.01 K2O (mg/L) 580 569 567 559 MgO (mg/L) 2 430 2 250 2 340 2 290 Na2O (mg/L) 15 900 15 400 15 900 15 600 Ni (mg/L) < 0.005 < 0.005 < 0.005 < 0.005 P (mg/L) 1.23 1.23 1.06 1.04 Pb (mg/L) 0.01 0.01 0.02 0.01 Sb (mg/L) < 0.02 < 0.02 < 0.02 < 0.02 SO3 (mg/L) 2540 2510 2500 2460 Te (mg/L) 0.01 < 0.005 < 0.005 < 0.005 Ti (mg/L) < 0.005 < 0.005 < 0.005 < 0.005 V (mg/L) < 0.005 < 0.005 < 0.005 < 0.005 Zn (mg/L) 0.01 0.02 0.01 0.01 Fe2O3 (mg/L) 0.13 0.13 0.13 0.14 Mn (mg/L) 0.03 0.06 0.06 0.06 Mo (mg/L) 0.01 0.02 0.02 0.02 Se (mg/L) 0.02 0.05 0.05 0.04 Al2O3 (mg/L) < 0.04 < 0.04 0.2 1.1 SiO2 (mg/L) < 0.04 < 0.04 0.17 0.85
Table 2: Elements and their concentrations (mg/L) measured in culture medium incubated with no dust and with 20x, 200x and 2000x (6.8mg/L, 68mg/L and 680mg/L) the expected dust content of the cement exhausts. Some concentrations increased with the addition of dust, regardless of the dust amount (light grey) or proportional to it (dark grey).
Compound / C Species C2 – C1 Stabilization C2 – C1 Cement gas C2 – C1 Cement dust t 1 Degree of freedom 1 p-value 1 t 2 Degree of freedom 2 p-value 2 Nitrogen Chlorella vulgaris -0.001 0.017 0.146 4.51 2.54 0.029 23.10 2.81 0.0003 Dunaliella tertiolecta -0.012 -0.013 0.003 0.06 2.05 0.959 0.69 2.81 0.5424 Isochrysis galbana -0.037 NA -0.017 NA NA NA 1.01 3.00 0.3852 Thalassiosira weissflogii 0.018 0.001 0.145 1.84 2.35 0.188 7.38 1.78 0.0244 Chlorophyll a Chlorella vulgaris -2.413 NA -7.817 NA NA NA 5.54 1.66 0.0460 Dunaliella tertiolecta -0.157 -0.356 -9.647 0.19 2.93 0.860 9.72 2.82 0.0030 Isochrysis galbana -0.282 NA NA NA NA NA NA NA NA Thalassiosira weissflogii -1.360 -2.669 -4.407 2.78 2.99 0.069 7.32 2.73 0.0072 Proteins Chlorella vulgaris -3.394 -0.707 11.846 2.14 1.87 0.174 2.17 1.05 0.2660 Dunaliella tertiolecta -0.337 -0.524 1.313 0.31 2.67 0.777 2.78 4.00 0.0500 Isochrysis galbana 0.073 NA 2.753 NA NA NA 3.41 3.44 0.0342 Thalassiosira weissflogii 0.484 -0.010 3.668 2.98 2.50 0.074 6.95 1.13 0.0728 Carbohydrates Chlorella vulgaris 0.042 0.152 -0.222 3.67 2.40 0.051 8.32 2.63 0.0059 Dunaliella tertiolecta -0.058 -0.078 0.096 0.46 2.09 0.691 3.14 3.19 0.0477 Isochrysis galbana 0.043 NA -0.676 NA NA NA 13.11 3.64 0.0003 Thalassiosira weissflogii -0.031 0.031 -0.345 0.69 2.00 0.560 4.34 2.70 0.0278
Table 3: Differences between the control and the test cultures for intracellular compounds normalized by carbon. Computations were made during the stabilization phase, after bubbling the CFG and after the addition of the cement-dust. The t-test, using Welch’s approximation for the degrees of freedom, checks for a significant difference between two states: 1. between stabilization and gas test; 2. between
Figure captions
Figure 1: Evolution of two species treated with CFG and dust, in turbidostat
photobioreactors. A. Biovolume and dilution rate for Thalassiosira weissflogii. Arrows
indicate for the test culture C2 (I) when the pure CO2 was replaced by CFG, and (II) when dust was added. Note that at day 5, the dilution was progressively increased in the two photobioreactors to reduce the levels of biomasses, and the risk of insufficient illumination due to self-shading. B. Growth rate of Dunaliella tertiolecta. The arrows
indicate when the renewal medium was changed for a medium contaminated with an increasing dust concentration: 6.8mg/L and 13.6mg/L.
Figure 2: Comparison of the biochemical composition of Thalassiosira weissflogii
grown in control culture C1 (pure CO2) and test culture C2 (cement gas). A: nitrogen; B: chlorophyll a; C: protein; D: carbohydrate. Cell compounds are normalized by cell carbon.
Figure 3: Comparison of the biochemical composition of Thalassiosira weissflogii
grown in turbidostat where C1 (in black) is the control culture and C2 (in grey) the test culture. The test culture was submitted to the dust impact (680mg/L). A: nitrogen; B: chlorophyll a; C: proteins; D: carbohydrates. Cell compounds are normalized by cell carbon.