1
Supplementary Information
S-layer protein-AuNP systems for the colorimetric detection of metal and
metalloid ions in water
J. Jung
$*
a, M. Lakatos
$b, S. Bengs
c, S. Matys
d, J. Raff
e, A. Blüher*
fand G. Cuniberti
aa. Institute for Materials Science and Max Bergmann Center of Biomaterials, TU Dresden, 01062 Dresden, Germany . E-mail: [email protected], Phone:
+49 (0)351 463-31413, Fax: +49 (0)351 463-31422.
b. Photonic Nanosystems, Department of Physics, University Fribourg , 1700 Fribourg, Switzerland . c. Department of Nuclear Medicine, Cardiovascular Gender Medicine, University Hospital Z urich, Switzerland. d. Helmholtz-Institute Freiberg for Resource Technology, Chemnitzer Str. 40, 09599 Freiberg, Germany .
e. Helmholtz-Zentrum Dresden Rossendorf, Institute of Resource Ecology, Bautzner Landstraße 400, 01328 Dresden, Germany.
f. School of Engineering Science, TU Dresden, 01062 Dresden, Germany. E-mail: [email protected], Phone: +49 (0)351 463 32101. $.equally contributed
Characterization of S-layer functionalized AuNP
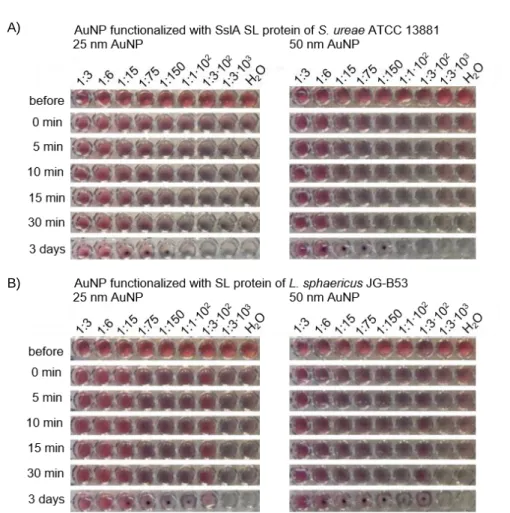
Figure SI1 Results on the ionic stability of S-layer functionalized AuNP for two S-layer proteins and two different AuNP sizes
incubated with 10 % NaCl. A) AuNPs (25 or 50 nm) functionalized with a 1:6 dilution of a 1 mg/ml SslA solution are stable and show no color change after the addition of NaCl. B) 25 nm AuNPs functionalized with a 1:6 dilution of a 1 mg/ml S-layer protein solution from L. sphaericus JG-B53 solution are stable. 50 nm AuNPs functionalized with a 1:3 dilution of a 1 mg/ml S-layer protein solution from L. sphaericus JG-B53 solution are stable. The respective tested AuNPs remain stable in the tested time frame.
A)
2
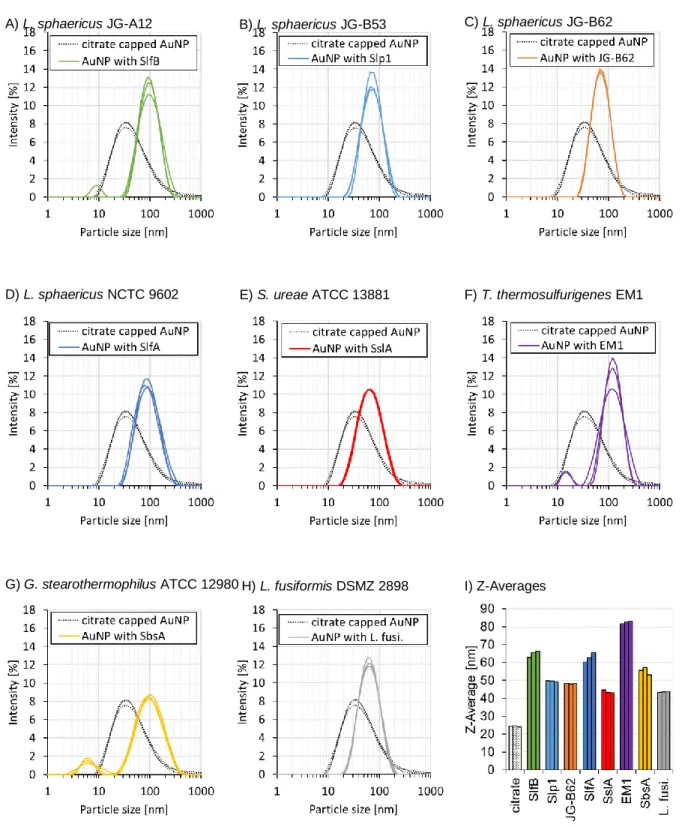
Figure SI2 DLS data of citrate capped AuNP and AuNP functionalized with S-layer protein from A) L. sphaericus JG-A12,
B) L. sphaericus JG-B53, C) L. sphaericus JG-B62, D) L. sphaericus NCTC 9602, E) S. ureae ATCC 13881, F) T. Thermosulfurigenes EM1, G) G. stearothermophilus ATCC 12980, H) L. fusiformis DSMZ 2898, and the I) Z-Averages of all the samples.
A) L. sphaericus JG-A12 B) L. sphaericus JG-B53 C) L. sphaericus JG-B62
D) L. sphaericus NCTC 9602 E) S. ureae ATCC 13881 F) T. thermosulfurigenes EM1
3
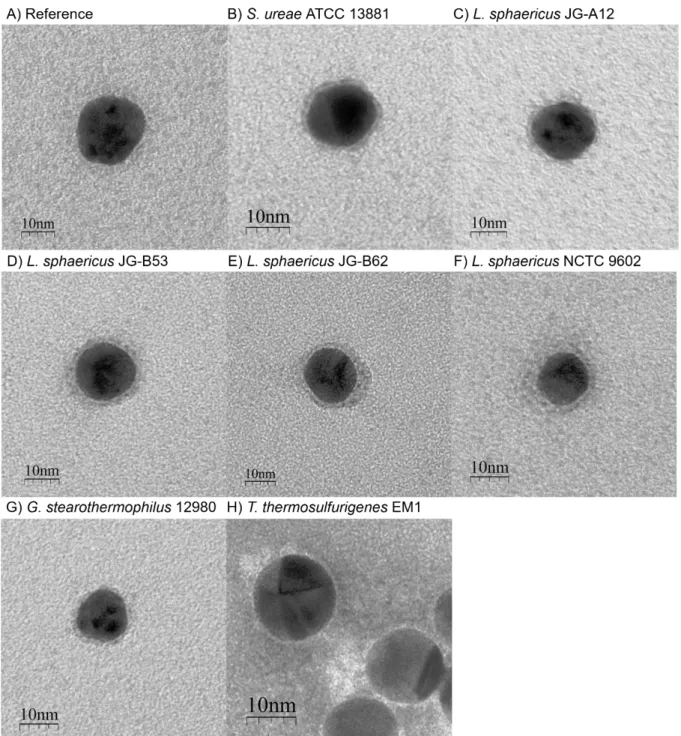
Figure SI3 TEM images of A) AuNP reference, and AuNPs functionalized with S-layer protein B) SslA from S. ureae ATCC 13881, C)
of L. sphaericus JG-B53, D) of L. sphaericus JG-B62, E) of L. sphaericus JG-A12, F) of L. sphaericus NCTC 9602, G) of
4
Colorimetric analyte detection principle
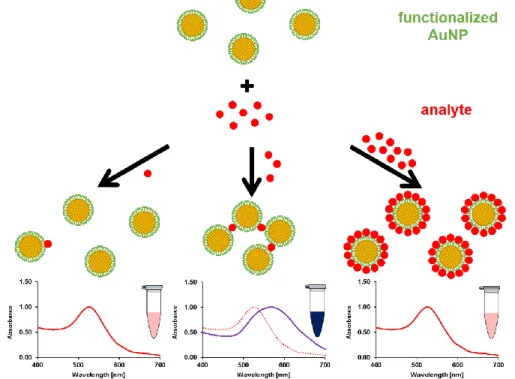
A stable colorimetric solution of S-layer functionalized AuNP (OD527=1) is characterized by the typical ruby-red color of
a colloidal solution of spherical AuNP (Fig. SI4). The color originates from the interaction of widely separated AuNP with a white light source – typically sunlight – by plasmon absorption of the single particles. A decrease of the particle distance, e.g. by particle agglomeration, results in a shift of the plasmon absorption by plasmon coupling and a color change of the colloidal solution from red to blue. This particle agglomeration of S-layer functionalized AuNP was induced by the addition of crosslinking agents, different metal salts in our experimental setting. The effect is illustrated in the scheme in Figure SI4.
In the first instance, at low metal ion concentrations, the S-layer functionalized AuNP are stable and widely separated in the solution. There is no change of absorbance or of the color of the AuNP solution, indicated by a stable red coloration as well as no measurable color and extension change [1,2]. This is due to the protein functionalization and the positive surface charge, which leads to a stabilization of the AuNP by repulsion of the Coulomb force.
Figure SI4 Schematic illustration of the agglomeration via cross-linkage of S-layer functionalized AuNP by metal ions,
(modified from Lakatos [1]). Green = S-layer proteins, Yellow = AuNP, Red = metal ions. The visible color change of the reaction solution for the individual graph sections is schematically represented by the reaction vials.
In the second instance, after adding the metal salt solution, the metal ions can interact with the different functional
surface groups of the S-layer protein, such as NH2, NH, OH, CO, COOH, SH and PO4. These interactions induce the
cross-linkage of metal ions with S-layer proteins, and therefore facilitate the agglomeration of several S-layer functionalized AuNP [3]. Depending on the size of the agglomerates of the functionalized AuNP and their density, plasmon coupling and therefore a visible change in color and an increase in the extinction at higher wavelength (e.g. 575 nm) takes place, leading to a visible change in coloration of the solution from red to blue.
In the third and last instance, a further increase of the metal ion concentrations leads to a saturation of all still free binding sites on the S-layer proteins with the result that no cross-links between the nanoparticles can longer takes place. This results in minor or no measurable extinction change and a solution, which looks similar to the baseline/reference solution (without metal ions).
Although the color shift indicates a reaction between an analyte and the biofunctionalized AuNP, in some cases the maximum peak shift was so small that the color change was not perceivable by eye. However, these minor changes were detectable by UV/Vis spectroscopy as a shift or the broadening of the plasmon absorption band of the AuNP, as well as by the appearance of a peak-shoulder or a drop in signal intensity.
5
Calculation of relative extinction change at 575 nm
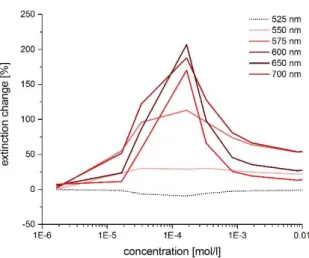
The extinction maximum change at 575 nm was normalized against the value of the reference sample without analyte. For this purpose, the baseline extinction value at 575 nm of the reference (0 mol/l analyte concentration) was subtracted from the extinction value at 575 nm of a sample with a certain metal ion concentration (see Equation 1). This difference was plotted as percentage of extinction at 575 nm of the reference measurement. The focus was on the range between 525 nm and 575 nm, in which a shift of the maximum peak was detected. Within this range, the changes between the spectra of different S-layer AuNP systems and the analyte concentrations tested are clearly visible (see Fig. SI5).
𝑒𝑥𝑡𝑖𝑛𝑐𝑡𝑖𝑜𝑛 𝑐ℎ𝑎𝑛𝑔𝑒 𝑎𝑡 575 𝑛𝑚 [%] =𝑒𝑥𝑡𝑖𝑛𝑐𝑡𝑖𝑜𝑛 𝑜𝑓 𝑟𝑒𝑓𝑒𝑟𝑒𝑛𝑐𝑒 𝑎𝑡 575 𝑛𝑚 − 𝑒𝑥𝑡𝑖𝑛𝑐𝑡𝑖𝑜𝑛 𝑜𝑓 𝑠𝑎𝑚𝑝𝑙𝑒 𝑎𝑡 575 𝑛𝑚
𝑒𝑥𝑡𝑖𝑛𝑐𝑡𝑖𝑜𝑛 𝑜𝑓 𝑟𝑒𝑓𝑒𝑟𝑒𝑛𝑐𝑒 𝑎𝑡 575 𝑛𝑚 × 100 (1)
Figure SI5 Change of the relative extinction of AuNP functionalized with S-layer protein from S. ureae ATCC 13881 with varying
6
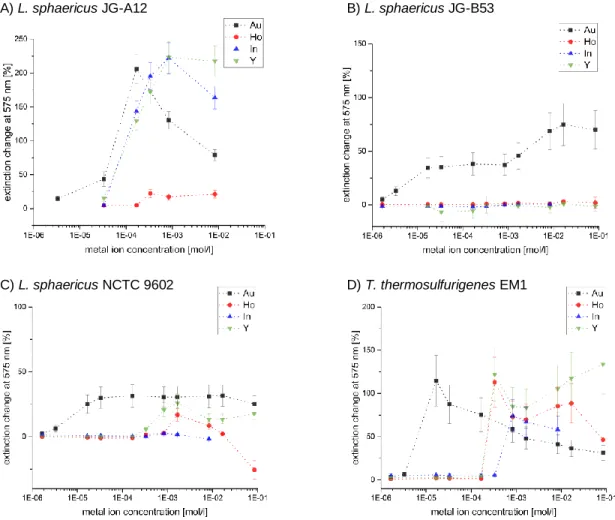
Figure
SI
6 Reaction range of relative extinction change at 575 nm of AuNP functionalized with S-layer protein fromA) L. sphaericus JG-A12, B) L. sphaericus JG-B53, C) L. sphaericus NCTC 9602, and D) T. thermosulfurigenes EM1 tested for different metal ions.
Figure SI7 A) SEM image of citrate stabilized AuNP (20 - 30 nm) used for functionalization with S-layer proteins and biosensing,
and B) Size distribution of this SEM image calculated with Image J (average diameter = 26.11 ± 1.74 nm, n = 228).
A) L. sphaericus JG-A12 B) L. sphaericus JG-B53
C) L. sphaericus NCTC 9602
A)
D) T. thermosulfurigenes EM1
7
References
[1] M. Lakatos, S. Matys, J. Raff, W. Pompe, Colorimetric As (V) detection based on S-layer functionalized gold
nanoparticles, Talanta. 144 (2015) 241–246. doi:10.1016/j.talanta.2015.05.082.
[2] J. Jung, A. Blüher, M. Lakatos, G. Cuniberti, Metal ion binding and tolerance of bacteria cells in view of sensor
applications, J. Sensors Sens. Syst. (2018) 433–441.
[3] F. Roosen-Runge, B.S. Heck, F. Zhang, O. Kohlbacher, F. Schreiber, Interplay of pH and Binding of Multivalent Metal
Ions: Charge Inversion and Reentrant Condensation in Protein Solutions, J. Phys. Chem. B. 117 (2013) 5777–5787. doi:10.1021/jp401874t.