Reduction of Nanoparticle Load in Cells by
Mitosis but Not Exocytosis
Joël Bourquin,
†Dedy Septiadi,
†Dimitri Vanhecke,
†Sandor Balog,
†Lukas Steinmetz,
†Miguel Spuch-Calvar,
†Patricia Taladriz-Blanco,
†Alke Petri-Fink,
†,‡and Barbara Rothen-Rutishauser
*
,††
Adolphe Merkle Institute, University of Fribourg, Chemin des Verdiers 4, 1700 Fribourg, Switzerland
‡Department of Chemistry, University of Fribourg, Chemin du Muse
́e 9, 1700 Fribourg, Switzerland
*
S Supporting InformationABSTRACT:
The long-term fate of biomedically relevant nanoparticles
(NPs) at the single cell level after uptake is not fully understood yet. We
report that lysosomal exocytosis of NPs is not a mechanism to reduce the
particle load. Biopersistent NPs such as nonporous silica and gold remain in
cells for a prolonged time. The only reduction of the intracellular NP number
is observed
via cell division, e.g., mitosis. Additionally, NP distribution after
cell division is observed to be asymmetrical, likely due to the inhomogeneous
location and distribution of the NP-loaded intracellular vesicles in the mother
cells. These
findings are important for biomedical and hazard studies as the
NP load per cell can vary signi
ficantly. Furthermore, we highlight the possibility of biopersistent NP accumulation over
time within the mononuclear phagocyte system.
KEYWORDS:
engineered nanoparticles, intracellular fate, exocytosis, mitosis, live cell imaging
E
ngineered nanoparticles (NPs) such as gold (Au NPs),
silica (SiO
2NPs), or super paramagnetic iron oxide NPs
(SPIONs) are already in use for various medical
applications including imaging and cancer irradiation therapy
and as carriers for drug delivery.
1,2Such NPs can be
administered into the bloodstream by injection, ingestion, or
inhalation and transported to targeted sites. However, the fate of
these NPs after delivery to targeted sites, i.e., cells and tissues, is
not fully understood.
1The potential clearing from the body
depends on the physicochemical properties of the NPs and is
managed through physical
filtration (e.g., renal clearance) or
transcytosis (e.g., hepatic clearance), in which the NPs are
consecutively excreted in either urine, bile, or feces.
1,3Another
clearance pathway is performed by the mononuclear phagocyte
system (MPS), which consists mainly of monocytes and
macrophages that retain and degrade the uptaken NPs in the
lysosomes.
4−9Biodistribution, organ-based clearance, and
cellular endocytic uptake pathways of NPs are extensively
studied, whereas the intracellular fate and the potential clearance
of NPs at the cellular level receives much less attention.
10−12Biopersistent or nonbiodegradable materials pose the risk of
potentially accumulating within cells, as lysosomes are often
understood as the end point in intracellular tra
fficking.
6,13Various in vivo studies have reported the long-term retention
(e.g., weeks to month) of such biopersistent NPs (e.g., Au NPs or
nonporous SiO
2NPs) in the MPS, especially in the liver.
1,14,15
Even months after a single intravenous injection of Au NPs,
substantial Au NP numbers were still found in lysosomes in
Murine Kup
ffer cells, despite the absence of any
patho-morphological response.
14,16,17The lysosomal exocytotic pathway has been suggested as a
possible pathway for the prevention intracellular accumulation
of foreign material.
8,18−20The classical stimulus of lysosomal
exocytosis is a Ca
2+in
flux into the cell, an indicator of cell
membrane rupture.
20−22It has been proposed that lysosomes
can fuse with the cell membrane to release undigested material.
8Exocytosis of NPs has been investigated using di
fferently sized
and surface-functionalized particle models, but a consensus
about which physicochemical properties (e.g., size, surface
charge, or surface functionalization) a
ffect the efficiency of NP
exocytosis the most has yet to be found.
11,23,24Even though the
mechanism of NP exocytosis is under debate, it is clear that the
cell type plays a major e
ffect on the exocytosis pattern of NPs.
18In addition to NP degradation and exocytosis, cell division (or
mitosis) can also contribute to reduction of intracellular NP
concentration.
25,26By undergoing mitosis, cells are dividing
their intracellular contents (including possible NP-laden
lysosomes) and, therefore, the NP load is expected to be shared
among the daughter cells.
27This distribution of NPs could
modulate the e
fficiency of NP-based drugs targeting dividing
cells (e.g., cancer or stem cells). The limited data available
suggest an unregulated distribution process similar to the
http://doc.rero.ch
distribution of lysosomes during mitosis.
28Interestingly, an
asymmetric NP distribution is often observed: one daughter cell
receives more NPs than the other.
26,27It has been speculated
that this process may help cells to prevent the spreading of
undigested materials into the whole population by concentrating
them in few individual cells.
29Herein, we investigate the in vitro fate of three di
fferent types
of NPs: nonporous
fluorescently labeled 71 nm SiO
2NPs and
polyvinylpyrrolidone (PVP)-coated Au NPs (Au@PVP; 20 and
46 nm in size) in primary monocyte-derived macrophages
(MDMs), macrophage cell line (J774A.1), and a nonphagocytic
cell line (HeLa).
Our hypothesis is that NPs can be exocytosed from lysosomes,
while other effects (e.g., mitosis) are running concomitant.
18,25Our results show that dilution of NPs in cell division plays a
dominant role in cellular NP distribution, while in contrast to
some reports in literature, no signi
ficant amount of NP
exocytosis was detected over a time period of up to 48 h
post-exposure. This was shown to be independent of the NP size and
material in macrophages.
30RESULTS AND DISCUSSION
Synthesis and Characterization of the Model NPs
.Our
study focused on two biocompatible NPs systems: Au NPs and
nonporous SiO
2NPs.
Au NPs have been shown to be relatively biologically inert and
nonbiodegradable and are therefore thought to have great
potential as a base for biomedical NPs. Many di
fferent studies
investigated the interaction of such engineered Au NPs with
biological systems in vitro and in vivo. Au NPs of various sizes
have been shown to be secreted in different cell lines by previous
studies.
11,23,31Furthermore, they o
ffer the possibility of being
surface-functionalized (e.g., with PVP), which can improve their
stability in cellular environments. Moreover, there are sensitive
quantification techniques (e.g., ion-coupled plasma optical
emission spectroscopy (ICP-OES)) available to detect the
particles in such complex samples. Herein, the Au NPs were
functionalized with PVP to increase NP stability in
serum-containing cell culture medium (cCCM).
32PVP-coated NPs
have been shown to be readily uptaken by cells with no acute
toxic effects.
33The colloidal stability of the Au NPs in cCCM
was tested by UV
−vis spectroscopy after 0 and 24 h and revealed
no aggregation in cCCM for either particle size (
Figure S1
).
Silica as a base material is also used in biomedical particles.
Mesoporous silica NPs (MSN) are generally used for biomedical
applications. They o
ffer high loading capacity of active
ingredients enabling their potential use in bioimaging, drug
delivery and photodynamic therapy.
34−37However, studies have
shown that such MSN can be degraded in relatively short times
in biological environments.
38−40Since this biodegradability was
not optimal for our research goals, as it would increase
complexity in the detection and sample analysis, we chose to
use nonporous particles. While they are less frequently used for
biomedical applications, nonporous silica particles are more
stable and show less degradation in the time frame we were
interested in (i.e., 1 week).
35,38,41,42Furthermore, di
fferent
nonporous silica particle sizes (25, 45, and 75 nm) have been
shown to be secreted by di
fferent cells (HUVEC, C17.2 cells and
PC12 cells) in a previous study.
43The nonporous SiO
2NPs
were further functionalized with the
fluorescent dye rhodamine
B (RhoB) in the silica matrix to ease their detection within cells
using confocal laser scanning microscope (cLSM) and
fluorescence-assisted flow cytometry (FC). The stability of the
SiO
2NPs in cCCM was con
firmed using CryoTEM (
Figure
S1A
). We could observe the onset of moderate aggregation only
when the particle concentration was increased more than 10
times (from 20 to 250
μg/mL).
Representative TEM micrographs of the individual particles
are depicted in
Figure 1
A, and the summary of the
character-ization is depicted in the table in
Figure 1
B.
Particles Are Taken up and Retained by All Tested
Cells. Commonly, NP cellular exocytosis was studied by a NP
loading step in the range of minutes to a few hours (often 6 h)
followed by observing the release of NPs from the cells into the
extracellular space in the following minutes to hours.
18,23,24,44−53The highest concentrations of exocytosed NPs were usually
reported within the
first few hours. However, after 6 h, the
uptaken NPs might still reside in sorting or early endosomes,
where membrane recycling occurs that can also resecrete the
NPs to the extracellular space. The endosomal trafficking
depends on the ingested materials. Some materials (e.g., cell
debris) can reach lysosomes within 30 min, while others (i.e.,
latex particles) have been shown to only reach the lysosomes
hours later.
47,50,54−57As the required time to fully process the endocytic vesicles
varies depending on the uptaken cargo, the incubation time of 24
h was selected to ensure the NPs reached the lysosomes, and
therefore, recycling processes were excluded.
6Macrophages were chosen as the primary cell model as they
are the main cell type represented in the MPS taking up
administered NPs.
13J774A.1 mouse macrophages are a cell line
often used to assess NP-cell interaction.
58−61Another cell type,
human primary monocyte-derived macrophages (MDMs), are
used as they are supposed to be more human relevant in addition
to the fact that mitosis is absent in MDMs. Finally, the HeLa cell
line was included as literature on NP exocytosis is available.
30,62Initially, the biocompatibility of the three NPs was evaluated
by two different cytotoxicity assays. The lactate dehydrogenase
(LDH) assay showed no increase in membrane permeabilization
after NP administration, indicating no acute toxic effects. This
result is con
firmed by the resazurin assay: the intracellular
metabolic activity of resazurin to resarufin turnover was not
Figure 1. Characterization of the different NPs. (A) Representative TEM images of different NPs. Scale bar = 100 nm. (B) Table recapitulating the most important physicochemical characteristics of NPs including core size, hydrodynamic diameter (in Milli-Q (MQ) H2O), andζ potential (in 0.1× phosphate-buffered saline (PBS)). HD = hydrodynamic; PDI = polydispersity index.
impaired for any of the tested particles at working
concen-trations of 20
μg mL
−1. (
Figure S2
)
cLSM z-stack images were acquired to con
firm the uptake and
retention of the
fluorescently labeled SiO
2NPs (
Figure 2
) at 0
and 48 h post-exposure. It could be shown that the cells were
filled with particles directly after exposure and at 48 h
post-exposure, but a lower signal was registered in HeLa cells in
comparison to the two macrophages cell types in both time
points. Moreover, an increase in NP-loaded vesicles (NLVs)
volume 48 h post-exposure was observed by comparing the
mean volumes of the NP signal of at least 438 individual vesicles.
Our analysis shows a statistically signi
ficant result (with p value
of J774A.1 and MDM: < 0.0001; HeLa: 0.0035) proving the
increase of the vesicle’s volume in all cell types after 48 h
post-exposure (mean and standard deviations are reported in the
inset of
Figure 2
). We argue that this size increase is likely due to
fusion events of NLVs with lysosomes, indicating that even after
24 h of uptake the endosomal maturation and tra
fficking may
not yet be fully complete.
Additionally, the NP tra
fficking to the lysosomes was
monitored in a colocalization experiment. After 24 h of
exposure, the location of the NPs in the cells was assessed and
compared to a lysosomal staining. The Pearson
’s correlation
coe
fficients (PCC) of the colocalizations between SiO
2NPs and
the lysosomal marker were 0.72, 0.72, and 0.65 for J774A.1,
MDMs, and HeLa, respectively, indicating a high (but not
complete) degree of colocalization after 24 h (
Figure S3
).
The uptake and retention of both types of the Au NPs was
con
firmed using dark field (DF) microscopy since no
fluorescent marker was attached to the Au NPs (
Figure 3
).
The electron-dense and highly scattering Au NPs appear as
bright spots within the cells (cell outline is shown as thin white
line). Both Au NP types appear intracellularly in all cell types for
both tested time points. No visual di
fferences could be observed
between the bright white spots, which are expected to be NLVs,
for the two di
fferent particle sizes. Our semiquantitative image
analysis data shows that the bright spots are slightly larger in area
48 h post-exposure than without post-exposure in all conditions.
Signi
ficant increases (student’s t test) were observed in both Au
NP sizes in J774A.1 and the 20 nm Au@PVP in the case of
MDMs (
Figure S4
).
Figure 2. Confocal laser scanning microscopy confirms uptake and retention of SiO2NPs. Single-plane visualization of SiO2NPs in the different cell types was accomplished by confocal laser scanning imaging. After exposure to NPs, the cells were washed and immediatelyfixed and stained (0 h) or further incubated for 48 h in NP-free medium (48 h) before thefixation and staining. The NPs (magenta) are localized inside the cells, and still detectable signals could be seen in both time points, but not the negative control. F-Actin was stained as cellular marker using a Phalloidin AlexaFluor 488 conjugate (green), and the nucleus was stained using 4′,6-diamidino-2-phenylindole (DAPI) (cyan). The xz-projection in the bottom shows the NPs are localized intracellularly. The volume (mean± standard deviation) of NLVs is denoted in the white insert at bottom right of the images. Scale bar = 20μm.
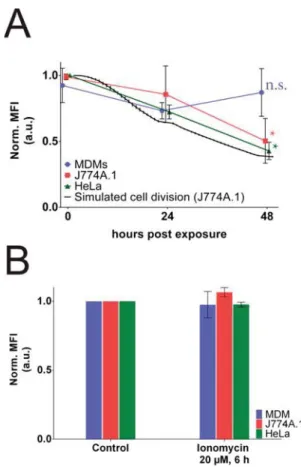
Flow Cytometry Shows No Decrease of Fluorescence
in Nondividing Cells. To quantify the intracellular amount of
SiO
2NPs over time, FC was applied. The
fluorescence signal
from the particles in or adhered to the cells was analyzed at 0, 24,
or 48 h post-exposure in NP-free cCCM. Over the analyzed time
period, the
fluorescent signal associated with SiO
2NPs inside
the MDM cells was stable and did not show any signi
ficant
reduction (
Figure 4
A, blue line) of the mean
fluorescence
intensity (MFI; p value 0.944, nonparametric, Friedman test). In
contrast, the cell lines J774A.1 (
Figure 4
A red line) and HeLa
(
Figure 4
A, green line) showed a significant decrease in MFI
after 48 h post-exposure: the MFI dropped to below 50% of the
initial value directly after exposure (0 h) resulting in p values of
0.041 and 0.028 for J774A.1 and HeLa, respectively.
This signal decrease could be explained by (i)
fluorescence
quenching or NP degradation in the lysosomes, (ii) exocytosis
or (iii) NP dilution due to mitosis.
The e
ffect of the lysosomal environment on the fluorescence
was assessed through incubation in arti
ficial lysosomal fluid
(ALF).
42,63No signi
ficant reduction of fluorescence intensity
was observed after 48 h in ALF (
Figure S5
), in accordance with
the work of Milosevic et al.
41This comes to no surprise as the
fluorescent dye is incorporated in the matrix and is not readily
exposed to the acidic
fluid.
42To determine whether the decrease in
fluorescence was the
result of exocytosis, we introduced the ionophore ionomycin,
which increases intracellular Ca
2+concentrations and can thus
stimulate lysosomal excretion leading to increased NP
exocytosis in various cell types.
18,64The e
fficiency of ionomycin
to stimulate lysosomal exocytosis has been tested in the case of
MDMs using a
β-hexosaminidase assay which showed that the
release of the lysosomal enzyme was signi
ficantly increased upon
incubation of the cells with ionomycin (
Figure S6
). After 24 h of
exposure to the SiO
2NPs, the cells were incubated with 20
μM
ionomycin for 6 h and further analyzed using FC. Neither of the
three cells types showed signi
ficant changes in their MFI
compared to the untreated control (i.e., no ionomycin)
according to a student’s t test (
Figure 4
B), indicating that
lysosomal exocytosis had no signi
ficant effect on NP release in all
tested cell types.
The ionomycin experiment was performed only for an early
time to minimize the e
ffect of dilution of NPs by cell division
(and because of ionomycin
’s long-term apoptosis inducing
e
ffects). Since even ionomycin-forced Ca
2+in
flux could not
reduce the MFI per cell significantly, in neither the macrophages
nor the HeLa, we conclude that lysosomal exocytosis of NPs in
the herein-investigated cells and NP model is of minor
importance.
One explanation for why we do not observe any signi
ficant
reduction in
fluorescence even after stimulation of exocytosis by
ionomycin could be the endosomal maturation process which
decides the
final fate of an engulfed cargo. After NP uptake, the
particles end up in endocytic vesicles. From there, the early
endosomes mature into late endosomes which then fuse with
each other to form larger structures and combine with
pre-existing lysosomes to form so-called endolysosomes. Finally, by
fusion of endolysosomes with phagosomes, the so-called
phagolysosomes are formed with a specialized acidic and
hydrolytic milieu.
65It has been shown that only a minor fraction
of the uptaken cargo can be excreted again into the extracellular
space via slow/fast recycling endosomes and thus bypass the
possible lysosomal degradation.
66During this process, the
vesicles are constantly tra
fficked toward the perinuclear space,
increasing the distance to the cellular membrane and reducing
the probability of fusing with it.
67This means that there is a
possibility of NP release in endosomes, but NP release becomes
less probable after tra
fficking into lysosomes or phagolysosomes.
We therefore speculated that the decrease of
fluorescence
could be due to dilution of the NPs in increasing cell numbers
during cell division rather than being the result of exocytosis.
This would explain the di
fference between the dividing (J774A.1
and HeLa) and nondividing (MDM) cells in the reduction of the
MFI with increasing time post-exposure (see
Figure 4
A). To test
this hypothesis, we repeated the experiment under
serum-deprived conditions (i.e., 0.5% instead of 10% FBS) to inhibit
the cell proliferation (
Figure S7
). As expected, inhibiting the cell
proliferation resulted in an almost constant MFI and a drop of
Figure 3. DF microscopy revealing the uptake of Au NPs in all cell types. DF microscopy confirms the uptake of both types of Au NPs within the different cell types and the presence of NPs 0 and 48 h post-exposure. Each cell type shows intracellular bright white spots originating from the scattering of the Au NPs. The white line marks the outline of the cells. Scale bar = 20μm.
only 10% compared to the initial value that was observed. This
reduction can be explained by either the presence of a few cells
that still proliferated or stress-induced release of microvesicles
containing particles, as previously observed by other studies in
starvation conditions.
68We cannot exclude that cell functions
such as exocytosis were a
ffected in this experiment.
Additionally, we simulated the MFI of a population of
macrophages undergoing cell division. Proliferation of J774A.1
macrophage cells in the presence of SiO
2NPs was
experimentally obtained by counting the cell number at speci
fic
time points. Doubling time was found to be 26.9 h (three
independent repetitions; mean over 96 h). We then created an R
(version 3.4.4) simulation (see
SI S8
for the code) in which this
parameter was used. The simulation assumes a healthy cell
culture and registers the
fluorescence intensity of each cell in a
culture at each time point. Mitosis occurred when the doubling
time was reached, and the two daughter cells each received
51.6% (as experimentally found as shown in
Figure 6
C) of the
mother’s fluorescence signal. The simulation ran 25 times,
always starting with a seed of 1000 mother cells, with each at a
random time point in its cell cycle. Each experiment was run to
simulate a cell cycle period of 48 h. The results of the simulated
MFI are shown in
Figure 4
A (black line).
The results of the simulation are in very good agreement with
the experimental data, with the decrease in MFI being only
slightly faster in the simulation than in the experiments. This
difference can be accounted for by considering that the
simulation does not incorporate the e
ffects of environmental
factors such as space availability (cells in confluent cultures will
divide slower), reduced serum availability in later time points, or
a slower start of growth just after seeding as has been reported.
69We hypothesize a gradual dilution of the NPs within increasing
culture time which could
finally result in cells without NPs and
spreading of few NPs over many cell.
No Exocytosis of Au NPs in Macrophages. As exocytosis
of Au NPs has been described to be size dependent, we
investigated the exocytosis of two di
fferent Au@PVP NP sizes
(20 and 46 nm mean core diameter) using a complementary
quanti
fication method: ICP-OES.
23All three cell types were
exposed for 24 h with NPs and either directly analyzed (0 h) or
incubated for another 48 h with NP-free cCCM. The
extracellular fraction and the cell lysates were digested, and
their gold content assessed.
The intracellular fraction (light gray) and the extracellular
fraction (dark gray) are plotted for both Au NP sizes in
Figure 5
.
The extracellular fraction of the macrophage cell types (MDMs
and J774A.1) contained only a very small amount of gold (e.g.,
<2% of total detected gold), below the limit of quanti
fication, an
observation independent for NP size and time post-exposure.
The limit of detection with ICP-OES is in the range of 17 ng
mL
−1for gold corresponding to a very low fraction, i.e., 1 % gold
in the supernatants. Since we are at the detection limit of the
instrument we can, however, not exclude that a low number of
Figure 4. Flow cytometry to analyze cell-associatedfluorescence. (A) Reduction of meanfluorescence intensity (MFI) 0, 24, and 48 h post-exposure. Thefluorescence decreases significantly for the two cell lines (J774A.1 in red and HeLa in green;p values 0.042 and 0.028, respectively), while the MFI of the MDM in blue remains constant (p value 0.944). The graph shows the mean of three individual experiments ± standard deviation (SD). Black line simulates the MFI expected from dilution due to cell division. n.s. = nonsignificant. (B) Effects of the lysosomal exocytosis stimulated by ionomycin on the MFI after 6 h of treatment. No significant reduction (i.e., p value of paired t test > 0.05) was detected for any of the tested cells. The graph depicts the MFI± SD of three individual experiments normalized to the untreated control.
Figure 5. ICP-OES analysis of the gold content of cells show no reduction over time for macrophages. Distribution of the location of 20 nm Au@PVP NPs (A) and 46 nm Au@PVP NPs (B) after 24 and 48 h post exposure, respectively. Almost the entire amount of gold was found in the intracellular fraction (light gray) for the macrophages. Only the 46 nm Au@PVP NPs (B) showed a substantial amount of gold in the supernatant (dark gray) in HeLa cells 48 h post exposure.
Figure 6. Cell division effectively reduces particles per cell numbers asymmetrically. (A) Schematic depiction of the analysis of mitotic events. Z-stacks werefirst projected onto a single plane by summation of the individual images. The intensity of the NPs in the mother cell was then calculated with the area of the cell and the mean intensity over this area. The division was then observed, and the axis of division was determined during cytokinesis. The axis was overlaid on the mother to split the cell into two parts (M1 and M2). The intensity was then calculated for the daughters and compared to the two parts of the mother. (B) Representative single plane images done by live cell imaging using confocal laser microscopy before, during, and after mitosis. Scale bar = 20μm. (C) Differences of the daughter cells’ fluorescent signal compared to their mother’s. The two dots represent the daughter cells. The 50% line (red dashed line) marks an even-split event. The events were sorted to the highestfluorescence in a daughter. The average daughter receives 51.6% of the mother’s fluorescence. (D) Correlation between the daughters’ volumes (V1 and V2) to their corresponding fluorescent signals (I1 and I2). Pearson’s correlation coefficient (PCC) showed a positive correlation of 0.63. The gray area represents the 99% confidence interval; the black line shows the least-squares linear fit. (E) Correlation between the mother’s two-part fluorescent intensities (M1 and M2) to the corresponding daughters’ fluorescent signals (D1 and D2). PCC showed a strong positive correlation coefficient of 0.78. The gray area represents the 99% confidence interval; the black line shows the least-squares linearfit.
NPs is exocytosed. The highest amount of gold found in the
extracellular fraction, 14% of the total gold, was seen in HeLa
cells exposed to 46 nm Au@PVP NPs. This observation is
supported by the DF micrographs (see
Figure 3
), which showed
that large amounts of NPs were still present inside the cells 48 h
post-exposure, and further con
firms the results obtained with the
SiO
2NPs.
Our results clearly indicate that lysosomal exocytosis is
cell-type, and presumably NP size, dependent and it is not a main
mechanism performed by macrophages in a detectable amount
for any tested NP types or sizes. HeLa cells were able to release
some of the intracellular particles into the extracellular space
with slightly increased e
fficiency for the larger NPs.
The accumulation of biopersistent NPs must be taken into
account, in particular, for professional-phagocytic cells that
collect many thousands of NPs in their lifespan of several month
to years.
70This NP accumulation could potentially interfere
with the immune cells
’ natural function of clearing pathogens
from the surrounding tissue and, thus, could provoke local
results similar to immune de
ficiencies.
71,72Most prone to such
e
ffects would be the residual macrophages in organs that are
readily exposed to NPs, such as the lung, liver, spleen, kidney,
and gastro-intestinal tract.
1It has been shown that alveolar
macrophages in smokers were
filled with particles, which caused
a reduction in the motility of the macrophages and the
subsequent signi
ficant impairment of the early immune response
against tuberculosis.
71Furthermore, chronic exposure to Au
NPs can impair macropinocytosis: Au NP-laden endothelial
cells showed reduced proliferation capacity and increased
endoplasmic reticulum (ER) stress even when no acute toxicity
was observed.
8,49,73Mitosis Explains the Reduction of Fluorescence over
Time and Is Asymmetric. As the dilution due to cell division
was the only e
ffective mechanism-reducing cellular NP load we
observed with the herein used NP and cell types, we investigated
the distribution of SiO
2NPs during and after mitosis of dividing
cells. Previous studies showed that NPs can be diluted by mitosis
in cell cultures and that the distribution can be inhomogeneous
(i.e., particles are not equally split into the daughter
cells).
26,29,74,75J774A.1 cells were incubated for 24 h with 20
μg mL
−1SiO
2NPs and then analyzed by live cell imaging using the cLSM. The
fluorescence signals were analyzed in diving cells before and after
they completed cytokinesis. The work
flow is shown
schemati-cally in
Figure 6
A. The analysis was performed by initially
transforming the 3D image stack into a 2D projection by
forming the sum of each individual plane. The areas of the cells
were mapped using the bright
field channel, which was used as a
mask for the cell contour, yielding the summed
fluorescence in
each cell (mother cell and two daughter cells) and time point
(that is, before and after division).
Some recent publications have discussed the importance of
cell volume, cell uptake receptors on the surface, and cell cycle
state to accurately represent the intracellular NP concentration
and uptake rates.
6−8Kim et al. showed evidence of the in
fluence
of cell cycle state on the particle internalization. On the other
hand, Panet et al. found no dependence on cell cycle state, but on
the cell size. We designed our study to be independent of both
parameters, i.e., cell cycle state or cell size, by applying a 24 h NP
pulse exposure prior to a thorough washing step, followed by the
investigation of the intracellular fate over up to 72 h at the single
cell level. Having a 24 h exposure ensures that most of the cells
have undergone one complete cell cycle, and therefore, less
in
fluence of the cell cycle state at the time of exposure can be
assumed. Furthermore, by following individual cells through
mitosis our results are also independent of variations during the
uptake, which is completed before the investigation starts.
We analyzed 28 individual mitotic events from
five
independent live cell imaging experiments. A representative
cell division is shown in
Figure 6
B.
Figure 6
C shows the
fluorescent signal distribution of the two daughter cells of all the
individual mitotic events. The
fluorescence signals were
normalized (mother cell is 100%), and the red dashed line
shows the 50:50 distribution of the two daughter cells from the
mother
’s initial fluorescent signal. The volume of the daughter
cells (estimated from the bright
field area of the cells) correlated
positively with the
fluorescence signal (correlation coefficient =
0.63), implying that bigger cells tend to receive more NPs
(
Figure 6
D).
The distribution of the NPs in the daughter cells was
corrected for the angle of the cleavage furrow of the mother cell
(the cell
’s axis of division during cytokinesis). The spatial
localization of NPs in the mother cells correlated to the
distribution of NPs in the daughter cells (correlation coe
fficient
or
fluorescence ratios = 0.78,
Figure 6
E) suggests that the
position of the NPs in the mother cells is the key factor de
fining
the destination of the NPs during mitosis. Therefore, the
di
fferences in NP distribution in the daughter cells are likely due
to an inhomogeneous distribution of the NPs inside the mother
cell. We observed that the cell nucleus takes up a large volume,
which prevents an even distribution of the lysosomal pool
throughout the cytoplasm (see
Figure 2
). This distribution
pattern is likely due to the location of the microtubule organizing
center (MTOC), which is usually located close to the nucleus as
shown by others.
76This condition remained even after
chromosome condensation during interphase of mitosis. During
mitosis the NP-containing lysosomes are coupled to the
microtubular network that brings them close to the equatorial
plane, but this step does not involve an active sorting
mechanism.
77This is in line with other studies which showed
that the partitioning of lysosomes in mitotic cells is a stochastic
process and that there is no evidence of a mechanism to ensure
equal distribution of these organelles into the daughter
cells.
78−80In a recent publication, it was shown that lysosomes form
clusters with higher abundancies close to the nucleus to enhance
the probability to fuse with incoming late endosomes containing
uptaken NPs.
81This results in a nonuniform distribution of
lysosomes within the cells, supporting our observations.
Here, we show that in the case of J774A.1 the uneven
distribution of SiO
2NPs into the daughter cells is the result of
the original location of the NLV in the mother cells. The
correlation coe
fficient of 0.78 between the mother’s NP location
and the daughters
’ NP distributions gives a strong indication
that no active sorting mechanism, for example, one to prevent
the spreading of NPs to the whole population that has been
speculated about, is present.
29We expect these results to be NP-type independent, as the
units of distribution are vesicles not single particles. These
findings are of great relevance for dividing cells since even a few
mitotic events cause a high variance in NP load in the cell
population. The impact of this phenomenon on NPs used for
nanomedical applications such as cancer research and therapy is
a topic which needs to be addressed.
82−84This can also be used
in imaging techniques relying on NPs as imaging agents (e.g.,
SPIONs as MRI contrast agents) as the NPs may rapidly be
diluted in the fast dividing cancer cells, whereas the NP
population would remain relatively stable in the surrounding
healthy tissue.
85Ultimately, the same goes for chemotherapeutic
drugs attached to NPs as a delivery agent, whose e
fficacy drops
quickly when a minimum intracellular concentration cannot be
reached.
86CONCLUSIONS
Our study has shown that the model NPs tested are retained in
the J774A.1 cell line and primary human macrophages. There is
no detectable amount of exocytosis of the SiO
2and Au NPs
particles at the tested sizes (20 and 46 nm for Au NPs and 70 nm
for SiO
2) and herein used cells, once they were located inside
lysosomes even after a long period of time. Our results highlight
the importance of studies that investigate the fate of NPs for
longer than 24 h. In particular, macrophages should be in focus
as they are usually the
first cell types coming in contact with NPs
and they cannot clear biopersistent materials.
Moreover, we showed that dividing cells dilute their NP cargo
e
ffectively by cell division. The quantification of individual
mitotic events showed that the distribution of SiO
2NPs in
J774A.1 does not always follow a symmetric pattern. We were
able to correlate the distribution of the individual daughter cells
to the location of the NPs in the mother cells, suggesting that the
different distribution has its origin in the parental spatial
distribution of the NPs rather than an active sorting process.
This di
fference in distribution has to be taken into account when
conducting experiments with dividing cells (usually cancer cell
lines) since the NP load per cell might vary signi
ficantly and
additional studies with nondividing cells are recommended.
EXPERIMENTAL METHODS
Synthesis of Nonporous Silica NPs. The NP synthesis was performed following a modified Stöber method previously described in literature.87,88 Shortly thereafter, tetraethyl orthosilicate (Sigma-Aldrich, USA) was added to a preheated mixture of ethanol, deionized water, and ammonium hydroxide in order to form 50 nm NPs. After 3 min of core formation, a (3-aminopropyl) triethoxysilane (APTES, Sigma-Aldrich, USA)−RhoB conjugate, prepared the previous day by mixing APTES with rhodamine B isothiocyanate in ethanol and stirring overnight, was added to the mixture to formfluorescently labeled layers around these cores. The reaction was stirred further for 5 h and cleaned by dialysis in deionized water for 1 week with daily exchange of water. After dialysis, the suspension wasfiltered over a 0.2 μm cellulose acetate filter.
The particle size was then determined by transmission electron microscopy (TEM, Tecnai G2 Spirit, Thermo Fisher Scientific Inc., USA) and calculated using a FIJI particle size analyzation script (ImageJ, National Institutes of Health; Bethesda, MD, USA). The NPs were further characterized with their hydrodynamic diameter (DLS, Brookhaven Instruments Corp., USA), theirζ potential (Brookhaven Instruments Corp., USA), and their UV−vis absorbance spectrum (Jasco Europe S. R. L., Italy). The concentration was determined by measuring the weight of 2 mL of particle suspension after evaporating the water at 70°C.
Synthesis of Au NPs. The synthesis of the Au NPs was performed using the Turkevich method published elsewere.32Briefly, 2.63 mL of AuIIIchloride trihydrate (0.095 M, Sigma-Aldrich, USA) was dissolved in 500 mL of MQ H2O (Merck KGaA, Germany) and brought to boil while stirring. Upon boiling, 10 mL of sodium citrate tribasic dehydrate (10%, Sigma-Aldrich) was added. After several minutes, the reaction turned from black to deep red showing the termination of the reaction resulting in 14 nm citrate-coated Au NPs.
Larger particles were obtained by an additional particle growth reaction through the addition of hydroxylamine hydrochloride (3 mL of
0.2 M) to a solution of AuIIIchloride trihydrate (0.25 mM in 270 mL of mQ H2O) followed by the addition of the 14 nm Au NPs seed (30 mL). Finally, the citrate-coated NPs were recoated using polyvinylpyrro-lidone (PVP, Acros Organics) with an approximate coating density of 120 molecules per nm2. This was obtained by dissolving PVP (8000 MW) in mQ H2O. Under constant stirring the Au NPs were slowly added dropwise to the PVP solution and allowed to stir overnight. The next day, the NPs were centrifuged for 1 h at 8000g and the supernatant was exchanged to fresh MQ H2O. Then the NPs were centrifuged for 1 h at 1,000g, and the supernatant was expelled again. Finally, the NPs were dispersed in fresh MQ H2O and characterized.
Cell Culture. The mouse macrophage cell line J774A.1 (ATCC) was cultivated in Roswell Park Memorial Institute 1640 (RPMI, Gibco, Life Technologies Europe B.V., Zug, Switzerland) cell culture medium supplemented with fetal bovine serum (FBS, 10%, PAA Laboratories, Chemie Brunschwig AG, Basel, Switzerland Switzerland, Life Technologies Europe B.V., Zug, Switzerland), L-glutamine (1%, Gibco, Life Technologies Europe B.V., Zug, Switzerland), penicillin (100 units mL−1, Gibco, Life Technologies Europe B.V., Zug, Switzerland), and streptomycin (100 μg mL−1, Gibco, Life Technologies Europe B.V., Zug, Switzerland), further noted as cRPMI. The T75 cultureflaks were kept at 37 °C, 5% CO2, and 95% humidity. At around 80% confluency, the RPMI was exchanged and the cells were scraped off the flask using a cell scraper. A 10−20% portion of the cell suspension was then added to a new T75flask (TPP Techno Plastic Products AG, Switzerland) and supplemented with fresh medium. The rest of the cell suspension was further used for experiments.
The human cervix carcinoma cell line HeLa (ATCC) was cultured in Dulbecco’s modified eagle media (Gibco, Life Technologies Europe B.V., Zug, Switzerland) supplemented with 10% FCS, penicillin (100 u mL−1, Gibco, Life Technologies Europe B.V., Zug, Switzerland) and streptomycin (100μg mL−1, Gibco, Life Technologies Europe B.V., Zug, Switzerland). The cell cultures were kept under sterile conditions at 37°C, 5% CO2, and 95% humidity. Prior to use, the cells were washed with fresh PBS (pH 7.2, Gibco, Life Technologies Europe B.V., Zug, Switzerland) and further detached using a mixture of Trypsin and EDTA (T/E, 0.25%, sterile-filtered, Gibco, Life Technologies Europe B.V., Zug, Switzerland) for 5 min at 37°C.
Primary human macrophages (MDMs) were obtained by isolating and further differentiating human peripheral blood monocytes from buffy coats as previously described.89 Briefly, human blood was
separated using density gradient filtration (Lymphoprep, Grogg Chemie). The monocyte fraction was extracted from the mixture and purified using CD14+ magnetic microbeads (Milteny Biotech, Germany). The isolated monocytes were then differentiated using colony stimulating factor 1 (m-CSF1, 10 ng mL−1, Milteny Biotech, Germany) supplemented cRPMI for 1 week.
Prior to seeding, the concentration of cells in suspension was determined using the trypan blue assay and an automated cell counter (EVE, NanoEnTek Inc., South Korea). For this, the cell suspension was mixed 1:1 with trypan blue (Sigma-Aldrich, USA) and pipetted into a cell counting slide. The cells were incubated for at least 4 h before exposing to the NPs (20μg mL−1) for 24 h. After exposure the cells were washed three times in PBS and incubated in fresh cRPMI for up to 48 h post-exposure.
Cytotoxicity. Cytotoxicity assays were performed using cells grown in eight-well microscopy slides. The cells were exposed 72 h to various concentrations of NPs (0−320 μg mL−1). After exposure, lactate dehydrogenase (LDH, Sigma-Aldrich, USA) and resazurin assays were performed. Briefly, Triton X-100 was added to the positive control 15 min prior to collecting the supernatant of each well. After collection, cRPMI supplemented with resazurin (23μg mL−1) was added to each well for 3 h. In the meantime, LDH levels were measured in triplicate by following the manufacturer’s protocol. The absorbance (DUAL function with 490 and 630 nm as reference wavelengths) was recorded using a microplate reader (Bio-Rad, USA). The supernatant containing resazurin and its fluorescent metabolic product resarufin was subsequently collected, and the fluorescence (Excitation: 560 nm/
Emission: 590 nm) was recorded using a microplate reader. Adequate medium and water only controls were done but are not shown.
Flow Cytometry. For FC, the cells were scraped off and centrifuged at 4°C for 5 min at 300 g. The supernatant was discarded, and the cell pellet was resuspended in PBS. This wash was repeated twice for a total of three washes, but thefinal resuspension was in cold FC buffer (PBS supplemented with 1% bovine serum albumin (BSA, Sigma-Aldrich, USA) and 0.1% sodium azide, Sigma-Aldrich, USA). Thefluorescence in cells was then measured with a BD LSR FORTESSA (BD Biosciences, USA) using the PE filter set. The threshold was set to measure 30,000 cells per sample.
Ionomycin. The cells were grown in six-well plates and then exposed to 20μg mL−1of SiO2NPs for 24 h. After exposure, the cells were extensively washed three times with PBS and further incubated with fresh, NP-free culture medium supplemented with 20 μM of ionomycin (Sigma-Aldrich, USA) for 6 h and further analyzed using FC. Control samples were treated the same but incubated without the addition of ionomycin.
Fluorescence Imaging. The cells were washed three times with PBS andfixed with 4% paraformaldehyde (PFA, Sigma-Aldrich, USA) in PBS for 10 min at room temperature. The cells were then washed with washing buffer (PBS supplemented with 0.1% BSA and 0.001% sodium azide) for 5 min. The cells were permeabilized in 0.2% Triton X-100 in PBS for 10 min at room temperature. Next, the samples were washed three times with washing buffer for approximately 2 min per wash. Then the cells were stained using 4′,6-diamidino-2-phenylindole (100μg mL−1, Sigma-Aldrich, USA) and Phalloidin Alexa Fluor 488 (1:100, Thermo Fisher Scientific Inc., USA) in PBS supplemented with 0.1% Triton X-100 (Fluka, Fisher Scientific AG, Switzerland) and 1% BSA for 1.5 h at room temperature in the dark. The staining solution was discarded, and the cells were washedfive times with PBS for 5 min each. After removal of PBS, a drop of Glycergel mounting medium (Merck KGaA, Germany) was added onto the cells and then covered with a glass coverslip. Images were then acquired using a Zeiss 710 cLSM with excitation lasers of 405 nm (DAPI), 488 nm (Alexa Fluor 488), and 561 nm (rhodamine B) equipped with a Plan-Apochromat 63x/1.4 Oil M27 objective (Zeiss GmbH, Germany). The average NLV-size was acquired using a 3D rendering of the rhodamine B channel in Imaris (Bitplane, Oxford Instruments, Switzerland).
Darkfield Imaging. To visualize the interaction and association of the Au NPs with the cells darkfield imaging was used. Cells (40,000 cells per well) were seeded in a four-well microscopy slide. After overnight attachment, the cells were then exposed to 20μg mL−1of Au NPs and incubated for 24 h. Then the cells were washed three times with PBS andfixed with 4% PFA in PBS for 10 min at room temperature. The cells were washed with washing buffer (PBS supplemented with 0.1% BSA and 0.001% sodium azide) for 5 min. The cells were permeabilized in 0.2% Triton X-100 in PBS for 10 min at room temperature. Next, the samples were washed three times with washing buffer for approximately 2 min per wash. Then the cells were stained using DAPI (100μg mL−1) and phalloidin rhodamine (1:100) in PBS supplemented with 0.1% Triton X-100 and 1% BSA for 1.5 h at room temperature in the dark. The staining solution was discarded, and the cells were washed five times with PBS for 5 min each. After removal of the PBS, a drop of glycergel mounting medium was added onto the cells and then covered with a glass coverslip. The cells were then imaged using a CytoViva hyperspectral microscope (CytoViva, Inc., USA) equipped with a Dolan-Jenner DC-950 light source, UPL Fluorite 100× objective, and SPECIM V10E imaging spectrograph with a 3D (EXi Blue) fluorescence/dark field detector. The average spot size was acquired by running the FIJI (NIH, USA) particle analysis script on the initially binarized and watershed images.
Ion-Coupled Plasma Optical Emission Spectroscopy. The cells and supernatants of different post-exposure times (0−48 h) were collected and evaporated overnight at 70°C in 48-well plates. The dried samples were then resuspended in 500μL of a mixture of H2O2:HNO3 (2:1, Sigma-Aldrich, USA) for 3 h at room temperature. The plates were sonicated for 20 min at 50°C to release excess H2O2/gas. Afterward, 400 μL of HCl (37%, VWR, USA) was added to each well and incubated overnight in a chemical hood. After incubation, the samples
were transferred into 15 mL Falcon tubes. Each well was washed three times with mQ H2O, and the washes were added to the Falcon tubes. Every tube was thenfilled to 10 mL with mQ H2O. The samples were further analyzed at ICP-OES (Optima 7000 DV, PerkinElmer, USA) and compared to a standard curve prepared gravimetrically using a gold standard (Sigma-Aldrich, USA).
Live Cell Imaging of Mitotic Events. J774A.1 cells were cultivated in six-well plates and exposed to 20μg mL−1of the RhoB-SiO2NPs for 24 h. After exposure, the cells were washed three times with fresh PBS, detached, and counted as previously described. Roughly 50,000 cells per well were seeded in a four-chamber live cell imaging slide (Nunc Lab-Tek II Chambered Coverglass, Thermo Fisher Scientific Inc., USA) and were allowed to attach for at least 1 h. After attachment, the microscopy slide was transferred into the preheated live cell imaging chamber of a Zeiss 710 cLSM. After 1 h of temperature stabilization, the cells were imaged using z-stack, time lapse imaging (10 min resolution) at 63× magnification. After acquisition, the videos were checked for mitotic events which were further analyzed using the open-source software FIJI.
Analysis of Mitotic Events. Dividing cells were identified in the observationfield and cropped before and after cell division. The z-stack was then transformed into a single plane image by forming the sum over the z-axis. The phase contrast channel was binarized and used to mask the cells. The mask was then multiplied with the previously acquired sum of the z-axis to obtain the totalfluorescence intensity of a cell. The volume of the daughter cells was then extrapolated by transforming the area of the z-projection using V = A3/2, assuming spherical cells. The axis of cell division was assessed in the image and used to split the mother cell into two parts (M1 and M2). The correlation between M1 and M2 cells was further compared to D1 and D2 cells. Correlation coefficients were calculated as X Y cov( , ) X Y ρ σ σ = (1) where cov is the covariance,σXis the standard deviation of X, andσYis the standard deviation of Y.
Analysis of Colocalization of SiO2NPs and Lysosomes. The different cell lines were exposed to 20 μg mL−1of the RhoB-SiO
2NPs for 24 h. After exposure, the cells were washed three times with PBS and further incubated with fresh cCCM supplemented with 75 nM LysoTracker Green DND-26 (Invitrogen, Thermo Fisher Scientific Inc., USA) for 15 min. Afterward, the cells were immediately imaged in a live cell setting described above. The colocalization was calculated using the imaging analysis software Imaris.
Fluorescence Stability of Rhodamine B Labeled SiO2NPs. The potential quenching offluorescence in the lysosomal milieu was tested by incubating the NPs in artificial lysosomal fluid. Sodium chloride (3.210 g), sodium hydroxide (6.000 g), citric acid (20.800 g), calcium chloride (0.097 g), sodium phosphate heptahydrate (0.179 g), sodium sulfate (0.039 g), magnesium chloride hexahydrate (0.106 g), glycerin (0.059 g), sodium citrate dihydrate (0.077 g), sodium tartrate dihydrate (0.090 g), sodium lactate (0.085 g), sodium pyruvate (0.086 g), and formaldehyde (1.000 mL) (added fresh before use) were dissolved in a total of 200 mL of MiliQ water forming a 5× stock solution. The stock solution was further diluted with MQ water and NP suspension in order to obtain a 1× ALF solution containing 1 mg mL−1 of SiO2NPs. Thefluorescence of 100 μL of this solution was measured after 0, 1, 2, 3, and 30 days of incubation at 37°C and 5% CO2using a microplate plate reader (Bio-Rad, USA). Incubation of the NPs in PBS was used as a control. The experiment was measured in triplicate.
CryoTEM. Lacey cryoTEM grids (Agar scientific, UK) were glow discharged for 20 s at 10W in air using a plasma cleaner (Diener, Germany). Five microliters of SiO2 NP solution (∼250 μg/mL, in cRPMI for 24 h) was pipetted onto the cleaned grid side and mounted on a home-built guillotine cryoplunger using inverted tweezers. The grids were blotted (5 s) withfilter paper (Whatman, grade 40) and immediately plunged in an eutectic mixture of ethane and propane cooled to 77 K by liquid nitrogen. The sample was transferred onto a 626 single tilt liquid nitrogen cryo-transfer holder (Gatan, CA, USA)
and observed in a ThermoFischer Spirit transmission electron microscope (ThermoFischer, MA, USA) equipped with a LaB6 filament at 120 kV. The images were recorded using a bottom-mount 4K Eagle camera (ThermoFischer, MA, USA) using a low dose mode of SerialEM.
β-Hexosaminidase Assay. A total of 300,000 MDM cells per well were seeded in a 12-well plate and left attached overnight. The cells were then exposed to cCCM supplemented with ionomycin (20μM). After 6 h of exposure, the supernatant was collected and the cells were lysed by adding fresh cell culture media supplemented with 0.1% Triton X-100 for 15 min. A 75μL portion of the supernatant or lysate was then mixed with 50 μL of substrate solution (5.84 mM 4-nitrophenyl N-acetyl-β-D-galactosaminide in citrate buffer, pH 4.5) and incubated in a 96-well plate for 1 h at 37°C. The turnover was subsequently stopped using 100μL of borate buffer (0.2 M boric acid in MQ H2O, pH 10), and the absorbance at 405 nm was assessed using a plate reader. The supernatant value was further compared with the values from the cell lysate + supernatant values, while cCCM + substrate solution was used as background value.
ASSOCIATED CONTENT
S
*
Supporting InformationThe
Supporting Information is available
NP stability tests in cRPMI, cytotoxicity results of the
di
fferent particles, colocalization of SiO
2NP and
lysosomes, spot size analysis of DF micrographs, stability
of SiO
2NPs
’ fluorescence in ALF, release of
β-hexosaminidase upon ionomycin incubation in MDMs,
fluorescence development in proliferation inhibited cells,
and Rscript for proliferation simulations(
)
AUTHOR INFORMATION
Corresponding Author*E-mail:
[email protected]
.
ORCIDJoël Bourquin:
0000-0001-8345-710XDedy Septiadi:
0000-0003-2353-7508Sandor Balog:
0000-0002-4847-9845Lukas Steinmetz:
0000-0003-4255-2738Miguel Spuch-Calvar:
0000-0002-6679-2624Patricia Taladriz-Blanco:
0000-0002-2469-9704Alke Petri-Fink:
0000-0003-3952-7849Barbara Rothen-Rutishauser:
0000-0002-7805-9366 FundingWe acknowledge the Swiss National Science Foundation
(310030_159847/1) and the Adolphe Merkle Foundation for
financial support.
Notes
The authors declare no competing
financial interest.
ACKNOWLEDGMENTS
We kindly thank Hana Barosova, Roman Lehner, Barbara
Drasler, and Christoph Bisig for their help in isolating
monocytes from human blood donations. Furthermore, we
thank Jessica Caldwell for proofreading and improving the
language of the manuscript.
REFERENCES
(1) Bourquin, J.; Milosevic, A.; Hauser, D.; Lehner, R.; Blank, F.; Petri-Fink, A.; Rothen-Rutishauser, B. Biodistribution, Clearance, and Long-Term Fate of Clinically Relevant Nanomaterials. Adv. Mater. 2018, 30, 1704307.
(2) Bobo, D.; Robinson, K. J.; Islam, J.; Thurecht, K. J.; Corrie, S. R. Nanoparticle-Based Medicines: A Review of FDA-Approved Materials and Clinical Trials to Date. Pharm. Res. 2016, 33, 2373−2387.
(3) Cho, M.; Cho, W.-S.; Choi, M.; Kim, S. J.; Han, B. S.; Kim, S. H.; Kim, H. O.; Sheen, Y. Y.; Jeong, J. The Impact of Size on Tissue Distribution and Elimination by Single Intravenous Injection of Silica Nanoparticles. Toxicol. Lett. 2009, 189, 177−183.
(4) Alexis, F.; Pridgen, E.; Molnar, L. K.; Farokhzad, O. C. Factors Affecting the Clearance and Biodistribution of Polymeric Nano-particles. Mol. Pharmaceutics 2008, 5, 505−515.
(5) van Furth, R. Mononuclear Phagocyte System. In Encyclopedia of Immunology; Elsevier, 1998; pp 1755−1758.
(6) Huotari, J.; Helenius, A. Endosome Maturation. EMBO J. 2011, 30, 3481−3500.
(7) Hu, Y.-B.; Dammer, E. B.; Ren, R.-J.; Wang, G. The Endosomal-Lysosomal System: From Acidification and Cargo Sorting to Neuro-degeneration. Transl. Neurodegener. 2015, 4, 18.
(8) Holtzman, E. Lysosomes; Springer US: Boston, MA, 1989. (9) Xu, H.; Ren, D. Lysosomal Physiology. Annu. Rev. Physiol. 2015, 77, 57−80.
(10) Kinnear, C.; Moore, T. L.; Rodriguez-Lorenzo, L.; Rothen-Rutishauser, B.; Petri-Fink, A. Form Follows Function: Nanoparticle Shape and Its Implications for Nanomedicine. Chem. Rev. 2017, 117, 11476−11521.
(11) Oh, N.; Park, J.-H. Endocytosis and Exocytosis of Nanoparticles in Mammalian Cells. Int. J. Nanomedicine 2014, 9 (Suppl 1), 51−63.
(12) Kou, L.; Sun, J.; Zhai, Y.; He, Z. The Endocytosis and Intracellular Fate of Nanomedicines: Implication for Rational Design. Asian J. Pharm. Sci. 2013, 8, 1−8.
(13) Gustafson, H. H.; Holt-Casper, D.; Grainger, D. W.; Ghandehari, H. Nanoparticle Uptake: The Phagocyte Problem. Nano Today 2015, 10, 487−510.
(14) Sadauskas, E.; Danscher, G.; Stoltenberg, M.; Vogel, U.; Larsen, A.; Wallin, H. Protracted Elimination of Gold Nanoparticles from Mouse Liver. Nanomedicine 2009, 5, 162−169.
(15) Takenaka, S.; Karg, E.; Kreyling, W. G.; Lentner, B.; Möller, W.; Behnke-Semmler, M.; Jennen, L.; Walch, a.; Michalke, B.; Schramel, P.; Heyder, J.; Schulz, H. Distribution Pattern of Inhaled Ultrafine Gold Particles in the Rat Lung. Inhalation Toxicol. 2006, 18, 733−740.
(16) Cho, W. S.; Cho, M.; Jeong, J.; Choi, M.; Cho, H. Y.; Han, B. S.; Kim, S. H.; Kim, H. O.; Lim, Y. T.; Chung, B. H.; Jeong, J. Acute Toxicity and Pharmacokinetics of 13 Nm-Sized PEG-Coated Gold Nanoparticles. Toxicol. Appl. Pharmacol. 2009, 236, 16−24.
(17) Von Maltzahn, G.; Park, J. H.; Agrawal, A.; Bandaru, N. K.; Das, S. K.; Sailor, M. J.; Bhatia, S. N. Computationally Guided Photothermal Tumor Therapy Using Long-Circulating Gold Nanorod Antennas. Cancer Res. 2009, 69, 3892−3900.
(18) Yanes, R. E.; Tarn, D.; Hwang, A. A.; Ferris, D. P.; Sherman, S. P.; Thomas, C. R.; Lu, J.; Pyle, A. D.; Zink, J. I.; Tamanoi, F. Involvement of Lysosomal Exocytosis in the Excretion of Mesoporous Silica Nanoparticles and Enhancement of the Drug Delivery Effect by Exocytosis Inhibition. Small 2013, 9, 697−704.
(19) Andrews, N. W. Regulated Secretion of Conventional Lysosomes. Trends Cell Biol. 2000, 10, 316−321.
(20) Blott, E. J.; Griffiths, G. M. Secretory Lysosomes. Nat. Rev. Mol. Cell Biol. 2002, 3, 122−131.
(21) Czibener, C.; Sherer, N. M.; Becker, S. M.; Pypaert, M.; Hui, E.; Chapman, E. R.; Mothes, W.; Andrews, N. W. Ca2+ and Synaptotagmin VII-Dependent Delivery of Lysosomal Membrane to Nascent Phagosomes. J. Cell Biol. 2006, 174, 997−1007.
(22) Medina, D. L.; Fraldi, A.; Bouche, V.; Annunziata, F.; Mansueto, G.; Spampanato, C.; Puri, C.; Pignata, A.; Martina, J. A.; Sardiello, M.; Palmieri, M.; Polishchuk, R.; Puertollano, R.; Ballabio, A. Transcrip-tional Activation of Lysosomal Exocytosis Promotes Cellular Clearance. Dev. Cell 2011, 21, 421−430.
(23) Chithrani, B. D.; Chan, W. C. W. Elucidating the Mechanism of Cellular Uptake and Removal of Protein-Coated Gold Nanoparticles of Different Sizes and Shapes. Nano Lett. 2007, 7, 1542−1550.
(24) Oh, N.; Park, J.-H. Surface Chemistry of Gold Nanoparticles Mediates Their Exocytosis in Macrophages. ACS Nano 2014, 8, 6232− 6241.
(25) Kim, J. A.; Åberg, C.; Salvati, A.; Dawson, K. A. Role of Cell Cycle on the Cellular Uptake and Dilution of Nanoparticles in a Cell Population. Nat. Nanotechnol. 2012, 7, 62−68.
(26) Summers, H. D.; Brown, M. R.; Holton, M. D.; Tonkin, J. A.; Hondow, N.; Brown, A. P.; Brydson, R.; Rees, P. Quantification of Nanoparticle Dose and Vesicular Inheritance in Proliferating Cells. ACS Nano 2013, 7, 6129−6137.
(27) Summers, H. D.; Rees, P.; Holton, M. D.; Brown, M. R.; Chappell, S. C.; Smith, P. J.; Errington, R. J. Statistical Analysis of Nanoparticle Dosing in a Dynamic Cellular System. Nat. Nanotechnol. 2011, 6, 170−174.
(28) Jongsma, M. L. M.; Berlin, I.; Neefjes, J. On the Move: Organelle Dynamics during Mitosis. Trends Cell Biol. 2015, 25, 112−124.
(29) Summers, H. Can Cells Reduce Nanoparticle Toxicity? Nano Today 2010, 5, 83−84.
(30) Chithrani, B. D.; Stewart, J.; Allen, C.; Jaffray, D. A. Intracellular Uptake, Transport, and Processing of Nanostructures in Cancer Cells. Nanomedicine 2009, 5, 118−127.
(31) Oh, E.; Delehanty, J. B.; Sapsford, K. E.; Susumu, K.; Goswami, R.; Blanco-Canosa, J. B.; Dawson, P. E.; Granek, J.; Shoff, M.; Zhang, Q.; Goering, P. L.; Huston, A.; Medintz, I. L. Cellular Uptake and Fate of PEGylated Gold Nanoparticles Is Dependent on Both Cell-Penetration Peptides and Particle Size. ACS Nano 2011, 5, 6434−6448. (32) Turkevich, J. Colloidal Gold. Part I. Gold Bull. 1985, 18, 125− 131.
(33) Dragoni, S.; Franco, G.; Regoli, M.; Bracciali, M.; Morandi, V.; Sgaragli, G.; Bertelli, E.; Valoti, M. Gold Nanoparticles Uptake and Cytotoxicity Assessed on Rat Liver Precision-Cut Slices. Toxicol. Sci. 2012, 128, 186−197.
(34) Park, J. H.; Gu, L.; Von Maltzahn, G.; Ruoslahti, E.; Bhatia, S. N.; Sailor, M. J. Biodegradable Luminescent Porous Silicon Nanoparticles for in Vivo Applications. Nat. Mater. 2009, 8, 331−336.
(35) Vivero-Escoto, J. L.; Huxford-Phillips, R. C.; Lin, W. Silica-Based Nanoprobes for Biomedical Imaging and Theranostic Applications. Chem. Soc. Rev. 2012, 41, 2673−2685.
(36) Bharti, C.; Gulati, N.; Nagaich, U.; Pal, A. Mesoporous Silica Nanoparticles in Target Drug Delivery System: A Review. Int. J. Pharm. Investig. 2015, 5, 124.
(37) Wang, T.; Zhang, L.; Su, Z.; Wang, C.; Liao, Y.; Fu, Q. Multifunctional Hollow Mesoporous Silica Nanocages for Cancer Cell Detection and the Combined Chemotherapy and Photodynamic Therapy. ACS Appl. Mater. Interfaces 2011, 3, 2479−2486.
(38) Croissant, J. G.; Fatieiev, Y.; Khashab, N. M. Degradability and Clearance of Silicon, Organosilica, Silsesquioxane, Silica Mixed Oxide, and Mesoporous Silica Nanoparticles. Adv. Mater. 2017, 29, 1604634. (39) Shen, D.; Yang, J.; Li, X.; Zhou, L.; Zhang, R.; Li, W.; Chen, L.; Wang, R.; Zhang, F.; Zhao, D. Biphase Stratification Approach to Three-Dimensional Dendritic Biodegradable Mesoporous Silica Nano-spheres. Nano Lett. 2014, 14, 923−932.
(40) Yamada, H.; Urata, C.; Aoyama, Y.; Osada, S.; Yamauchi, Y.; Kuroda, K. Preparation of Colloidal Mesoporous Silica Nanoparticles with Different Diameters and Their Unique Degradation Behavior in Static Aqueous Systems. Chem. Mater. 2012, 24, 1462−1471.
(41) Milosevic, A.; Bourquin, J.; Burnand, D.; Lemal, P.; Crippa, F.; Monnier, C. A.; Rodriguez-Lorenzo, L.; Petri-Fink, A.; Rothen-Rutishauser, B. Artificial Lysosomal Platform to Study Nanoparticle Long-Term Stability. Chimia 2019, 73, 55−58.
(42) Meder, F.; Thomas, S. S.; Fitzpatrick, L. W.; Alahmari, A.; Wang, S.; Beirne, J. G.; Vaz, G.; Redmond, G.; Dawson, K. A. Labeling the Structural Integrity of Nanoparticles for Advanced in Situ Tracking in Bionanotechnology. ACS Nano 2016, 10, 4660−4671.
(43) Soenen, S. J.; Manshian, B.; Doak, S. H.; De Smedt, S. C.; Braeckmans, K. Fluorescent Non-Porous Silica Nanoparticles for Long-Term Cell Monitoring: Cytotoxicity and Particle Functionality. Acta Biomater. 2013, 9, 9183−9193.
(44) Bae, Y. M.; Park, Y., II; Nam, S. H.; Kim, J. H.; Lee, K.; Kim, H. M.; Yoo, B.; Choi, J. S.; Lee, K. T.; Hyeon, T.; Suh, Y. D. Endocytosis, Intracellular Transport, and Exocytosis of Lanthanide-Doped Upcon-verting Nanoparticles in Single Living Cells. Biomaterials 2012, 33, 9080−9086.
(45) Bartczak, D.; Nitti, S.; Millar, T. M.; Kanaras, A. G. Exocytosis of Peptide Functionalized Gold Nanoparticles in Endothelial Cells. Nanoscale 2012, 4, 4470.
(46) Chu, Z.; Huang, Y.; Tao, Q.; Li, Q. Cellular Uptake, Evolution, and Excretion of Silica Nanoparticles in Human Cells. Nanoscale 2011, 3, 3291.
(47) Dombu, C. Y.; Kroubi, M.; Zibouche, R.; Matran, R.; Betbeder, D. Characterization of Endocytosis and Exocytosis of Cationic Nanoparticles in Airway Epithelium Cells. Nanotechnology 2010, 21, 355102.
(48) Fiorentino, I.; Gualtieri, R.; Barbato, V.; Mollo, V.; Braun, S.; Angrisani, A.; Turano, M.; Furia, M.; Netti, P. A.; Guarnieri, D.; Fusco, S.; Talevi, R. Energy Independent Uptake and Release of Polystyrene Nanoparticles in Primary Mammalian Cell Cultures. Exp. Cell Res. 2015, 330, 240−247.
(49) Gunduz, N.; Ceylan, H.; Guler, M. O.; Tekinay, A. B. Intracellular Accumulation of Gold Nanoparticles Leads to Inhibition of Macropinocytosis to Reduce the Endoplasmic Reticulum Stress. Sci. Rep. 2017, 7, 40493.
(50) Jiang, X.; Röcker, C.; Hafner, M.; Brandholt, S.; Dörlich, R. M.; Nienhaus, G. U.; Rocker, C.; Dorlich, R. M.; Röcker, C.; Dörlich, R. M.; Hafner, M.; Brandholt, S.; Dörlich, R. M.; Nienhaus, G. U. Endo- and Exocytosis of Zwitterionic Quantum Dot Nanoparticles by Live HeLa Cells. ACS Nano 2010, 4, 6787−6797.
(51) Jin, H.; Heller, D. a; Sharma, R.; Strano, M. S. Size-Dependent Cellular Uptake and Expulsion of Single-Walled Carbon Nanotubes: Single Particle Tracking and a Generic Uptake Model for Nano-particles. ACS Nano 2009, 3, 149−158.
(52) Slowing, I. I.; Vivero-Escoto, J. L.; Zhao, Y.; Kandel, K.; Peeraphatdit, C.; Trewyn, B. G.; Lin, V. S. Y. Exocytosis of Mesoporous Silica Nanoparticles from Mammalian Cells: From Asymmetric Cell-to-Cell Transfer to Protein Harvesting. Small 2011, 7, 1526−1532.
(53) Strobel, C.; Oehring, H.; Herrmann, R.; Förster, M.; Reller, A.; Hilger, I. Fate of Cerium Dioxide Nanoparticles in Endothelial Cells: Exocytosis. J. Nanopart. Res. 2015, 17, 206.
(54) Oh, Y. K.; Swanson, J. A. Different Fates of Phagocytosed Particles after Delivery into Macrophage Lysosomes. J. Cell Biol. 1996, 132, 585−593.
(55) de Chastellier, C.; Thilo, L. Phagosome Maturation and Fusion with Lysosomes in Relation to Surface Property and Size of the Phagocytic Particle. Eur. J. Cell Biol. 1997, 74, 49−62.
(56) Wang, Y.; Wu, Q.; Sui, K.; Chen, X.-X.; Fang, J.; Hu, X.; Wu, M.; Liu, Y. A Quantitative Study of Exocytosis of Titanium Dioxide Nanoparticles from Neural Stem Cells. Nanoscale 2013, 5, 4737.
(57) Hmama, Z. Quantitative Analysis of Phagolysosome Fusion in Intact Cells: Inhibition by Mycobacterial Lipoarabinomannan and Rescue by an 1, 25-Dihydroxyvitamin D3-Phosphoinositide 3-Kinase Pathway. J. Cell Sci. 2004, 117, 2131−2140.
(58) Kuhn, D. A.; Vanhecke, D.; Michen, B.; Blank, F.; Gehr, P.; Petri-Fink, A.; Rothen-Rutishauser, B. Different Endocytotic Uptake Mechanisms for Nanoparticles in Epithelial Cells and Macrophages. Beilstein J. Nanotechnol. 2014, 5, 1625−1636.
(59) Day, G. A.; Hoover, M. D.; Stefaniak, A. B.; Dickerson, R. M.; Peterson, E. J.; Esmen, N. A.; Scripsick, R. C. Bioavailability of Beryllium Oxide Particles: An in Vitro Study in the Murine J774A.1 Macrophage Cell Line Model. Exp. Lung Res. 2005, 31, 341−360.
(60) Schwiertz, J.; Wiehe, A.; Gräfe, S.; Gitter, B.; Epple, M. Calcium Phosphate Nanoparticles as Efficient Carriers for Photodynamic Therapy against Cells and Bacteria. Biomaterials 2009, 30, 3324−3331. (61) Asem, H.; Zhao, Y.; Ye, F.; Barrefelt, Å.; Abedi-Valugerdi, M.; El-Sayed, R.; El-Serafi, I.; Abu-Salah, K. M.; Hamm, J.; Muhammed, M.; Hassan, M. Biodistribution of Biodegradable Polymeric Nano-Carriers Loaded with Busulphan and Designed for Multimodal Imaging. J. Nanobiotechnology 2016, 14, 82.