HAL Id: hal-01252291
https://hal.archives-ouvertes.fr/hal-01252291
Submitted on 7 Jan 2016HAL is a multi-disciplinary open access archive for the deposit and dissemination of sci-entific research documents, whether they are pub-lished or not. The documents may come from teaching and research institutions in France or abroad, or from public or private research centers.
L’archive ouverte pluridisciplinaire HAL, est destinée au dépôt et à la diffusion de documents scientifiques de niveau recherche, publiés ou non, émanant des établissements d’enseignement et de recherche français ou étrangers, des laboratoires publics ou privés.
delivery activities, the example of Low Emission Zones
in Europe
Laetitia Dablanc, Antoine Montenon
To cite this version:
Laetitia Dablanc, Antoine Montenon. Impacts of environmental access restrictions on freight delivery activities, the example of Low Emission Zones in Europe. Transportation Research Record, SAGE Journal, 2015, pp 12-18. �10.3141/2478-02�. �hal-01252291�
Impacts of environmental access restrictions on freight delivery
activities - The example of Low Emission Zones in Europe
Laetitia Dablanc, corresponding author
IFSTTAR/AME, University of Paris-Est
14-20 bvd. Newton - Cite Descartes - Champs-sur-Marne, 77447 Marne la Vallee cedex 2, France
Tel: +33 1 81 66 87 78; Email: laetitia.dablanc@ifsttar.fr
Antoine Montenon
IFSTTAR/AME, University of Paris-Est
14-20 bvd. Newton - Cite Descartes - Champs-sur-Marne, 77447 Marne la Vallee cedex 2, France
Tel: +33 1 81 66 89 20; Email: antoine.montenon@ifsttar.fr
Word count: 6678 words text + 3 figures x 250 each = 7428 words
TRR Paper number: 15-….
ABSTRACT
The aim of this paper is to identify the position of goods vehicles in European Low Emission Zones and to analyze the impact of the access restrictions on transport and logistics firms and on their logistics activities. Low Emission Zones (LEZ) are delimited areas of a city or metropolitan area from which the vehicles that pollute the most are banned. Targeted vehicles are often freight vehicles as a result of the high levels of pollution emitted by today’s urban delivery fleets. Through literature review, interviews and two specific surveys in London and Berlin, we analyzed LEZ impacts on the urban freight industry. We showed that the creation of a LEZ reduces the number of firms making urban deliveries, and that this reduction has probably benefited the urban freight market by compelling both public and private stakeholders to finds ways to promote more efficient activities. Such modernization is necessary as the urban freight market is dysfunctional in many respects: environmentally because of the old vehicles used until now, and socially because of the large number of small firms which find it difficult to maintain a sufficient level of business activity without breaking the sector’s labor laws and safety standards.
INTRODUCTION, GOALS AND METHOD
European environmental programs encourage or impose measures that reduce air pollution. Air quality standards have been established which compel national governments and urban areas to implement measures to reduce pollutants emitted by traffic. An increasing number of European cities are introducing regulations that encourage clean vehicles. This involves the introduction of new criteria, which are more focused on protecting the environment than improving safety or mitigating congestion. A number of European cities have thus created Low Emission Zones (LEZ), from which the vehicles that pollute the most are banned. They frequently consist of goods vehicles as a result of the high levels of pollution emitted by today’s urban delivery vehicles fleets.
The aim of this paper is to identify the position of goods vehicles in European Low Emission Zones and to analyze the impact of access restrictions on transport and logistics firms and on their logistical activities. Our starting hypothesis was that creating an LEZ will disrupt the market on which urban delivery carriers operate. We specified three potential levels of impacts, as described in Section 3. To test our hypotheses, we began by studying European LEZs through the scientific and technical literature. We then performed a series of interviews and field visits (see description in Section 3) in two European cities which introduced an LEZ several years ago, in order to conduct an ex post appraisal of freight transport companies’ reactions. The two cities are London and Berlin. We have also elicited the aid of carriers’ organizations in order to distribute a questionnaire among their member transport firms. These surveys and interviews (described in Section 3) were conducted jointly with local universities and professional bodies from the transport and logistics sectors: the University of Westminster, Transport for London, Central London Freight Quality Partnership, FTA, RHA, DLR, BdKEP, BGL, Senat Berlin. This research is the culmination of the first phase of the RETMIF (Reduction of Emissions from Freight Transport in the Greater Paris Region) project, which is funded by the French
Environment Agency (ADEME, AACT-AIR program). A second phase of RETMIF, which started at the end of 2014, is testing the impact of several LEZ scenarios and appraising their potential effectiveness with regard to the socio-economic response of transport operators. We do this for Paris, which is one of the few urban areas in Europe which has not yet restricted access to polluting vehicles, in spite of the city’s mediocre ambient air quality.
This paper is structured as follows: Section 1 identifies the air quality problems that exist in European cities and how road freight transport contributes to them. In Section 2, we present the European Low Emission Zones and the position freight vehicles have in them. In Section 3, we present the results of our analyses with regard to socio-economic impacts of LEZs.
SECTION 1. AIR QUALITY IN EUROPE AND THE CONTRIBUTION OF ROAD FREIGHT TRANSPORT
Current European goals (Directive 2008/50/EC) with regard to concentration thresholds for atmospheric pollutants are not being reached. For example, in 2012, the mean concentration limits laid down for NO2 were exceeded in95% of the surface area of Paris (1). In 2014, the
European Commission launched legal proceedings against the United Kingdom because of its excessive NO2 emissions. The fine could amount to €365 million.
Road transport (freight and passenger) is one of the main sources of pollutant emissions. Freight transport in particular is recognized as a major contributor to emissions of ozone, fine
produced 47% of all NOx emissions in Europe (3; 4). As far as particulates are concerned, road
transport is responsible for 14% of all such emissions Europe-wide. Pollution from road transport has risen also as a result of the continual increase in the proportion of diesel vehicles in the fleet. Diesel engines generate between 4 and 10 times more NOx emissions than gasoline vehicles of
equivalent power and weight (5). Even recent diesel vehicles emit NOx (mostly NO2), also
because of the use of filters to combat other types of pollution.
Increase in pollution has been particularly acute in urban areas, particularly because of the growth of delivery activities in cities (6). Urban freight transport is one of the principal sources of urban pollution. It has been calculated that in French cities it accounts for 35% of the NOx and
40 to 50% of the PM10 emitted by urban transport as a whole (7), while goods vehicles are
responsible for only 15 to 20% of all vehicle-kilometers. In London, in 2010, goods transport was responsible for 38% of NOx emissions from road transport (27% from HGVs, 11% from LGVs) and 37% of PM10 (14% HGVs, 23% LGVs) (8). One intrinsic reason for this poor
environmental performance is the stop-and-start way vehicles are driven. Five stops over a distance of 10 km increase fuel consumption by 140% (9). The pollution caused by urban freight transport is made even worse by the fact that, on average, urban goods vehicles are older than private cars. An HGV sold in 2014 (Euro VI standard1) satisfies maximum NOx pollution criteria
that are 20 times lower than one sold in 1994 (Euro I standard), and the criterion for PM10
emissions is 40 times lower. Furthermore, it has been observed that in the case of France the larger the city, the older the delivery fleet, as a result of the structure (see below) of the urban delivery market in major cities (10). In 2011, the Paris city authorities carried out a survey by examining the number plates of 3,200 HGVs and 13,000 vans: 11% of the vans and 20% of the HGVs in the dense urban zone did not meet the Euro 3 standard.
Old vehicles are used by the very large number of small independent carriers which operate in major cities, frequently as subcontractors and with very small financial margins. In the dense part of the Paris metropolitan area, there are estimated to be 12,000 light haulage companies (using vehicles with a gross weight of 3.5 tons or less), a significant proportion of which are operating illegally (doing undeclared work or not registered in the transport registry). The supply of subcontractors is regularly replenished due to the low entry barriers that apply to the road transport market for operators using light vehicles. In addition, more than 15% of urban deliveries are made by the consignee on its own account (this applies particularly to small shopkeepers), who often use very old vans for this purpose (11). Small transport and logistics operators and shopkeepers cannot easily afford to update their vehicle fleet.
In recent years, one policy solution to urban freight impacts has been the implementation of Low Emission Zones.
SECTION 2. A TOOL TO REDUCE URBAN POLLUTION: LOW EMISSION ZONES (LEZ)
1The Euro standards correspond to a limit of pollution emitted by category of vehicle, calculated through a driving
cycle defined by the EU. Euro 0 was introduced in 1990, Euro I in 1993, Euro II in 1996, Euro III in 2001, Euro IV in 2006, Euro V in 2009 and Euro VI in 2014. The following convention generally applies: standards for light vehicles use Arabic numerals (1, 2, 3…) while standards for heavy vehicles use Roman numerals (I, II, III…). When a standard applies to both types of vehicles, we use Arabic numerals in this article.
Only vehicles that meet specified pollution standards are allowed to enter Low Emission Zones. These are “geographically limited zones that cover more than a very local area where there are problems from the point of view of atmospheric pollution, noise, the quality of urban life, traffic congestion and/or safety and in which specific restrictions are applied with regard to the volume and/or the nature of traffic in the zone” (12).
The types of vehicles and the associated emissions criteria are laid down by the local, regional and/or national authorities. As of March 2014, on the basis of different websites (see in
References), documents and further research, we identified 197 LEZs in the European Union, in 10 different countries. Simple LEZs (LEZs without a toll – see below) account for 106 of these, and 91 are tolled LEZs (only three of which are outside Italy).
The main European LEZs
Figure 1 shows the locations of Europe’s LEZs (as in March 2014) distinguishing between cities where restrictions based on vehicle pollution are applied (“simple” LEZs), cities where traffic is regulated by an urban toll which increases according to the level of pollution (LEZ with toll), and cities with LEZs that are not enforced or not strictly enforced.
On this basis we can divide European countries into three main groups: Germany, Italy, the Netherlands and Sweden, where many cities have set up LEZs, and where such zones have strong national backing; a group of countries where only the main cities have an LEZ, generally as the result of a local initiative. This is the case in Europe’s best-known LEZ, the London Low Emission Zone. Finally, there is a group of countries that have no LEZs or whose LEZs have a limited impact because of low compliance with regulations: this group essentially consists of France, most Eastern European countries and, to a lesser extent, Spain. In Madrid, the
municipality has created a zona de bajas emisiones (literally a low emission zone) in the central area. This zone does not restrict vehicular traffic, but varies the price of parking according to the age of the vehicle and its fuel. Electric and hybrid vehicles have a 20% reduction, and Euro 6 diesel vehicles and Euro 4 gasoline vehicles have a reduction of 10%.
The size of Europe’s LEZs varies from 0.6 km² (Lisbon) to 5,700 km² (the region of Styria in Austria). Very often this size is closely linked to the type of local or regional authority
responsible for the zone and corresponds to an administrative division or a functional area (for example, that enclosed by a ring of railway lines in Berlin). The surface area has a direct impact on the cost of the measure and its environmental, social and economic impacts. For example, it is more cost-effective to equip a large zone with enforcement cameras than a smaller one. With regard to environmental and traffic issues, residents and transport operators will have a greater tendency to avoid a small zone than a very large one. London’s Low Emission Zone is the second largest in Europe, covering almost 1,580 km².
Italy and Germany have the highest number of LEZs (see Germany below). In Italy, the primary aim of a zona a traffico limitato (ZTL) is to reduce traffic and congestion rather than improve air quality or reduce noise. Most cities with a zone of this type started by setting up what amounted to an urban toll in their central district. Increasing air quality problems, particularly in winter, let them to introduce Low Emission Zones. A consequence of this specific situation is that Italy’s LEZs are very diverse, even within a given city. For example, of the 10 or so ZTLs in central Rome, some require payments and others impose night-time restrictions on certain types of vehicle, and zonal boundaries may vary according to the time of day and day of the week. This diversity also leads to overlaps and a number of derogations which is unsurpassed in Europe. In
the former A1 zone in Lombardy, 22 types of derogation are possible, not counting the different exemptions applied by different cities. In contrast, no exemption is possible in the Netherlands. At the present time, two main modes of enforcement are used for LEZs in Europe: video cameras which read number plates, and visual surveillance with the use of stickers. The means of
enforcement has an impact on the rate of compliance. When the city of Amsterdam put in place a system of surveillance cameras for its Milieuzone in 2009, the compliance rate rose from 66% in 2008 to 97% in 2010 (13). In Germany, the principle of privacy restricts the use of cameras. In contrast, in the U.K., Transport for London was given access to the national vehicle registration database.
London and Berlin LEZs
When it was created, the main idea behind the London LEZ was to achieve a marked decrease in pollution from road traffic in the region without imposing a high economic cost (14).
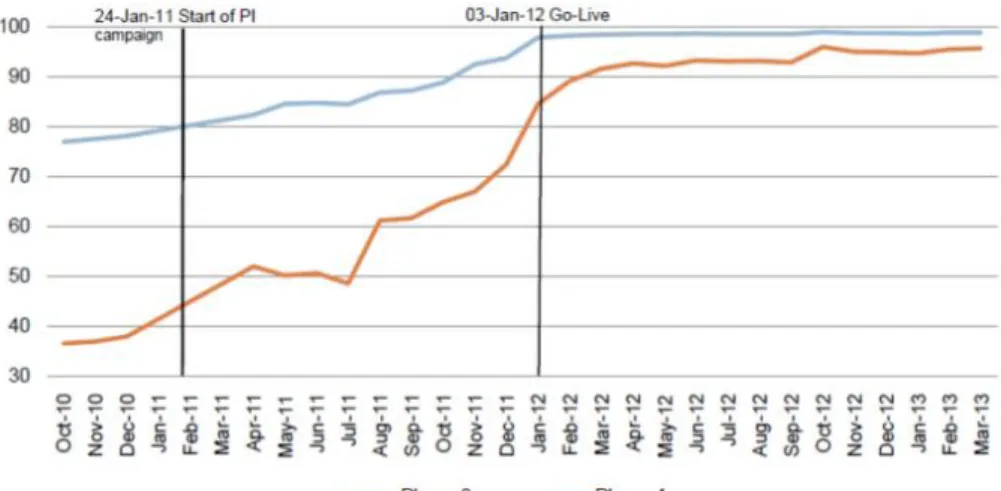
Implementation took place in four phases: in 2008 it applied to diesel vehicles weighing over 12 tons. Six months later, all vehicles with a GTW of over 3.5 tons had to comply with the Euro III PM standard. In 2012, vans with an unladen weight of over 1,205 kg had to comply with the Euro 3 PM standard while the standard for HGVs was raised to Euro IV PM. What marks out the London LEZ, apart from its size and its inclusion of light goods vehicles, is its massive use of automated plate-reading. Owners of non-permitted vehicles are asked to pay a charge of £100 or £200 per day to enter the zone. If they do not comply, fines range from £250 to £1000 per day. Compliance rates with the standard by the targeted vehicles when phases three and four were implemented were 97% and 85% respectively, as shown in Figure 2. Phase 4 compliance rose quickly between the end of 2010 and the beginning of phase 4.
Germany has the second largest number of zones in Europe, with 76 Umweltzonen. To enter the zones every vehicle, irrespective of its weight and even if it is foreign, must have a sticker (“Plakette”), which is issued on the basis of its registration certificate and which represents a pollution standard by a color. Three colors are available: red, orange and green, according to the corresponding Euro PM standard. Vehicles can be retrofitted with devices to reduce particulate emissions. Thus, the green sticker corresponds, as a minimum, to a Euro 1 PM gasoline vehicle, a Euro 4 PM diesel vehicle or a retrofitted Euro 3 PM diesel vehicle. Each city or state selects which pollution limit standard will apply. By the end of 2013, most local and regional
governments had chosen the green sticker (source: Federal Environment Ministry website). In the Berlin Umweltzone, there were quite a large number of exemptions, granted on a case-by-case basis. One is interesting, and to our knowledge unique in Europe, namely vehicles belonging to a firm “whose survival is threatened by the scale of the investment required” (source: City of Berlin derogation request form). There is a charge for exemptions (for example, a total of €431.20 will be due for a 7.5 ton vehicle seeking a nine-month derogation). As of January 2015, no more exemptions are provided.
Euro standards and the position of goods vehicles in LEZs
All of Europe’s LEZs target heavy vehicles and only two (Norwich and Oxford in the U.K.) do not target freight vehicles but just buses. Of the 197 LEZs we have identified, 26 (12%) are only concerned with goods vehicles. Of these 26, only the London LEZ takes account of light goods vehicles. The importance of freight vehicles in LEZs regulations can be explained by their significant share in urban pollution (see Section 1).
In the 197 LEZs we have identified, the Euro 4 PM standard is used in most cases to impose access restrictions on goods vehicles. This is the case, for example in most German cities, several Italian cities (where some limits are even based on Euro 5), Copenhagen and London. In London, HGVs must follow the Euro IV PM standard and large vans the Euro 3 PM standard. Others, such as Amsterdam or Prague, require compliance with all parts of Euro IV, not only for PM. Another group of cities makes do with Euro 3, for example many Italian LEZs and those in Norwich and Stockholm (but in the latter case, the age limit for vehicles is six years). Finally, one group of “laxer” cities merely prohibits very old HGVs: in the case of Athens (in the entire metropolitan area) vehicles must be less than 13 years old, though a much stricter regulation applies in the city center for vehicles wishing to escape the alternate driving day system. Most small Italian cities have chosen the Euro 2 standard, and Lisbon applies Euro 1.
SECTION 3. SOCIO-ECONOMIC IMPACTS OF LOW EMISSION ZONES ON FREIGHT TRANSPORT
In the specific socio-economic context in which urban freight transport operates, which we have described in Section 1, the introduction of access restrictions based on the age of delivery vehicles may have major impacts. We identified three theoretical levels of impacts. At the macroeconomic level, the total number of delivery firms, the average number of employees and vehicles per delivery firm may change following the introduction of an LEZ. At the
microeconomic level, firms may leave the market or relocate due to additional costs, or change their fleet and operate their activities more efficiently to offset new costs. Finally, on a more transversal level, more radical changes may be introduced towards innovative city logistics. Despite these potential impacts, and with the exception of two studies on the case of Milan (15) and a brief study on Dutch environmental zones (16), no ex post analysis has been conducted of the socio-economic impacts on small road transport operators making urban deliveries in the European cities that have introduced such measures. The literature is more concerned with the environmental impacts of LEZs (13; 17; 18). Börjesson et al. (19) were mostly interested in the effects of the Stockholm urban toll on passenger traffic. They nevertheless mentioned a 15% reduction in all commercial traffic (freight and business trips). Browne et al. (20) evaluated, but only on an ex ante basis, the foreseeable effect on the transport industry of the London LEZ. The operators they questioned were moderately in favor of the introduction of the environmental zone, or at least resigned to the idea. Although an evaluation and feedback mechanism was provided together with the LEZ implementation process, little in the way of findings concerning the economic benefits have been made public by Transport for London. With regard to
environmental aspects, analysis was only performed just after the implementation of phase 1. The authorities are fairly silent on this topic at present, except for the health benefits of the measure (21).
Our own surveys in London and Berlin took us to conduct 30 interviews (15 in London, 15 in Berlin) including freight organizations (one third of interviews), freight companies (one third) and local decision-makers (one third). We have also elicited the aid of carriers’ organizations in order to distribute a questionnaire among their member transport firms, and we were able to process only five completed questionnaires, as the surveys did not generate much interest from local freight operators.
The results of our and other studies presented below will relate to the three levels of impacts of a LEZ identified in our hypotheses: the overall impact (at the city level) on the freight market; changes in microeconomic behaviors; more general progress towards clean urban logistics.
Overall economic impact
One of the few ex post economic impact evaluations has been conducted for Milan (15). Milan introduced an urban toll in 2008, in which the charges varied according to Euro standards. The system went under the name of Ecopass until it was replaced in 2012 by a simpler one. Ecopass had a complex system of charges. For HGVs, all Euro IV and Euro V vehicles were exempt from payment, and older vehicles paid between 2 and 10 Euros per day. According to the authors, Ecopass achieved substantial results in the studied period (2008 to 2010). There were 13,040 freight vehicles per day in the zone prior to the introduction of the system, and 9,521 after. This means that firms and residents in central Milan continued to receive supplies with 27% fewer vehicles. The number of freight vehicles using alternative fuels, or zero emission vehicles, that drive through the zone has increased from 92 to 1089 during the same period. The authors assigned financial values to the costs and benefits of Ecopass. They found that the freight sector had saved €1.3 million as a result of reduced journey times and improvements in reliability, but lost €10.8 million in tolls and investment in new vehicles, i.e. a net loss of €9.5 million, which was the highest of all the stakeholder categories considered. Freight operators were the greatest losers as a result of the system and the city authorities the principal winners, in particular due to new sources of revenue (from fines rather than from tolls).
In London there was a very marked reduction in the number of commercial vehicle-kilometers between 2007 and 2011. LGV traffic decreased by 12% between these two dates (8). There has been a decrease by 8% in the number of small workplaces (0-9 employees) in the field
"Transportation and Storage" in Greater London between 2008 and 2011 (Office for National Statistics). It is difficult to establish a clear link between this reduction and the creation of the Low Emission Zone, all the more so that the economic downturn hit the United Kingdom at the end of 2008. Between 2007 and 2011, there was a 15% drop in the number of freight licenses in the United Kingdom as a whole (23). Based on the interviews we conducted, we can nevertheless say that the LEZ helped the logistics sector to speed up investment in more recent vehicles and more efficient fleets in the years prior to 2008 (first phase of the LEZ) and prior to 2012 (second phase). Firms like UPS explained to us that they increased their turnover as a result of the
creation of the Low Emission Zone because it prompted them to reorganize their activities which allowed them to reduce their management costs and improve the efficiency of their freight flows. The impact was greater in the case of small transport operators and companies using own
account transport. The Freight Transport Association and TfL think that some of these
companies must have been forced to go out of business or relocate, but fewer than was forecast. This remark nevertheless needs to be specified. Few figures are available for the smallest firms allowing us to quantify and specify the changes they have experienced. Our interviews with freight organizations and companies confirmed difficulties for small operators.
The debate in London today is centered around the Ultra Low Emission Zone which is planned for 2020, and intended to ban all diesel vehicles (including private vehicles) which do not meet the Euro 6 standard in the zone currently covered by the city’s Congestion Charging Zone (24). Berlin’s transport and warehousing sector consisted of approximately 4,800 firms in 2008, and this number fell to 4,500 in 2011 (25). These firms provided approximately 80,000 jobs in 2008
and 65,000 in 2011 (26; 27). In the case of the State of Brandenburg (which surrounds the city-state of Berlin), the number of firms was respectively 4,200 (in 2008) and 3,900 (in 2011). Therefore, as in London, the period (which starts with the implementation of the LEZ in 2008) saw a significant reduction in the number of firms and jobs in the sector.
Figure 3 (28) shows how vehicle fleets have changed. It shows that, as in London,
implementation of the zone speeded up replacement of vehicles, in particular in the case of goods vehicles. The impact on firms has been lower than in London, because of the more limited size of the zone and of the high number of exemptions (as an example, a company with multiple vehicles is allowed to have only one complying with the LEZ, the other ones being given an exemption for a year). As the zone in question is small and the economic crisis struck Berlin shortly after the zone was put in place, it is difficult to quantify company closures and/or relocations. This specific research will be carried out in phase 2 of the RETMIF project.
Changes in the behavior of firms
The first thing to note is that in countries where the LEZ was implemented solely for goods vehicles or heavy vehicles and not private cars, transport companies could have felt they had been treated unfairly, as private vehicles are responsible for as much or more of the total amount of pollution. However, our interviews showed that this was only a minor problem. Broadly, transport operators and companies that use heavy vehicles accept the LEZs. This acceptance was easy to obtain in London because the Low Emission Zone was the subject of a particularly sophisticated awareness and public relations campaign. Firms were warned about the system a long time in advance (about seven years) which meant it was better received because they were able to prepare for it in advance.
As a general rule, freight transport companies have adapted to the new regulations, at least those with an effective enforcement system. This may seem quite natural, but it is in fact quite
remarkable in view of the severe fragility of the urban goods transport sector, as described in Section 1. We have already noted the high level of compliance with the standard in London and Berlin, and very old goods vehicles have virtually disappeared from these cities, and with them a certain way of doing business for urban delivery activities (Figures 2 and 3).
However, it is important to note that it is difficult to assess the levels of company closures that have ensued following the introduction of an LEZ. In the cities that we have studied in detail (London and Berlin) this level seems to be low, but city officials and the professional bodies representing transport companies admit that the disappearance of many small firms may have gone unnoticed as few of them belong to business groups, and some of them have no legal existence and were therefore not known to the authorities. In addition, the specific difficulties that affect specialized firms should be noted. The vehicles used for the construction industry require a greater investment and are replaced less frequently than other vehicles. To overcome this problem, some zones such as London or Berlin have made special limited-time exemptions, sometimes on an ad hoc basis. However, derogations of this type do not exist in all zones, vary a great deal from place to place, and do not always relate to the same vehicles.
As well as adapting to the new regulations, firms have implemented a number of accompanying or avoidance strategies. It emerged from our interviews and surveys that the first direct impact on firms was the transfer of vehicles out of the zone where restrictions operate. In the period
immediately preceding the introduction of the LEZ, firms that thought the investment was too great relocated some or all of their most recent vehicles, using their oldest vehicles outside the
zone. This practice was very common in London. Large firms such as TNT Express or DHL have a large fleet of vehicles spread over a large number of sites in the United Kingdom. The policy of these firms is to replace their vehicles every six to eight years, so replacement focused on the vehicles that operated in Greater London. At the same time, these firms are much more worried about the Ultra Low Emission Zone planned for 2020, as they will only be given five years’ notice, which means they will have to review their investment policy.
With regard to small and medium-sized firms, our interviews revealed a change of a different type – the reorganization of routes. The firms in question lack both the financial reserves and the capacity to modify their activity sufficiently to completely replace their fleet, unless the use of recent vehicles gives them a competitive advantage. This has been observed in both the London and Berlin cases. Some firms admit that the creation of an LEZ benefited them as it forced them to improve their efficiency and optimize their vehicle routing, in particular by using specialized softwares. In Berlin, firms were only given 2½ years’ warning of the change and some had to use vehicle rental companies to be able to use recent vehicles rapidly.
Two changes which are less widespread than those mentioned above have also taken place. The first is the sharing of resources between firms. In cases where the investment proved to be too great for the firm to survive, which occurred most frequently for small and medium-sized firms and very small firms, the possibility of sharing vehicles and resources between several partners was seen to present a number of benefits. In some cases this might lead to a merger between companies. For example, after the introduction of the London Congestion Charging Zone and the announcement of the LEZ, Wiles (an office supplies delivery company) decided to merge with another company focusing on environmental consulting, Greenworld, in 2006. The idea was to obtain a competitive advantage (see below) and a greener image. Wiles Greenworld now has 50 employees and is a gold member of the Fleet Operator Recognition Scheme (FORS) which was introduced by TfL to reward environmentally-friendly delivery companies.
Second, the development of new logistics hubs around a LEZ zone was mentioned in the
interviews. In Berlin actually, the location of the major logistics hubs has directly influenced the boundary limits of the LEZ, in order to avoid a necessary relocation of these centers. Urban freight terminals around the zone can be used as transfer points from polluting vehicles to clean ones in order to make final deliveries. Such changes can encourage innovative city logistics activities that use electric delivery vehicles. In this context, some large firms (whose names we are not at liberty to disclose) are currently involved in projects to massively increase the size of their electric vehicle fleet in the London Ultra Low Emission Zone and set up dedicated freight hubs in view of the standard that will apply in the zone and thereby gain a competitive advantage for last mile logistics. In Berlin, operators are more inclined towards natural gas and biogas because of the larger size, in average, of freight vehicles (7.5 to 12 ton trucks where vans are used in London).
Modernization of the sector
We would like to draw attention to one other impact that emerged from our investigations. It is less clearly apparent than the others, but it may ultimately prove to be important. This is the impetus provided by the creation of an LEZ, and possibly by accompanying measures when there are any, to the modernization of the freight transport sector and urban logistics. The fact that the creation of an LEZ may provide a means of boosting investment in the transport and logistics sector thereby stimulating its development and above all its modernization was
mentioned several times to us, in particular by the public authorities. An LEZ creates a
competitive advantage for firms that are already committed to “good practices.” The creation of an LEZ or other similar environmental measures provides companies whose policies include pollution reduction with an immediate competitive advantage over “conventional” firms that need to improve their vehicle fleet.
An LEZ may stimulate the market for clean delivery vehicles. To meet new regulations, some transport operators may decide to purchase very clean vehicles (and not just ones that pollute less), for example electric vehicles or vehicles that use natural gas. The use of biogas has already developed in Berlin, especially for public services (waste pick-up). The introduction of the new Euro 6 standard in some LEZs (i.e. London) may increase the market for more recent, more expensive, technologies, as the price difference between internal combustion engines and vehicles such as electric vehicles will be reduced. As the Euro VI standard, which came into force for the manufacturing of heavy vehicles on January 2014, is not yet enforced in existing LEZs, and as the availability of electric delivery vehicles is still unreliable (and for heavy goods vehicles still at the development phase), our experience is currently inadequate to allow us to reach a conclusion on this point.
CONCLUSION
In this paper we have shown that the Low Emission Zones that have been created in recent years in a considerable number of European cities are particularly associated with freight transport: all of them restrict HGV access, and many LEZs target HGVs exclusively. The most emblematic of Europe’s LEZs, that in London, not only targets HGVs, but LGVs too.
It is easy to justify targeting goods vehicles because they cause a large proportion of the traffic based pollutant emissions which are partly to blame for the poor air quality of many European cities. It is, however, surprising that when they introduced their access restriction policies few cities wondered what impact they would have on the urban freight transport system. Few studies have been carried out by the scientific community, business organizations, or public authorities, even though the reaction of transport and logistics operators to a ban on old vehicles could potentially have a major impact on the organization of urban freight transport.
We have attempted to identify such behaviors by taking the example of cities that have put in place strict LEZs. Some of our conclusions are provisional, as our research is still ongoing, but they strike us as sufficiently firm to be presented here. The statistical data that we have examined show first of all that there has been a reduction in the number of transport and logistics firms operating in the cities with an LEZ. This reduction ranges from 15 to 30% depending on the city. It is difficult to establish a direct causal link between the creation of an LEZ and the reduction in the number of delivery firms and this part of the study requires further work, e.g. an analysis of data on companies in other cities in the same country which did not implement an LEZ or a more detailed analysis of the long-term trends in the number of companies which will show whether or not they were changed by the introduction of an LEZ.
Our studies show that those firms that are still operating on markets affected by an LEZ have adapted to the new rules. Many have implemented a process of adjustment and reorganization that has optimized their urban activities.
The conclusion we have reached is as follows. In the two cities we have looked at, London and Berlin, it is apparent that the creation of a Low Emission Zone reduces the number of transport
firms making urban deliveries. Our investigation leads us to believe that this reduction has benefited the urban freight transport market by compelling stakeholders to find ways to promote more efficient activities. Such modernization is necessary as the market is dysfunctional in many respects: environmentally because of the old vehicles used until now, and socially because of the large number of small firms which find it difficult to maintain a sufficient level of business activity without breaking the sector’s labor laws and safety standards. Structural measures such as Low Emission Zones provide a sound basis for the long-awaited reorganization of the sector which has rarely been undertaken hitherto.
ACKNOWLEDGEMENT
This article presents the results of phase 1 of RETMIF, a research project carried out for the French Agency for the Environment (ADEME). RETMIF benefitted from a grant from
ADEME’s AACT/AIR program. We also acknolewdge the Metrofreight Center of Excellence on urban freight, financed by the Volvo Research and Educational Foundations (VREF).
REFERENCES
1. Evolution de la qualité de l'air à Paris entre 2002 et 2012. AIRPARIF. Jul. 2013 2. Air Quality Guidelines Global Update 2005. World Health Organization, Copenhagen,
Denmark, 2005.
3. Air quality in Europe - 2013 report. European Environment Agency, 2013
4. Serveau, L. Inventaire des émissions de polluants atmosphériques et de gaz à effet de
serre en France - Séries sectorielles et analyses étendues. CITEPA, Apr. 2013.
5. Colvile, R. N., E. J. Hutchinson, J. S. Mindell, and R. F. Warren. The transport sector as a source of air pollution. Atmospheric Environment, Vol. 35, 2001, pp. 1537-1565.
6. Dablanc L. Goods Transport in Large European Cities: Difficult to Organize, Difficult to Modernize, Transportation Research Part A, Vol. 41, 2007, pp. 280–285.
7. Albergel, A., E. Ségalou, J.-L. Routhier, and C. De Rham. Méthodologie pour un bilan
environnemental physique du transport de marchandises en ville, ADEME/Ministère des
Transports, 2006.
8. Allen, J., M. Browne, and A. Woodburn. London Freight Data report 2013 update. Transport for London, 2013.
9. Martensson, L. Volvo’s environmental strategy for next generation trucks. Presented at the Bestufs conference, Amsterdam, Netherlands, 2005.
10. Dablanc, L. Urban Goods Movement and Air Quality, Policy and Regulation Issues in European Cities, Journal of Environmental Law, Vol. 20, No. 2, 2008, pp. 245-266. 11. Routhier, J.-L.. Paris urban freight survey - First results. Presented at Metrofreight Day.
Transport Research Arena, Paris La Defense, France, April 17, 2014.
12. Report from the Working Group on Environmental Zones - Exploring the issue of
environmentally-related road traffic restrictions. Joint Expert Group on Transport and
Environment, Brussels, Belgium, 2005.
13. Boogaard, H., N. Janssen, P. Fischer, G. Kos, E. Weijers, F. Cassée, S. Van der Zee, J. Hartog, K. Meliefste, M. Wang, B. Brunekreef, and G. Hoek. Impact of low emission zones and local traffic policies on ambient air pollution concentrations. Science of the total
14. Watkiss, P., J. Allen, S. Anderson, S. Beevers, M. Browne, D. Carslaw, P. Emerson, P. Fairclough, J. Francsics, D. Freeman, H. Haydock, S. Hidri, G. Hitchcock, T. Parker, S. Pye, A. Smith, R. Ye, and T. Young. London Low Emission Zone Feasibility Study. Phase
II. Final Report to the London Low Emission Zone Steering Group. AEA Technology
Environment and Transport for London, 2003.
15. Danielis, R., L. Rotaris, E. Marcucci, and J. Massiani. An economic, environmental and
transport evaluation of the Ecopass scheme in Milan: three years later. 2014
16. Proag, S. Cost-Benefit Analysis of the Dutch Urban Environmental Zones. TU Delft and ENSTA Paris Tech, 2010.
17. Qadir, R.M., G. Abbaszade, J. Schnelle-Kreis, J.C. Chow and R. Zimmermann. Concentrations and source contributions of particulate organic matter before and after implementation of a low emission zone in Munich, Germany. Environmental Pollution, Vol. 175, 2013, pp. 158–167.
18. Wolff, H., and L. Perry. Trends in clean air legislation in Europe: particulate matter and low emission zones. Review of Environmental Economics and Policy, Vol. 4, 2010, pp. 293-308.
19. Börjesson, M., J. Eliasson, M. Hugosson, and K. Brundell-Freij. The Stockholm
congestion chares - 5 years on. Effects, acceptability and lessons learnt. Transport Policy, Vol. 20, 2012, pp. 1-20.
20. Browne M., J. Allen and S. Anderson. Low emission zones: the likely effects on the freight transport sector. International Journal of Logistics Research and Applications, Vol. 8, No 4, 2005, pp. 269-281.
21. London Freight Plan - Sustainable freight distribution: a plan for London. Transport for London, 2007.
22. Thompson, S. (2009) Working Paper 37 - London’s logistics sector. Report for the Greater London Authority.
23. The Logistics Report. Freight Transport Association, 2013.
24. Ultra Low Emission Zone. Cleaner Air for London and Transport for London, 2014. 25. Wirtschaftsbereiche - Transport & Verkehr. Statistisches Bundesamt, 2014.
https://www-genesis.destatis.de/genesis/online. Accessed July 17, 2014.
26. Berliner Wirtschaft in Zahlen Aufgabe 2009. Industrie und Handelskammer zu Berlin, 2009.
27. Berliner Wirtschaft in Zahlen Aufgabe 2012. Industrie und Handelskammer zu Berlin, 2012.
28. Lutz, M. and A. Rauterberg-Wulff. Ein Jahr Umweltzone Stufe 2 in Berlin. Berliner Senatsverwaltung für Gesundheit, Umwelt und Verbraucherschutz, 2011.
LIST OF FIGURES
FIGURE 1 The main LEZs in Europe (Source: the authors, based on a map provided by Atelier Parisien d’Urbanisme)
FIGURE 2 Rate of compliance with regulations in the London LEZ - phases 3 and 4 (Source: Transport for London)
FIGURE 3 Percentage of vehicles qualifying for a green sticker in Berlin between 2006 and 2011 (28)
FIGURE 1 The main LEZs in Europe (Source: the authors, based on a map provided by Atelier Parisien d’Urbanisme)
FIGURE 2 Rate of compliance with regulations in the London LEZ - phases 3 and 4 (Source: Transport for London)
PKW= Personenkraftwagen (passenger cars)
LKW= Lastkraftwagen (goods vehicles > 2.8 tons loaded) UWZ= Umweltzone (LEZ)
FIGURE 3: Percentage of vehicles qualifying for a green sticker in Berlin between 2006 and 2011 (28)