HAL Id: hal-00318118
https://hal.archives-ouvertes.fr/hal-00318118
Submitted on 9 Aug 2006
HAL is a multi-disciplinary open access
archive for the deposit and dissemination of
sci-entific research documents, whether they are
pub-lished or not. The documents may come from
teaching and research institutions in France or
abroad, or from public or private research centers.
L’archive ouverte pluridisciplinaire HAL, est
destinée au dépôt et à la diffusion de documents
scientifiques de niveau recherche, publiés ou non,
émanant des établissements d’enseignement et de
recherche français ou étrangers, des laboratoires
publics ou privés.
Irregular HF radio propagation on a subauroral path
during magnetospheric substorms
D. V. Blagoveshchensky, T. D. Borisova, J. W. Macdougall
To cite this version:
D. V. Blagoveshchensky, T. D. Borisova, J. W. Macdougall. Irregular HF radio propagation on
a subauroral path during magnetospheric substorms. Annales Geophysicae, European Geosciences
Union, 2006, 24 (7), pp.1839-1849. �hal-00318118�
www.ann-geophys.net/24/1839/2006/ © European Geosciences Union 2006
Annales
Geophysicae
Irregular HF radio propagation on a subauroral path during
magnetospheric substorms
D. V. Blagoveshchensky1, T. D. Borisova2, and J. W. MacDougall3
1St. Petersburg State University of Aerospace Instrumentation, St. Petersburg, Russia 2Arctic and Antarctic Research Institute, St. Petersburg, Russia
3University of Western Ontario, London, Ontario, Canada
Received: 17 November 2005 – Revised: 17 May 2005 – Accepted: 6 June 2006 – Published: 9 August 2006
Abstract. The impact of the main ionospheric trough,
spo-radic structures, gradients and inhomogeneities of the sub-polar ionosphere during substorms on the signal amplitude, azimuthal angles of arrival, and propagation modes for the radio path Ottawa (Canada)–St. Petersburg (Russia) was con-sidered. This subauroral path with the length of about 6600 km has approximately an east-west orientation. The main goals are to carry out numerical modeling of radio prop-agation for the path and to compare the model calculations with experimental results. Wave absorption and effects of focusing and divergence of rays were taken into considera-tion in the radio wave modeling process. The following ba-sic results were obtained: The signal amplitude increases by 20–30 dB 1–1.5 h before the substorm expansion phase on-set. At the same time the signal azimuth deviates towards north of the great circle arc for the propagation path. Com-pared with quiet periods there are effects due to irregularities and gradients in the area of the polar edge of the main iono-spheric trough on the passing signals. Propagation mecha-nisms also change during substorms. The growth of signal amplitude before the substorm can be physically explained by both a decrease of the F2-layer ionization and a growth of the F2-layer height that leads to a decrease of the signal field divergence and to a drop of the collision frequency. Iono-spheric gradients are also important. This increase of sig-nal level prior to a substorm could be used for forecasting of space weather disturbed conditions.
Keywords. Magnetospheric physics (Storms and
sub-storms) – Ionosphere (Ionospheric disturbances) – Radio sci-ence (Radio wave propagation)
Correspondence to: D. V. Blagoveshchensky
(dvb@aanet.ru)
1 Introduction
It is well known that the main ionospheric trough (MIT), and the auroral oval, sporadic structures, and belt of iono-spheric inhomogeneities concentrated southward the oval impact on HF radio propagation on the paths located in the area of invariant latitudes 50–75◦(Blagoveshchensky, 1981; Blagoveshchensky et al., 1982; Hunsucker and Hargreaves, 2003; Milan et al., 1997; Siddle et al., 2004a; Siddle et al., 2004b). Lateral signal reflections, backscatter, quick fading of signals at a receiving point, and unusual modes of propa-gation are observed. However, geomagnetic disturbances oc-curring in the auroral and subauroral ionosphere of the Earth, lead to even more complicated (anomalous) conditions of HF radio propagation in the subpolar regions (Blagoveshchen-sky and Zherebtsov, 1987; Blagoveshchen(Blagoveshchen-sky and Borisova, 2000; Blagoveshchensky et al., 1996, 2005b; Milan et al., 1998, 1996). This happened because there are additional small- and large-scale irregularities of the ionosphere dur-ing magnetospheric storms and substorms, (Blagoveshchen-sky et al., 2003a, 2003b; Buonsanto, 1999; Gonzalez et al., 1994; Lastovicka, 2002; Lyons, 1996). Also all parameters of the ionosphere and the large-scale structures in the sub-auroral region (MIT, gradients, sporadic ionization and so on) show more change in their morphology when the sub-storm/storm intensity is greater. Earlier, experimental inves-tigations of the HF radio propagation on high-latitude paths were carried out by many authors (Blagoveshchensky, 1981; Hunsucker and Hargreaves, 2003; Angling et al., 1998; Mi-lan et al., 1998, 1996; Warrington and Stocker, 2003). These studies revealed the main peculiarities of HF radio propaga-tion on the subauroral and auroral paths. However, special measurements of signal amplitude and azimuths of arrival angles at the receiving point of paths and information about basic propagation modes during substorms are not enough to understand how this region affects radio propagation. A
1840 D. V. Blagoveshchensky et al.: Irregular HF radio propagation on a subauroral path
21
Figure 1.
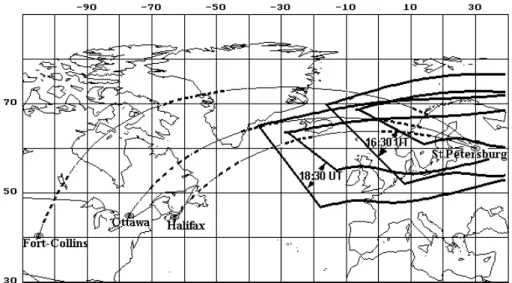
Fig. 1. Great circle radio paths from Canada to St. Petersburg. Dashed parts of the radio paths show where ionospheric reflections would
occur. The locations of the main ionospheric trough from a model by Halcrow and Nisbet (1977) at 16:50 and 18:40 UT are shown for 6 January 1982 and Kp=2. The trough contours show the outer boundaries and the inner boundaries of the trough walls.
more detailed analysis of the propagation is necessary. This is important for questions of radio communication organiza-tion, over horizon locaorganiza-tion, direction finding, navigation and so on at high latitudes (Blagoveshchensky and Zherebtsov, 1987; Goodman, 1992).
In this paper, the impact of some geophysical phenom-ena mentioned above during magnetospheric substorms on the level of electromagnetic field and azimuthal deviation of radio signal at the receiving point as well as mechanisms (modes) of propagation for the subauroral radio path Ottawa– St. Petersburg (D=6600 km) is analyzed. This transatlantic path, Fig. 1, connecting Canada with Russia, was investi-gated as part of an international collaboration.
There are three goals to this study: (i) to study in de-tail the behavior of both the levels of signal amplitude and the azimuthal angles of arrival from experimental measure-ments, (ii) to carry out numerical modeling of radio prop-agation and compare model calculations with experimental results for better understanding of the physical mechanisms involved when the signal passes through the HF radio chan-nels, (iii) to make quantitative estimates of ionospheric pa-rameters influences on the value of the electromagnetic field of the HF radio signal.
Before solving these tasks, it must be emphasized that some applicable results were obtained by the authors in ear-lier studies. To begin with there are effects of signal am-plitude growth and azimuth variations during substorms on different radio paths. Relevant investigations were presented in (Blagoveshchensky and Borisova, 2000; Blagoveshchen-sky et al., 2005, 1996). It has been found experimentally that the effect of amplitude growth and azimuth variations take place on both short (one-hop) and long (multi-hop) high-latitude paths. Figure 1 shows the Fort Collins–St.
Peters-burg, and Halifax–St. Petersburg paths in addition to the Ottawa–St. Petersburg path. These two additional paths are also subauroral and they are located along the main iono-spheric trough (MIT) (see trough locations shown in Fig. 1). Let us describe an example of signal amplitude variations at the receiving point during a substorm on 28 December 1978 for the Fort Collins–St. Petersburg path (D=7200 km, f=15 MHz). The moment of substorm expansion phase on-set is designated by To. There is signal amplitude growth within ∼1 h before To, further a drop of amplitude during the substorm expansion phase, and then an amplitude growth near the end of the substorm. Similar signal amplitude varia-tions occur on the Halifax–St. Petersburg path (D=7200 km, f=15 MHz) for a substorm on 6 January 1982.
At present, a full physical explanation of the signal am-plitude growth does not exist, however, there is a good rea-son to believe that this effect is associated with so called “the main ionospheric effect during substorm”. In the paper Blagoveshchensky et al., 2005a, the “main effect” was stud-ied for an averaging of data from a group of subauroral and midlatitude European ionospheric stations (Blagoveshchen-sky et al., 1996, 2003a). There is a definite regular variation of both the F2-layer’s critical frequency and height of ion-ization maximum of F2 during substorms. The substorms used had a sharp onset at time To(Blagoveshchensky et al., 2003a). The study shows deviations in percent relatively to the quiet level of ionospheric parameters for the growth (6 h before To), expansion (To)to (To+3) and recovery (To+3) to (To+6) phases of a substorm. 2–6 h before the substorm expansion phase development there is a sharp growth of the F2-layer ionization (1foF2=+ 25%). Then the ionization de-creases smoothly up To (1foF2=–30%). After To, during the expansion phase lasting about three hours, both slight
growth and then decrease of ionization take place. During the substorm recovery phase, (To+3) to (To+6), there is more intensive growth (1foF2=+30%) and then decrease of ion-ization. The height of the F2-layer maximum has a ten-dency to increase smoothly 2 h before the Tomoment up to 1hmF2=+30%. After the expansion phase onset, during the
next three hours, there is a little decrease and then growth of the F2-layer maximum height to the end of the expansion phase and then a further smooth decrease to the quiet level. Variations of the sporadic E layer critical frequency, 1foEs, show some oscillations with a little growth (∼15%) starting 3 h before Toand then with growth (+30%) within the expan-sion phase. Note that these Esvariations are from a subset of the whole group of ionosonde measurements – the Es effects are seen mainly on ionosondes located near the auroral oval. Thus, in the previous papers the following was discovered: There is an amplitude growth of propagating signals before substorms on HF radio paths, and associated with the sub-storms ionospheric changes called the “main ionospheric ef-fect”. These effects were found experimentally by means of oblique ionospheric sounding and vertical ionospheric sounding using a network of stations (Blagoveshchensky et al., 1996; Blagoveshchensky et al., 2005a). In this paper we are trying to connect the ionospheric changes with the changes in propagation signal strength for a better under-standing of the physical phenomena that are involved.
2 Experiment on the Ottawa–St. Petersburg path
Empirical measurements of electromagnetic field level and azimuthal angles of arrival of radio signal with a frequency f=14 670 kHz from an Ottawa transmitter (44◦N; 77◦W) were carried out in 1982 at a receiving point located nearly St. Petersburg (59.5◦N; 30◦E).
Why was the Ottawa–St. Petersburg path chosen for this studying? Firstly, our interest is with the northern sector of the Atlantic from Russia to Canada because ionospheric pa-rameters variations during substorms have been studied in this sector (for example Blagoveshchensky et al., 2005a). Secondly, the radio path Ottawa-St. Petersburg (D=6600 km) is a subauroral one directed approximately east-west (see Fig. 1). The MIT, and auroral and subauroral ionospheric irregularities along with temporal and spatial variations of ionospheric ionization and gradients impact on the character of HF radio wave propagation on this path. In the present paper, experimental data for the winter season of 1982 dur-ing evendur-ing and premidnight hours from 18 to 23 MDT (MDT=UT + 3) was considered.
Our radio direction finding system in St. Petersburg had a revolving antenna. The choice of two directions was exe-cuted by relevant program. The first one, (308±5)◦, is in-tended to receive the CW signals passing along the great circle arc from Ottawa to St. Petersburg. The second one, (340±20◦), is intended to receive the same signals going
22 Figure 2
N S
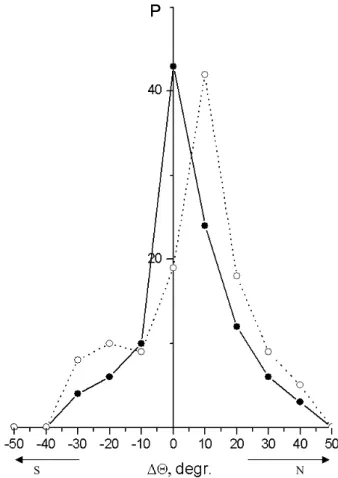
Fig. 2. Probabilities P(%) of the azimuthal deviations 12 for the
Ottawa-St. Petersburg path (f=14670 kHz) for two levels of mag-netic activity 6Kp<16 (solid line) and 16<6Kp<25 (dotter line)
for the measurements carried out during the winter season of 1982.
from the north directions due to scattering predominantly. These channels were working independently. The scattered signals have being received after the main signal with a delay about one second. The accuracy of receiving is ±2◦.
Azimuthal variations 12 were determined as deviations from the great circle path direction. Figure 2 shows an exam-ple of the probabilities P of azimuthal deviations for the path Ottawa–St. Petersburg (f=14 670 kHz) for two levels of mag-netic activity 6Kp<16 and 16<6Kp<25. The probability P of the azimuthal deviations are a distribution of measure-ments made by a receiver/antenna with directional capability. Curves on figure were determined for all period of observa-tions, about 2000 measurements. One can see from Fig. 2 that under weakly disturbed conditions (6Kp<16, solid line) the lateral deviations on the path are nearly symmetrical rela-tively zero, the great circle direction. However, under moder-ate disturbed conditions (16<6Kp<25, dotted line) the lat-eral deviations from the north, at +10 deg, are sharply in-creased. Obviously, they are caused by the appearance of gradients and intensive irregularities on the polar edge of the MIT during disturbances.
1842 D. V. Blagoveshchensky et al.: Irregular HF radio propagation on a subauroral path
23 Figure 3
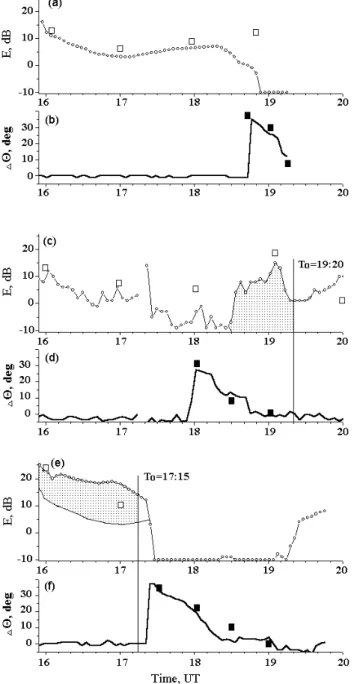
Fig. 3. Variations of the signal strength E and azimuthal deviations
of arrival angles 12 at the receiving point of the Ottawa–St. Peters-burg path during the quiet day of 14 January 1982 (a) and (b), the day of 6 January with a moderate substorm (c) and (d) and the day of 8 January with an intense substorm (e) and (f). Tois the substorm
expansion phase onset, the operational frequency is f=14 670 kHz, squares are numerical modelled values.
Figure 3 demonstrates some results of measurements of electromagnetic field strength (E, dB relatively 1 microV/m) and angular deviations (12, degrees) on the Ottawa–St. Pe-tersburg path. Three days were chosen for analysis. These days selected are the most typical and representative and they have substorms with sharp onsets (the To moment).
Sub-storms are characterized by different intensities and mean values of Kp- indexes: 14 January 1982 is a quiet day, Kp=1– (Figs. 3a and 3b); 6 January 1982 is a day with a moderate substorm, Kp=2o (Figs. 3c and 3d); 8 January 1982 is a day with an intense substorm, Kp=3- (Figs. 3e and 3f). The substorms starts, To moments, are identified from the AE indexes for 6 January 1982 and 8 January 1982.
From Figs. 3a and 3b one can see that the time of a sharp drop of the signal strength E on the radio path under quiet conditions (18:40 UT) is associated with a transition from reflection of radio waves to their scatter from ionospheric ir-regularities located on the polar edge of the trough (PET). The irregularity scattered signal is very small but measurable even as the signal appears have hit a “zero” value. A great increase of 12 values takes place at the moments of a sharp decrease of the signal strength and the 12 values themselves are mainly positive ones. Therefore, there the scattered sig-nals come from the north directions. According to Fig. 3b, 12deviations on the path have a clear tendency to decrease with time. This smooth drop is explained by the PET moving southward during premidnight hours.
An analysis of data presented in Figs. 3c and 3e shows that the signal strength level on the Ottawa–St. Petersburg path before the moment To as compared with a quiet day is increased by 15 dB. This can be seen on 6 January 1982 (Fig. 3c) where an increase of signal strength takes place from 18:30 to 19:20 UT and the substorm expansion phase onset is To=19:20 UT. For 8 January 1982 (Fig. 3e) a growth of signal level (relative to the quiet day curve shown below the shaded region on the figure) takes place from 16:00 to 17:15 UT and To=17:15 UT. Therefore before the To mo-ment one can see the effect of signal level growth which as a rule exists during about one hour (the shaded areas on Figs. 3c and 3e). For more intensive substoms, as can be seen from Figs. 3d and 3f, the moment of both the transition from reflection to scatter and the increase of 12 occurs during earlier hours because the PET is additionally moved south-ward during disturbances. For the Ottawa–St.Petersburg path these moments are: 18:40 UT (Fig. 3b), 18:00 UT (Fig. 3d) and 17:20 UT (Fig. 3f). Thus, the substorm effect in 12 val-ues at the beginning of substorm development is manifested at earlier time as compared with the quiet period and this effect is associated with the beginning of the impact of au-roral ionosphere irregularities which are concentrated north-ward of the great circle arc. For the Ottawa–St.Petrsburg path those are the irregularities located on the PET.
3 Modeling the radio propagation
Ray tracing calculations of propagation parameters on the Ottawa–St. Petersburg path for comparison with experi-mental data were carried out. Model calculations using the “model of HF radio channel” (Borisova et al., 1986) were performed using the approximation of 2-D geometrical
optics taking into consideration the smooth horizontal irreg-ularities of the ionosphere.
3.1 Model approach for signal strength E calculation For description of spatial and temporal variations of the propagation medium the “global ionospheric model” (the IZMIRAN ionospheric model which is similar to the inter-national reference ionosphere model) is used in “the model of HF radio channel”. The global model is constructed by unification of known models of separate ionospheric E, F1, and F2 layers and the interlayer valleys (Chernyshev and Vasil’eva, 1975; Anufrieva and Shapiro, 1976; Rawer et al., 1976). Ionospheric electron concentration variations due to substorm impact were described by using a special program block which allows for ionospheric correction. The regular-ities of ionospheric behavior during a substorm, the “main effect”, were used for this.
Input parameters for the model are: the geographical co-ordinates of the transmitter and receiver, the radiation pat-terns of receiving and transmitting antennas, the date and time, the operational frequency f of the radio signal, and a measure of the prevailing geophysical conditions using Wolf number and magnetic activity level with given Kp–index (Blagoveshchensky and Borisova, 1989). The model of the HF radio channel permits calculation of some characteristics of radio propagation on a given path: the ray trajectories, the group and phase paths, the mode types, the Doppler fre-quency variations, arrival angles in the vertical and horizontal planes, and the electromagnetic field strength E.
For calculation of the field strength E at a receiving point, the following expression from (Ginzburg, 1967; Al’pert, 1972) was used E = 173.2 √ P REsin D2 v u u t sin αt r REcos αrec ∂D2 ∂α ·exp(−0)· N Y i=1 ρi ,(1)
where P is a source power, RE is the Earth’s radius; D2is the angle length of the path along the Earth’s surface; αt r and αrecare the elevation angles of transmitter and receiver; ∂D2/∂α is a coefficient of space divergence of rays; ρ is a coefficient of losses due to reflection from the Earth’s surface which depends on signal frequency and surface characteris-tics; N is a reflections number; 0 is a coefficient of losses due to signal propagation in the ionosphere.
For the HF range, the expression for the loss coefficient 0 can be presented using the group Lgrand phase Lphpaths 0 =1/(2c)ν(r)[1/n(r) − n(r)]dr = 6νi·(Lgr−Lph) ,(2) where r=h+RE , h is a height from the Earth’s surface and RE is the Earth’s radius; n=ε1/2 is a refraction coefficient under condition that an impact of collision on the dielectric permeability is neglected; c is the speed of light; νi is the effective collision frequency of electrons and a value of νi is
24 Figure 4
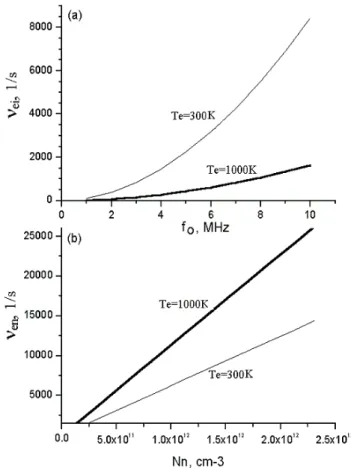
Fig. 4. Relationships between the collision frequency νei and the
critical frequency fo (a) and between the collision frequency νen
and the concentration of neutrals (b) for two levels of electron tem-perature Te=300 and 1000 K.
constant on the i-step of summarizing (after transition from integration to summarizing).
At first, the coefficient 0 was determined by Eq. (2) through integration along the radio path and then calculation of the electromagnetic field strength E at the receiving point by Eq. (1) was done.
3.2 Calculation of the electron collision frequency in the ionosphere
The value of effective electron collision number νeff is a sum of collision frequencies
νeff =νei+νen+νe, (3)
where νei is a frequency of collisions electrons with ions; νen is the same but with neutrals; νe – with electrons. For the ionospheric plasma, νe value can be neglected in Eq. (3) because it is less than νeiand νenby two orders of magnitude. There are two expression by (Ginzburg, 1967) and (Nico-let, 1953) to determine νeiand νenparameters
νen=(3.6 − 5.4) · 10−10NnT 1/2 e νei =12.65 · Ne·lg(220 · Te/N 1/3 e )/T 3/2 e , (4)
1844 D. V. Blagoveshchensky et al.: Irregular HF radio propagation on a subauroral path where Nn is the concentration of neutral particles
(particles.cm−3); N
e is the electron (ion) concentration (electrons.cm−3); T
e is the electron temperature (K); lg is the decimal logarithm.
From Eqs. (4) one can see that collision frequencies νei and νen depend on both the concentrations and the electron temperature. Variations of the regular electron temperature for the ionospheric F-layer in middle latitudes are limited to the range 300–1500◦(Al’pert, 1972).
Figure 4 shows calculations of the collision frequencies νei and νen. Figure 4a shows νeiversus the critical ionospheric frequency fo=8.98·103·Ne1/2, and Fig. 4b shows νen versus the concentration of neutrals, Nn. One can see from Fig. 4a that some decrease of electron concentration, which occurs during the period before a substorm onset, leads to a drop of the collision frequencies νei.
An analysis of numerical calculations of the effective col-lision frequencies νeff using Eqs. (3) and (4) allows us to estimate quantitatively the impact of parameters Ne, Nn, and Te on the νeff values for the ionospheric E- and F2-layers. In later calculations of νeff for determination of the signal strength E, the influence on νen of the height of ionospheric E-layer was important because for the F2 layer νei νen. Our calculations were carried out using the MSIS model (http: //nssdc.gsfc.nasa.gov/space/model/models/msis.html) which show that the concentration of neutrals is decreases sharply with a height h. For the ionospheric E-layer Nn∼1·10+12, and for the F2-layer Nn∼1·10+9, therefore the νen value is decreased by three orders of magnitude, see Fig. 4b.
It is of interest to consider the effects of νeff variations during the substorm growth phase for which the ionospheric parameters vary according to the “main effect” regularities mentioned in the introduction. Namely, during the time pe-riod 1–2 h before the substorm onset, when increases of the signal strength E is observed by up to 20–30 dB, the criti-cal frequencies foEs and foF2 drop by 20 and 30%, respec-tively and the height of the F2-layer maximum increases by 30%. Due to ionospheric changes associated with a height change, we can easily estimate the local changes in νeff. us-ing Eqs. (3) and (4):
1. In the ionospheric F2-layer, if there is a temperature growth by 200–400 K associated with the height change, and a simultaneous decrease of critical frequencies by 30–40% this leads to a drop of νeff values by a factor of four.
2. The appearance of an Es sporadic layer on the path causes some changes of the collision frequency value too. A decrease of critical frequency at the heights of E-layer by 10– 20% leads to a drop of νeff value in the E region of ∼20%.
What are the possible causes and consequences of increas-ing the F2-layer height 1–2 h before the substorm onset? It is known (Buonsanto, 1999) that under magnetically disturbed conditions within the middle latitude ionosphere a growth of the F2-layer maximum height is observed. One of the causes of this growth can be an electric field with west-to-east direc-tion. The middle latitude ionosphere during substorms is
per-turbed by both electric fields and internal atmospheric gravity waves (AGWs). The effect of AGW is similar to an elec-tric field effect. According to (Rishbeth and Garriott, 1969; Buonsanto, 1999) vertical height change of the F-layer due to AGWs influence can be about 100 km which is more than an electric field impact. As is well known, the magnetospheric electric field, directed from dawn-to-dusk, is increased some minutes after a turning of the vertical component of the IMF Bz to southward. Almost simultaneously, the dawn-to-dusk electric field in the polar region and corresponding fields in the middle latitudes are increased. Electric currents and mag-netic disturbances of the DP2type also appear. There is also
the development of polar electrojets and other phenomena corresponding to the substorm growth phase which will hap-pened 0.5–1 h later. Therefore, an interval from the Bz turn-ing southward to the onset of electrojets development exists when the existence of the AGW generated during substorms is unlikely and a growth of the F2-layer maximum height can be explained by just the influence of electric fields.
Thus, estimations show that the specific decreases of elec-tron concentration in the E- and F-layers before a substorm contribute to a drop of the effective collision frequency νeff and therefore to an increase of signal strength E. It is not im-mediately obvious whether this would give a large or small change in radio signal strength. Numerical modeling was carried out to find how great is the growth of signal strength E at the receiving point of the radio path before a substorm. 3.3 Calculations of the signal strength values
Some different calculations of electromagnetic field strength E on the Ottawa–St. Petersburg path using different values of the ionospheric E- and F2-layer parameters were carried out. The critical frequency foF2, the height of F2-layer maximum
hmF2, and the critical frequency foEs were varied under the assumption that the ionosphere is homogeneous along the ra-dio path. Calculations were carried out for the rara-dio signal frequency f=14670 kHz.
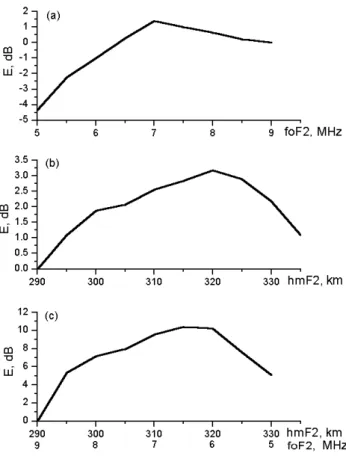
• Model results #1: In Fig. 5 are shown the calculated re-sults of the signal strength, E, received for the propagation mode 2F2 (2 hop F2 mode) that is typical for the frequency f=14670 kHz on the Ottawa–St. Petersburg path. Figure 5a demonstrates the association of signal strength E with the critical frequency foF2. A relationship between E and hmF2 is shown in Fig. 5b. Figure 5c illustrates the E variations as a function of both the hmF2 increasing and the foF2 decreasing simultaneously. One can see from Figs. 5a, 5b, and 5c that the signal strength E depends on the range of the ionospheric parameters variations.
– It is seen from Fig. 5a that a decrease of the foF2 value
by 30–50% leads to a growth of E value of only 1–2 dB if the critical frequency foF2 is about 7 MHz.
– Figure 5b shows that an increase of the hmF2 value
by 30% causes a growth of E value by ∼3 dB when
hmF2<320 km.
– Calculations results presented in Fig. 5c show that both
a growth of hmF2 from 290 to 315 km and a decrease of foF2 from 9.0 to 6.5 MHz simultaneously will lead to the growth of radio signal level by ∼10 dB.
Further model calculations gave the following results:
– Increasing the temperature from 300 to 1000 K in the
F2-layer causes an increase of E value by 1–3 dB.
– A drop of the critical frequency foEs by 15% leads to a growth of E value by 6–10 dB.
•Model results #2: The natural distribution of ionospheric plasma along the radio path is characterized as a rule by an existence of gradients of the critical frequency foF2 and the F2-layer height hmF2. Modeling the propagation parame-ters, taking into consideration the ionospheric gradients of the F2-layer ∂foF2/∂D and ∂hmF2/∂D, has showed that these gradients can very significantly change the ray trajectory in the ionospheric channel. As a consequence, the spatial diver-gence of rays ∂θ /∂α is being changed too. An increase of sig-nal strength E can reach ∼10 dB for both ∂foF2/∂D=–(0.2– 0.5) MHz / 1000 km and ∂hmF2/∂D=(2–5) km / 1000 km val-ues that are typical for the evening hours on the Ottawa– St. Petersburg path. Therefore due to the existence of sharper ionospheric gradients, ∂θ /∂α value can increase the signal strength E by 10–15 dB. The calculations yield the results that ionospheric parameter variations, similar to those that really happen in the F2-layer, lead to significant propagation trajectory variations. In the case of a drop of ionospheric ion-ization maximum (the evening hours on the path), the oper-ational frequency approaches to the maximum observed fre-quency (MOF) and signal strength is increased due to a fo-cusing effect (or a divergence decrease).
Therefore the main results of modeling are the following: A growth of the signal strength E before the Tomoment of a substorm can be explained by the joint impact of several effects: a decrease of the F2-layer ionization along the radio path (1–2) dB, a growth of the F2-layer height (∼3) dB, an existence of regular ionospheric gradients (10–15) dB, and a drop of the effective collision frequency νeff–(1–3) dB. Their joint action can lead to a rise of the signal strength E before the substorm onset by 20–30 dB which is observed experimentally.
25 Figure 5
Fig. 5. Calculation results of the signal strength E at the re-ceiving point of the Ottawa–St. Petersburg path for the frequency f=14 670 kHz versus foF2 (a), hmF2 (b), and foF2 and hmF2 simul-taneously (c).
4 Comparison of modeling results with experimental data
4.1 Variations of signal strength and propagation mecha-nisms during the substorm period
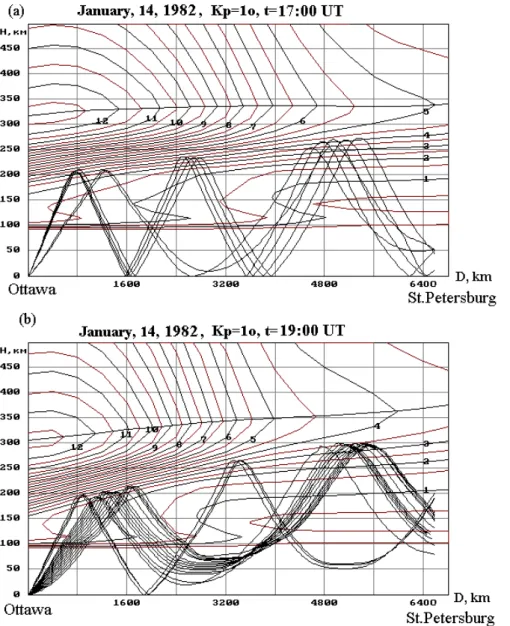
Ray tracing calculations on the Ottawa–St. Petersburg path have shown that the propagation modes 2F2 and 3F2 are pos-sible under quiet geomagnetic conditions. Figure 6 shows some modeled ray trajectories. The mode 4F2 is negligible because of its small signal strength as compared with modes 2F2 and 3F2. In Fig. 6b the radio waves are skimming the limb of the Earth (note that there are no ground reflections). The signal receiving in St. Petersburg is possible due to scat-ter by the field-aligned ionospheric inhomogeneities located in the area of polar edge of trough at both the E- and F- lay-ers levels. The second reflection of mode 3F2 happens in the area of auroral oval.
Variations of parameters 1foF2, 1hmF2, and 1foEsof the subauroral and partly auroral ionosphere during three phases of substorm, the “main effect”, were taken into considera-tion for ray tracing calculaconsidera-tions along the path. Shown in Fig. 3c (square symbols) are the signal strength E values for
1846 D. V. Blagoveshchensky et al.: Irregular HF radio propagation on a subauroral path
26
Figure 6
Fig. 6. Ray tracing calculations for the Ottawa–St. Petersburg path: the multi-hop propagation mechanism at 17:00 UT (a), and the wave
capture into the ionosphere by the regular longitudinal gradients of the ionosphere at 19:00 UT (b). Values of the critical frequency fo on the figure contours are in MHz.
6 January 1982. Here the substorm expansion phase onset is To=19:20 UT. Modeling results yield that during the growth phase from 18:20 to 19:20 UT the modes 2F2 and 3F2 are possible whereas under the quiet conditions (without sub-storms) and for the same time from 18:20 to 19:20 UT the model calculations give the result that no propagation is pos-sible for the path. Referring to Fig. 3c, we show good agree-ment from our modeling for both the intense signal before the substorm expansion phase and the overall pattern of sig-nal variations during the entire substorm interval. During the growth phase, 18:20–19:20, the E value is significantly greater than under quiet conditions for this time interval (see shaded region on Fig. 3c).
An analysis of ray tracing calculations showed that the main mechanism of propagation for the path during day-time is multi-hop by F2 reflections. For the evening hours, there is a wave capture into the ionosphere by the regular longitu-dinal gradients. In the case when the terminator crosses the path, the signal receiving after 17:00 UT is possible only due to wave removal from the ionosphere on the night side. The removal mechanism itself is caused by inhomogeneities lo-cated in the areas of the terminator, MIT, and auroral oval. There is either refraction by the horizontal gradients of elec-tron concentration near the polar edge of trough or field-aligned scatter by auroral irregularities in the ionospheric E-and F-layers. For modeling we assumed some F2-parameters
in the area of assumed field-align scatter in order to model the azimuthal deviations during the period from 16:00 to 20:00 UT. We used hmF2=300–340 km, foF2 =4.0–3.5 MHz. Figures 3b, 3d, 3f demonstrate some model calculations of azimuthal deviations 12 simultaneously with experimental data on the Ottawa–St. Petersburg path for 14, 6, and 8 Jan-uary 1982. The calculation values are shown by squares. One can see acceptable agreement between the measured and the calculated data.
4.2 Interpretation of experimental and modeling data 4.2.1 The quiet day of 14 January 1982
a) The signal strength E variations
An empirical pattern E(t) is presented in Fig. 3a. It is of interest to consider the relevant modeling results. According to the propagation model, the modes 2F2, 3F2, and 4F2 are observed up to 17:00 UT on the path that is seen from Fig. 6a for t=17:00 UT. After 17:00 UT the mode 2F2 is absent at the receiving point because it is skimming the limb of the Earth (see Fig. 6b). At this time the regular propagation 2F2 mechanism is no longer operational. The mode 3F2 is also skimming and the signal amplitude must decrease according to the model. However, one can see from Fig. 3a that the signal strength from 17:30 to 19:00 UT is quite intensive. This can be explained by the impact of the terminator or the butt-end sunset wall of the MIT on the reflection point nearest to the receiver of the path from 17:00 to 19:00 UT. This leads, according to calculations, to an appearance of the modes 2F2 and 3F2 as a result of their bending. After 19:00 UT the impact of the terminator is over according to the model, the modes 2F2 disappear, and the signal strength is sharply decreased. Namely, the regular propagation along the great circle arc is finished and a scatter from the PET arises, Fig. 3a.
b) The azimuthal variations 12, Fig. 3b
According to model calculations, around 19:00 UT it is possible to receive the signals scattered by the magnetic field-align irregularities of the ionospheric F-layer located in the PET area. Similar conclusion is confirmed by experimental data in Fig. 3b where the sharp jump of 12 value followed by decreasing 12 takes place.
4.2.2 The day of 6 January 1982 with a moderate sub-storm.
a) The signal strength E variations is shown in Fig. 6c According to model calculations, wave propagation on the path up to 17:00 UT is realized by modes 2F2, 3F2, and 4F2. After 17:00 UT there is only mode 3F2. Calculations
results (square symbols) and experimental data in Fig. 3c can be considered as comparable. According to experiment from 18:30 to 19:20 UT, a significant increase of signal strength takes place. This increase of signal strength, as was mentioned above, is associated with the substorm expansion phase onset at To=19:20 UT. Modeling results of the effect of signal strength growth before the Tomoment is confirmed by experimental data.
b) The azimuthal variations 12o, Fig. 3d
According to calculations, the conditions of receiving the signals, scattered from the PET, arise after 18:00 UT. At the same time, a sharp jump of 12ovalues takes place according to the experimental data shown in Fig. 3d.
4.2.3 The day of 8 January 1982 with an intense substorm 1. The signal strength E variations, Fig. 3e
Here the model calculations show that the regular mecha-nism of radio wave propagation is similar to the mechamecha-nism of the quiet day, 14 January and the regular multi-hop wave propagation is finished at 17:30 UT. The received signal disappears after 17:30 UT as shown by experimental data in Fig. 3e. Some growth of signal strength after 19:30 UT in Fig. 3e is caused by rays propagating by unusual paths due to refraction bending at the PET.
2. The azimuthal variations 12o
One can see from Fig. 3f that at 17:20 UT there is a sharp deviation of 12ovalues. According to modeling data, after this time radio signals scattered by field-aligned irregularities at the PET can be received.
5 Conclusions
1. Some peculiarities of HF radio wave propagation on the path Ottawa–St. Petersburg during magnetospheric sub-storms were revealed using experimental data and numerical modeling. Model calculations are in a good agreement with the experimental results confirming that the model used suit-able physical mechanisms of propagation and suitsuit-able choice of parameters for the radio channels.
2. During substorms, growth of the signal amplitude is observed 1–1.5 h before the substorm expansion phase on-set. At the same time, there may be azimuthal deviations of the received signal, compared to the great circle path, due to the effects of ionospheric irregularities and gradients in the area of the polar edge of the main ionospheric trough on the passing signals. The mechanisms (modes) of propagation are also changed during the substorm.
1848 D. V. Blagoveshchensky et al.: Irregular HF radio propagation on a subauroral path 3. Radio propagation modeling within the substorm period
was carried out using the assumption that there was a change of ionospheric ionization in the E- and F2-layers in accord-ing to so called “the main effect in the ionosphere duraccord-ing substorm”. Calculations of the field-aligned HF scatter took into consideration the F2 region parameters of the scatterers using a modified model of the ionosphere. Results of these calculations agreed with the experimental observations.
4. The effect of signal amplitude growth up to 20–30 dB before the substorm expansion phase onset can be physically explained by both (i) a decrease of the F2-layer ionization that leads to an approach of signal frequency to the maximum observed frequency value as well as to a decrease of the sig-nal field divergence and (ii) a growth of the F2-layer height that associated with decreasing the collision frequency. This effect could be used as a predictor of substorms for further forecasting of space weather disturbed conditions.
5. In the northern part of the Atlantic between Canada and the European part of Russia, impact of the main iono-spheric trough (MIT) on the parameters of signal in the long HF radio channel under quiet conditions manifests itself in different ways. The MIT and its polar edge influence ba-sically the azimuthal angles of radio wave arrival. On the other hand, the butt-end sunset wall of the MIT, caused by the terminator, has significant influence on the amplitude of received signals. During substorms, there are also significant amounts of irregularities that modify the propagation by al-tering both the polar edge and the butt-end sunset wall of the MIT.
Acknowledgements. The authors of the paper would like to thank
NASA (USA) and Kyoto (Japan) services providing scientific data that have been used in this study. This work was facilitated through financial support on grant NATO ESP/CLG No981604.
Topical Editor M. Pinnock thanks A. Stocker and V. Eccles for their help in evaluating this paper.
References
Al’pert, Ya. L.: Propagation of Electromagnetic Waves and Iono-sphere (in Russian), Nauka Press, Moscow, 564, 1972.
Angling, M. J., Cannon, P. S., Davies, N. C., Willink, T. J., Jodalen, V., and Lundborg, B.: Measurements of Doppler and multipath spread on oblique high-latitude HF paths and their use in char-acterizing data modem performance, Radio Science, 33(1), 97– 107, 1998.
Anufrieva, T. A. and Shapiro B. S.: Geometrical parameters of the ionosphere F2-layer (in Russian), Nauka Press, Moscow, 91, 1976.
Blagoveshchensky, D. V.: HF radio wave propagation at the high-latitudes (in Russian), Moscow, Nauka, 192–214, 1981. Blagoveshchensky, D. V. and Zherebtsov, G. A.: High-latitude
geo-physical phenomena and forecasting of HF radio channel (in Russian), Moscow, Nauka, 35–68, 1987.
Blagoveshchensky, D. V. and Borisova, T. D.: Substorm effects of ionosphere and HF propagation, Radio Science, 35(5), 1165– 1171, 2000.
Blagoveshchensky, D. V., Egorova L. V., and Lukashkin V. M.: High-latitude ionospheric phenomena diagnostics by high-frequency radio wave propagation observations, Radio Sci., 27(2), 267–274, 1992.
Blagoveshchensky D. V., Borisova T. D., and Egorova, L. V.: Pre-and after substorm situations in the ionosphere Pre-and decameter radio wave propagation (in Russian), Geomagn. Aeron., 36, N4, 125–134, 1996.
Blagoveshchensky, D. V., Maltseva, O. A., and Rodger, A. S.: Iono-sphere dynamics over Europe and western Asia during magneto-spheric substorms 1998-1999, Ann. Geophys., 21, 1141–1151, 2003a.
Blagoveshchensky, D. V., Pirog, O. M., Polekh, N. M., and Chistyakova, L. V.: Mid-latitude effects of the May 15, 1997 magnetic storm, J. Atmos. S.-P., 65, 303–310, 2003b.
Blagoveshchensky, D. V., Vystavnoi, V. M., and Sergeeva M. A.: HF radio propagation through the auroral oval during substorms, J. Atmos. S.-P., 67, 1618–1625, 2005b.
Blagoveshchensky, D. V. and Borisova T. D.: Correction of the HF radio channel model with allowance of solar and magnetic activ-ity (in Russian), Geomag. Aeron., 29, 696–698, 1989.
Borisova, T. D., Baranets, A. N., and Cherkashin, Yu. N.: A method of calculation of ray-tracing end energy parameters of the radio wave propagation on the long paths, in: Ionospheric Radio Wave propagation (in Russian), Nauka, Moscow, 12–20, 1986. Buonsanto M. J.: Ionospheric storms – a review, Space Science
Reviews, 88, 563–601, 1999.
Chernyshev, D. V. and Vasil’eva, T. N.: Prediction of the Maxi-mum Critical Frequencies for W=10, 50,100,150,200 (in Rus-sian), Nauka, Moscow, 54, 1975.
Ginzburg, V. L.: The Propagation of Electromagnetic Waves in Plasma (in Russian), Nauka Press, Moscow, 684, 1967. Gonzalez, W. D., Joselyn, J. A., Kamide, Y., et al.: What is a
ge-omagnetic storm?, J. Geophys. Res., 99, No. A4, 5771–5792, 1994.
Goodman, J.: HF communications–science technology, Van Nos-trand Reinhold, New York, 63–78, 1992.
Halcrow, B. H. and Nisbet, J. S.: A model of F2 peak electron den-sities in the main trough region of the ionosphere, Radio Sci., 12, 815–821, 1977.
Hunsucker, R. D. and Hargreaves, J. K.: The high-latitude iono-sphere and its effects on radio propagation. Cambridge Univer-sity Press, 113–336, 2003.
Ivanov-Kholodny, G. S. and Mikhaylov, A. V.: Forecasting of the ionospheric states (in Russian), Leningrad, Gidrometeoizdat, 190, 1980.
Lastovicka, J.: Monitoring and forecasting of ionospheric space weather – effects of geomagnetic storms, J. Atmos. S.-P., 64, 667–705, 2002.
Lyons, L. R.: Substorms: Fundamental observational features, dis-tinction from other disturbances, and external triggering, J. Geo-phys. Res., 101, No. A6, 13 011–13 025, 1996.
Milan, S. E., Lester, M., Jones, T. B., and Warrington, E. M.: Ob-servation of the reduction in the available HF band on four high latitude paths during periods of geomagnetic disturbance, J. At-mos. S.-P., 60, 617–629, 1998.
Milan, S. E., Jones, T. B., Lester, M., Warrington, E. M., and Reeves, G. D.: Substorm correlated absorption on a 3200 km trans-auroral HF propagation path, Ann. Geophys. 14, 182–190,
1996.
Milan, S. E., Jones, T. B., and Warrington, E. M.: Enhanced MUF propagation of HF radio waves in the auroral zone. Journal of Atmospheric and Solar – Terrestrial Physics 59, 237–249, 1997. Nicolet, M.: The collision frequency of electron in the ionosphere,
J. Atmos. Terrest. Phys., 3, 200–211, 1953.
Rawer, K., Ramakrishnan, S., and Bilitza, D.: International Refer-ence Ionosphere. Brussel, URSI, Cospar, 78, 1976.
Rishbeth, H. and Garriott, O. K.: Introduction to Ionospheric Physics, Academic Press New York and London, 51–146, 1969.
Siddle, D. R., Stocker, A. J., and Warrington, E. M.: The time-of-flight and direction of arrival of HF radio signals received over a path along the mid-latitude trough: observations, Radio Sci.e, 39, RS4008, doi:10.1029/2004RS003049, 2004a.
Siddle, D. R., Zaalov, N. Y., Stocker, A. J., and Warring-ton, E. M.: The time-of-flight and direction of arrival of HF radio signals received over a path along the mid-latitude trough: theoretical considerations, Radio Sci., 39, RS4008, doi:10.1029/2004RS003052, 2004b.
Warrington, E. M. and Stocker, A. J.: Measurements of the Doppler and multipath spread of HF signals received over a path ori-ented along the mid-latitude trough, Radio Sci., 38, (5), 1080, doi:10.1029/2002RS002815, 2003.