HAL Id: hal-00317060
https://hal.archives-ouvertes.fr/hal-00317060
Submitted on 1 Jan 2003
HAL is a multi-disciplinary open access
archive for the deposit and dissemination of
sci-entific research documents, whether they are
pub-lished or not. The documents may come from
teaching and research institutions in France or
abroad, or from public or private research centers.
L’archive ouverte pluridisciplinaire HAL, est
destinée au dépôt et à la diffusion de documents
scientifiques de niveau recherche, publiés ou non,
émanant des établissements d’enseignement et de
recherche français ou étrangers, des laboratoires
publics ou privés.
during magnetospheric substorms 1998?99
D. V. Blagoveshchensky, O. A. Maltseva, A. S. Rodger
To cite this version:
D. V. Blagoveshchensky, O. A. Maltseva, A. S. Rodger. Ionosphere dynamics over Europe and western
Asia during magnetospheric substorms 1998?99. Annales Geophysicae, European Geosciences Union,
2003, 21 (5), pp.1141-1151. �hal-00317060�
Annales Geophysicae (2003) 21: 1141–1151 c European Geosciences Union 2003
Annales
Geophysicae
Ionosphere dynamics over Europe and western Asia during
magnetospheric substorms 1998–99
D. V. Blagoveshchensky1, O. A. Maltseva2, and A. S. Rodger3
1University of Aerospace Instrumentation, St. Petersburg, 190000, Russia 2Institute of Physics, Rostov University, Rostov-on-Don, 344090, Russia 3British Antarctic Survey, Madingley Road, Cambridge, CB3 OET, UK
Received: 17 October 2001 – Revised: 5 September 2002 – Accepted: 24 October 2002
Abstract. The temporal and spatial behaviour of the
iono-spheric parameters foF2 and h0F during isolated substorms are examined using data from ionospheric stations distributed across Europe and western Asia. The main purpose is find-ing the forerunners of the substorm disturbances and a pos-sible prediction of these disturbances. During the period from March 1998 to March 1999, 41 isolated substorms with intensities I = 60 − 400 nT were identified and studied. The study separated occasions when the local magnetometers were affected by the eastward electrojet (positive substorms) from those influenced by the westward electrojet (negative substorms). The deviations of the ionospheric parameters from their monthly medians (1foF2 and 1h0F) have been used to determine the variations through the substorm. Sub-storm effects occurred simultaneously (< 1 h) across the en-tire observatory network. For negative substorms, 1foF2-values increase > 6 h before substorm onset, To, reaching a maximum 2–3 h before To. A second maximum occurs 1–2 h after the end of the substorm. The 1h0F values 3–4 h before
Tohave a small minimum but then increase to a maximum at
To. There is a second maximum at the end of the expansion phase before δh0F drops to a minimum 2–3 h after ending the expansion phase. For positive substorms, the timing of the first maximum of the δfoF2 and δh0F values depends on the substorm length – if it is longer, the position is closer to
To. The effects on the ionosphere are significant: 1foF2 and
1h0F reach 2–3 MHz (δfoF2 = 50–70% from median value) and 50–70 km (δ h0F = 20–30% from median value), respec-tively. Regular patterns of occurrence ahead of the first sub-storm signature on the magnetometer offer an excellent pos-sibility to improve short-term forecasting of radio wave prop-agation conditions.
Key words. Ionosphere (ionospheric disturbances) –
Mag-netospheric physics (storms and substorms) Radio science (ionospheric physics)
Correspondence to: D. V. Blagoveshchensky
(dvb@aanet.ru)
1 Introduction
Reconnection at the dayside magnetopause results in open flux being transported into the geomagnetic tail. When there is a significant accumulation of open flux, instability occurs and there is major reconfiguration of the tail. The latter part of the cycle is known as the substorm that begins at 6–10 RE (Lui, 1991). It is preceded by a growth phase, which can last
∼1–2 h. A dramatic brightening of the aurora, the establish-ment of the substorm current wedge and a Pi2 pulsation mark the beginning of the expansion phase. The third and final el-ement of the substorm is the recovery phase that begins after the maximum deviation of the magnetometers near midnight in the auroral oval. Despite the substorm being described first nearly 40 years ago (Akasofu, 1968), detailed understanding of the physical processes and their ionospheric consequences are not well understood. This is certainly due in part to the fact that no two substorms are identical, and many substorms are actually the superposition of several expansion phases, making interpretation complex.
Early in the papers (Blagoveshchensky et al., 1992, 1996; Blagoveshchensky and Borisova, 2000) the effect of the max-imum useable frequency (MUF) variations on the HF radio paths during substorms was revealed. Effect essence is in-creasing the MUF values some hours before the moment To, decreasing those during the substorm expansive phase and in-creasing the MUF values again within some hours during the recovery phase. The purpose of this paper is to examine the temporal and spatial behaviour of foF2, the maximum plasma frequency of the F2-layer, and h0F, the virtual height of the F-layer (Piggott and Rawer, 1978), during isolated substorm in-tervals, to identity consistent features that could be used for ionospheric modelling and for radio-wave propagation cal-culations. Special attention will be given to the ionospheric parameter behaviour before substorm.
2 Data used and substorm parameters
Hourly values of foF2 and h0F derived from ionosonde data from Ionospheric Despatch Centre in Europe (IDCE) (Stanislavska el al., 1998) and some Finnish observatories
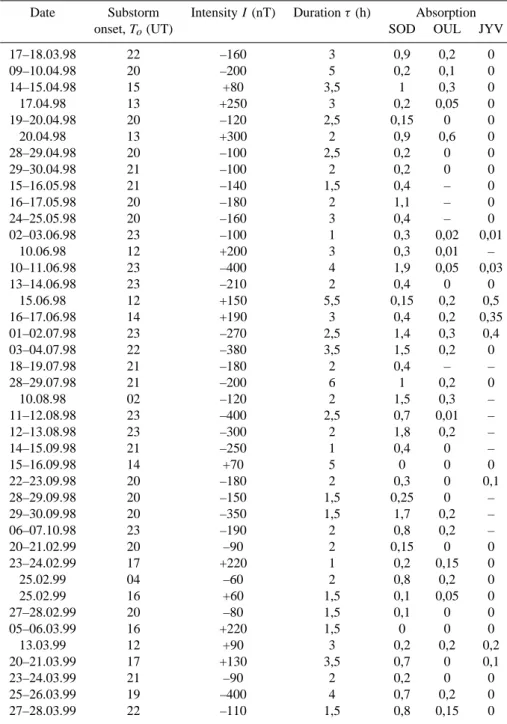
Table 1. Parameters of substorms by Sodankyla observatory
Date Substorm Intensity I (nT) Duration τ (h) Absorption
onset, To(UT) SOD OUL JYV
17–18.03.98 22 –160 3 0,9 0,2 0 09–10.04.98 20 –200 5 0,2 0,1 0 14–15.04.98 15 +80 3,5 1 0,3 0 17.04.98 13 +250 3 0,2 0,05 0 19–20.04.98 20 –120 2,5 0,15 0 0 20.04.98 13 +300 2 0,9 0,6 0 28–29.04.98 20 –100 2,5 0,2 0 0 29–30.04.98 21 –100 2 0,2 0 0 15–16.05.98 21 –140 1,5 0,4 – 0 16–17.05.98 20 –180 2 1,1 – 0 24–25.05.98 20 –160 3 0,4 – 0 02–03.06.98 23 –100 1 0,3 0,02 0,01 10.06.98 12 +200 3 0,3 0,01 – 10–11.06.98 23 –400 4 1,9 0,05 0,03 13–14.06.98 23 –210 2 0,4 0 0 15.06.98 12 +150 5,5 0,15 0,2 0,5 16–17.06.98 14 +190 3 0,4 0,2 0,35 01–02.07.98 23 –270 2,5 1,4 0,3 0,4 03–04.07.98 22 –380 3,5 1,5 0,2 0 18–19.07.98 21 –180 2 0,4 – – 28–29.07.98 21 –200 6 1 0,2 0 10.08.98 02 –120 2 1,5 0,3 – 11–12.08.98 23 –400 2,5 0,7 0,01 – 12–13.08.98 23 –300 2 1,8 0,2 – 14–15.09.98 21 –250 1 0,4 0 – 15–16.09.98 14 +70 5 0 0 0 22–23.09.98 20 –180 2 0,3 0 0,1 28–29.09.98 20 –150 1,5 0,25 0 – 29–30.09.98 20 –350 1,5 1,7 0,2 – 06–07.10.98 23 –190 2 0,8 0,2 – 20–21.02.99 20 –90 2 0,15 0 0 23–24.02.99 17 +220 1 0,2 0,15 0 25.02.99 04 –60 2 0,8 0,2 0 25.02.99 16 +60 1,5 0,1 0,05 0 27–28.02.99 20 –80 1,5 0,1 0 0 05–06.03.99 16 +220 1,5 0 0 0 13.03.99 12 +90 3 0,2 0,2 0,2 20–21.03.99 17 +130 3,5 0,7 0 0,1 23–24.03.99 21 –90 2 0,2 0 0 25–26.03.99 19 –400 4 0,7 0,2 0 27–28.03.99 22 –110 1,5 0,8 0,15 0
are used. The former includes data from 19 stations in Eu-rope and from western Asia.
The northward (X) components of the magnetic field from Sodankyla (67.4◦N), Oulujarvi (64.5◦N), Hankasalmi (62.3◦N) and Nurmijarvi (60.5◦N) are used to determine the onset time of the expansion phase, To, determined to an accu-racy of 0.25 h. Isolated substorms are those where no other substorm has been identified for > 6 h prior to, or follow-ing the one selected. The identification of the substorm was checked by examining other data sets. These included pre-liminary AE-indices from the Kyoto WDC-C2, P C-indexes
from Thule and Vostok stations (Troshichev et al., 1988), and riometer data from Sodankyla (f = 30 MHz), Oulujarvi (f = 30 MHz) and Jyvaskyla (f = 32.4 MHz). During the interval March 1998 to March 1999, 41 isolated substorms of moderate intensity were identified. Their intensity, I , varied between 60–400 nT, where I is the magnetic field value in the maximum of bay. There were 12 positive and 29 nega-tive substorms. Posinega-tive and neganega-tive indicate when the mag-netic observatories were under the influence of the eastward and westward electrojet, respectively. The duration of the substorm is defined as the time between Toand Te, the time
D. V. Blagoveshchensky et al.: Ionosphere dynamics over Europe and western Asia 1143
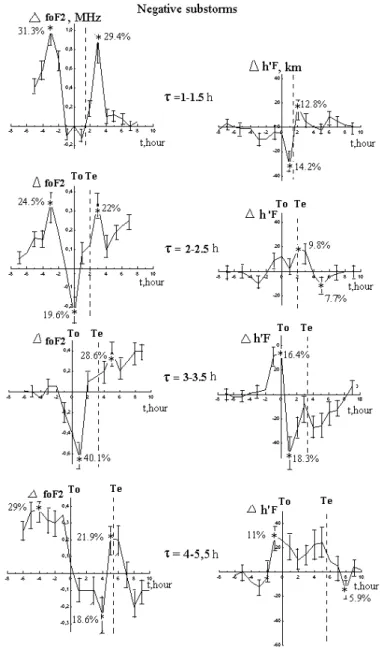
Fig. 1. The average variations of 1foF2 and 1h0F separated by duration into 4 classes: τ = 1 − 1.5 h, τ = 2 − 2.5 h, τ = 3 − 3.5 h, and
τ =4 − 6 h. The vertical lines mark substorm onset, To, and the average end of the substorm. Te. Asterisks are δfoF2 (%) and δh0F(%)
values.
when the magnetic disturbance level has returned to the pre-substorm level. The Tovalues and duration of the substorm expansion phase are listed in Table 1. Key findings from the table are:
– For positive substorms, To occurs uniformly between 12:00 UT and 17:00 UT.
– For negative substorms, To values occur over a wider interval (19:00–04:00 UT), but the probability distribu-tion has two maxima, at 20:00 UT (Probability P = 0.35) and 23:00 UT (P = 0.25).
– The duration of the expansion phase of positive
sub-storms (τ ) ranges between 1 and 5.5 h, and 1–6 h for negative substorms.
– The values of 1foF2 and 1h0F during a substorm can reach the sizes |1foF2| = 2 − 3 MHz (i.e. δfoF2 = 50– 70% from median value) and |1 h0F| = 50 − 70 km (i.e.
δ h0F = 20–30% from median value).
– The average intensity of positive substorms has
maxi-mum at 13:00 UT and at 23:00 UT for negative storms, both with I = 275 nT.
For positive substorms, the intensity of absorption bays is generally lower than for negative ones with the same mag-netic intensity. Also for positive substorms, the absorption bay is delayed relative to the magnetic field bay by about 1 h, a time consistent with injected energetic electrons at mid-night drifting eastwards under the actions of gradient and cur-vature drift. Absorption usually diminishes with decreasing
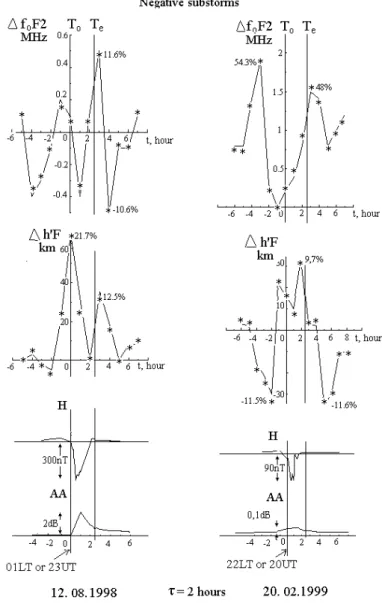
Fig. 2. The variations of 1foF2,MHz and 1h0F, km (only solid lines) for two negative substorms, together with the corresponding variations of the X-component and absorption measured at the Sodankyla observatory. The vertical lines mark substorm onset, To, and the end of the
substorm, Te. Asterisks are δfoF2 (%) and δh0F (%) reduced to the maximum value.
latitude in the range 3 = 67.4◦−62.3◦for both positive and negative substorms. Variations of the magnetic field compo-nents X, Y and Z during substorm-time change little with latitude in the range 3 = 67.4◦−60.5◦, i.e. the shape of the bays remains approximately constant and the amplitude diminishes only slightly from high to low latitudes.
3 Analysis of the ionospheric parameters
Most attention has been concentrated on the changes of two ionospheric parameters foF2 and h0F during substorms. Vari-ations of these hourly parameters relative to the monthly me-dians, namely 1foF2 and 1h0F, have been determined for 6 h before the time of onset, To, to 6 h after the end of the sub-storm (Te). Three approaches have been adopted. First data from a single station (Sodankyla) are used to determine the
variations of 1foF2 and 1h0F during negative and positive substorms. The second analysis addresses the variations of the ionospheric parameters with latitude using data from one chain of 5 stations. The third analysis examines the spatial and temporal effects using data from three chains of stations. The Sodankyla data were considered for negative and pos-itive substorms separately. The negative substorms selected are considered in four groups based on their duration, (τ ) (Ta-ble 1). These groups are (1) τ = 1 − 1.5 h (7 substorms); (2)
τ =2−2.5 h, (15); (3) τ = 3−3.5 h, (3), and (4) τ = 4−6 h (4). For the 12 positive storms only three groups were cre-ated – (1) τ = 1 − 2 h (4 substorms); (2) τ = 3 − 3.5 h (6), and (3) τ = 5 − 5.5 h (2). According to these data, the neg-ative substorms of τ = 2 − 2.5 h duration and the positive substorms of τ = 3 − 3.5 h duration have the highest proba-bility (P = 0.5). This analysis did not include any data from the winter months (November–February). This is because
D. V. Blagoveshchensky et al.: Ionosphere dynamics over Europe and western Asia 1145
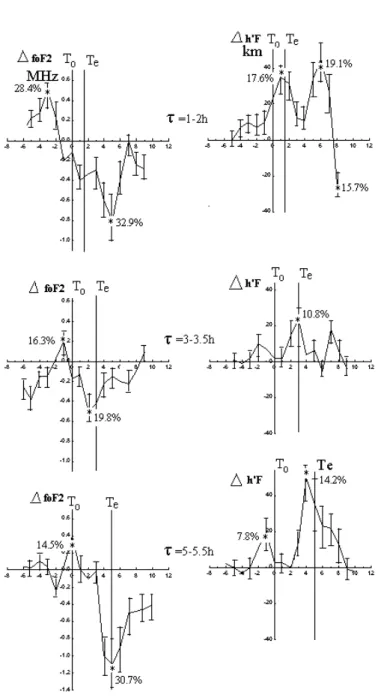
Fig. 3. The average variations of 1foF2 and 1h0F separated by duration into 3 classes: τ = 1 − 2 h, τ = 3 − 3.5 h, and τ = 5 − 5.5 h. The vertical lines mark substorm onset, Toand the average end of the substorm, Te. Asterisks are δfoF2 (%) and δh0F(%) values.
the data were largely absent owing to blackout or screening by sporadic-E.
The average variations of parameters 1foF2 and 1h0F during negative substorms of the four duration groups are shown in Fig. 1. Vertical lines mark the onset time of the ex-pansion, To, and Te. From 6–8 h before To, the 1foF2 values increase up to maximum 2–3 h before Tofor all four groups. Then up to Tothere is a sharp decline in 1foF2 to a minimum near To, with a further rise taking place during the expansion phase. The second maximum occurs < 2 h after Te. There-after, 1foF2 become more irregular. The existence of two maxima before Toand after Teand the minimum near Tois a
clear substorm effect.
Changes in 1h0F have a different character. There is a small minimum 3–4 h before To, and a first maximum about
To, in most cases. Then 1h0F values drop to a minimum within the expansion phase and increase to the end of this phase again. The second maximum occurs near Te, then
1h0F falls to a second minimum 2–3 h after Te.
Figure 2 gives the 1foF2 and 1h0F values for two specific substorms that occurred on 12 August 1998 and on 20 Febru-ary 1999; these are examples from the most probable class of substorm with τ = 2 − 2.5 h. These data demonstrate that individual substorm patterns of 1foF2 and 1h0F conform to
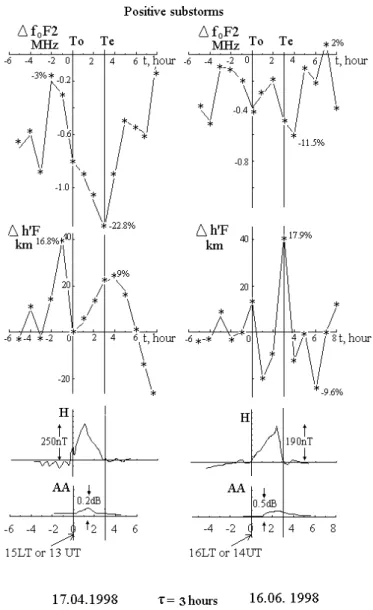
Fig. 4. The variations of 1foF2, MHz and 1h0F, km (only solid lines) for two positive substorms, together with the corresponding variations of the X-component and absorption measured at the Sodankyla observatory. The vertical lines mark substorm onset, To, and the end of the
substorm, Te. Asterisks are δfoF2 (%) and δh0F (%) reduced to the maximum value.
the general pattern shown in Fig. 1. The lower part of Fig. 2 shows the X-components of geomagnetic field variations and the riometer absorption curves from the Sodankyla observa-tory.
The average variations of parameters 1foF2 and 1h0F during positive substorms separated by duration τ are shown in Fig. 3. They show some differences from the negative substorms illustrated in Figs. 1 and 2. Here, the timing of the maximum 1foF2 that occurs before Todepends on substorm duration; the longer the duration of the substorm, the closer the maximum occurs to To. 1foF2 reaches a minimum close to the end of the expansion phase, Te. For the shortest du-ration substorms, the minimum 1foF2 is 2–3 h after Te. All
1foF2 show signs of recovery ∼5 hours after Te.
There is a small maximum of 1h0F before To, that occurs closer to Toif the substorm is longer. By far the most signif-icant and consistent feature is a peak of 1h0F close to Te.
Figure 4 illustrates two positive substorms (for 17 April 1998 and 16 June 1998). The variations of 1foF2 and 1h0F values of these substorms agree with the average curves presented in Fig. 3 for disturbances with duration of τ = 3 − 3.5 h. The lower part of Fig. 4 shows the X-component of geomagnetic field variations and the riometer absorption curves from Sodankyla. Here there is a delay of the absorp-tion bay onset by 1–1.5 h relative to To. No such delay is present for negative substorms (Fig. 2). As mentioned earlier, the delay can be attributed to the effects of energetic elec-trons injected near midnight, gradient and curvature drifting eastwards into the afternoon sector.
To determine the latitude variations of the parameter
1foF2 during substorms, data from a chain of stations
com-prising Kiruna, Lycksele, Uppsala, Warsaw and Sofia were examined. Much 1h0F data were absent from these observa-tories and, therefore, its latitude response could not be
deter-D. V. Blagoveshchensky et al.: Ionosphere dynamics over Europe and western Asia 1147
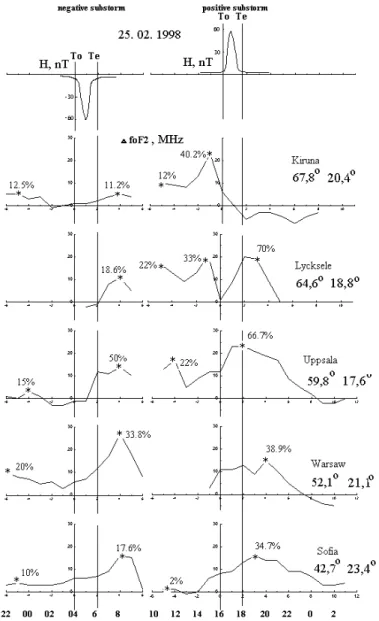
Fig. 5. The variations of the X-component magnetometer data from Sodankyla observatory for a positive and negative substorm that occurred
on 25 February 1998, together with variations of 1foF2 from Kiruna, Lycksele, Uppsala, Warsaw and Sofia (LT = UT + 2). The vertical lines mark substorm onset, To, and the end of the substorm, Te. Asterisks are δfoF2 (%) values.
mined. Two positive and three negative substorms for Febru-ary 1999 have been analysed in detail.
On 25 February 1999, two isolated substorms took place and are illustrated in Fig. 5. Toof the negative substorm was at 04:00 UT (06:00 LT) with Teat 06:00 UT (08:00 LT), thus its duration, τ , was 2 h. The intensity I was −60 nT. The second substorm was positive with duration τ = 1.5 h and intensity I = +60 nT, with To= 16:00 UT (18:00 LT) and Te = 18:00 UT (20:00 LT). Data in Fig. 5 are typical; they de-scribe the general regularities obtained by the five substorms studied. Basic results are as follows:
– Although the intensities of the substorms are small,
1foF2 variations are observed at all stations considered
from 6 h before Toand ∼ 8 h after Te.
The 1foF2 variations for the negative substorm differ from the positive substorm most at high latitudes (3 > 50◦). At
middle and low latitudes (3 < 50◦) differences are small. For the northernmost ionospheric station, Kiruna, the 1foF2 variations repeat the average statistical regularities of So-dankyla presented in Fig. 1 for τ = 2 − 2.5 h, and Fig. 3 for
τ =1 − 2 h. This is hardly surprising given that the stations are close to each other but does confirm again the reliability of the averaged data. At high latitudes (> 60◦) for negative and positive substorms, 1foF2 rises and falls, occuring both 1–3 h before Toand 1–3 h after Te.
– At middle and low latitudes ionospheric responses to
negative and positive substorms are similar to each other. A small rise in 1foF2 starts before To, and reaches a maximum near or slightly after Te before falling steadily towards the pre-substorm values.
Fig. 6. The variations of 1foF2 values for the negative substorm
that occurred on 27 March 1999 (To= 22:00 UT or 00:00 LT, I = −110 nT, τ = 1.5 h) through the first (northern) longitudinal chain of stations of the IDCE, LT = UT + 2. The vertical lines mark substorm onset, To, and the end of the substorm, Te. Asterisks are δfoF2 (%) values.
3 MHz) at the latitude 3 = 55◦. Moreover, at high lat-itudes, the 1foF2 values can be both positive and nega-tive but at middle and low latitudes they are all posinega-tive. To determine the spatial and temporal effects, individual substorms from March 1999 (see Table 1) were examined. The data from the network of ionosonde stations are con-sidered in three groups. The first includes 7 stations over an extended latitude range but within longitudinal interval
±5◦, stretching from Kiruna (67.8◦N), through Lycksele, Uppsala, Juliusruh, Warsaw, Pruhonice to Sofia (42.7◦N). A second latitude chain, but at lower latitudes and ∼15◦ fur-ther east includes Slough (51.5◦N), Lannion, Tortosa and El Arenosillo (37.1◦N). A third chain were at a fixed latitude (±3◦) and extended in longitude from Uppsala (17.6◦E), through St. Petersburg, Sverdlovsk, Novosibirsk to Podka-mennaya (90◦E). In addition, data from Salekhard (66.5◦; 66.5◦) and Taoywan (25◦; 121◦) were examined. Occasion-ally, data from a few stations were not available. These net-works cover most of Europe and western Asia.
The 1foF2 variations for two illustrative substorms – a negative one on 27 March 1999 (To = 22:00 UT, I =
Fig. 7. The variations of 1foF2 values for the negative substorm
that occurred on 27 March 1999 (To= 22:00 UT or 22:00 LT, I = −110 nT, τ = 1.5 h) through the second (southern) longitudinal chain of stations of the IDCE, LT = UT. The vertical lines mark substorm onset, To, and the end of the substorm, Te. Asterisks are δfoF2 (%) values.
−110 nT and τ = 1.5 h), and a positive one on 5 March 1999 (To= 16:00 UT, I = +220 nT, τ = 1.5 h) are presented in Figs. 6–8, and Figs. 9–11, respectively for the three chains of stations. The key results are summarised below as follows.
The character of the 1foF2 variations with latitude (Fig. 6–10) during negative and positive substorms is approx-imately the same. The important features are the increase in
1foF2 6–8 h before To, then dropping to a minimum near
Te, thereafter increasing again to a maximum 1foF2∼4–5 h later. This illustrates the large latitudinal spread of substorm effects.
Substorm effects are clearer and more pronounced for neg-ative substorms than for positive ones, even though the inten-sity of the positive substorm is twice that of the negative one. Also for positive substorms, 1foF2 values are mainly neg-ative at latitudes > 50◦. At low latitudes (< 50◦) they are both negative and positive (Figs. 9 and 10).
Analysis of all the March substorms reveals that at a sin-gle station some differences in the 1foF2 variations which occur from one substorm to another are probably associated with their different intensities, Toand τ values, and whether the substorm is positive or negative. However, for latitudes
<50◦, the 1foF2 variations are remarkably similar and sta-ble, both between themselves for a single substorm and for substorms of different intensity and sign (e.g. Figs. 7 and
D. V. Blagoveshchensky et al.: Ionosphere dynamics over Europe and western Asia 1149
Fig. 8. The variations of 1foF2 values for the negative substorm
that occurred on 27 March 1999 (To= 22:00 UT, I = −110 nT, τ = 1.5 h) through the latitudinal chain of stations of the IDCE, Upp.: LT = UT + 2, St. P.: LT = UT + 3, Pod.: LT = UT + 8. The vertical lines mark substorm onset, To, and the end of the substorm, Te. Asterisks are δfoF2 (%) values.
10). Therefore, the latitude 3 ≈ 50◦can be considered as a boundary between the less stable area to the north and a more stable area to the south of 50◦N. Hence, these differ-ences with latitude may be important for developing accurate forecasting of substorm effects.
The variations of 1foF2 with longitude are remarkably small (Figs. 8 and 11), illustrating, that the effects can extend over 70◦in longitude. The 1foF2 variations from Salekhard are similar to the variations on the longitude chain but results from Taoywan are very different in character. This may be due to the fact that the substorm effects do not extend this far east, or the tilted auroral oval with respect to magnetic local time means that the station lies too far from oval at the time of the substorm for effects to be detected.
Data of the IMAGE magnetometer network were used in addition to analysis of the March substorms. These data al-low one to determine a location of electrojet during any sub-storm. The location of the electrojet center can be defined from the examination of the peculiarities in the behavior of the X and Z magnetic components. Maximal negative values of the X component and Z = 0 (reversal of the Z component
Fig. 9. The variations of 1foF2 values for the positive substorm
that occurred on 05 March 1999 (To= 16:00 UT or 18:00 LT, I = +220 nT, τ = 1.5 h) through the first (northern) longitudinal chain of stations of the IDCE, LT = UT + 2. The vertical lines mark substorm onset, To, and the end of the substorm, Te. Asterisks are δfoF2 (%) values.
from positive to negative values) are indicative for the cen-ter’s westward electrojet location. Results of studies for the events considered here are as follows.
– The westward electrojet was centered at the invariant
latitude 8L=65◦(or geographic latitude ϕ = 69◦) for the substorm event on 27 March 1999. Southward from this latitude, the direction of electrojet remains west-ward but its intensity decreases.
– The westward electrojet has its maximal value at the
invariant latitude 8L = 72◦ (or geographic latitude
ϕ = 76◦) for the substorm event on 5 March 1999. However, to south from this latitude its direction be-comes eastward. There are positive values of the X component on the contrary to the event on 27 March 1999.
It is worth mentioning that for examined substorm events, the onsets of auroral activation from the IMAGE data and from the AE-index, characterized by the global auroral ac-tivity, are coincided. Therefore, the auroral substorms started at the meridian of the IMAGE magnetometer network.
Fig. 10. The variations of 1foF2 values for the positive substorm
that occurred on 05 March 1999 (To= 16:00 UT or 16:00 LT, I = +220 nT, τ = 1.5 h) through the second (southern) longitudinal chain of stations of the IDCE, LT = UT. The vertical lines mark substorm onset, To, and the end of the substorm, Te. Asterisks are δfoF2 (%) values.
4 Possible physical mechanism for the explanation of observations
Here, the physical mechanisms that may cause the observed features are briefly discussed. One of the main results is that positive 1foF2 variations are observed for many hours be-fore substorm onset. This is difficult to understand as the time between a southward turning after a period of geomag-netic quiescence and a substorm is typically 1–2 h. However, it must be recalled that 1foF2 variations are determined by subtracting the median ionospheric conditions, and this may not be appropriate for such quiet conditions. Future studies will assess the validity of using medians.
The probability of substorms with about 5 h between any two separated substorms is low and there are the maximum 20 “clear” isolated substorms in a year (Borovsky et al., 1993). In our case we have 41 isolated substorms in the year. Therefore, these observations may have some residuals ef-fects from previous disturbances. Development of isolated substorms could be controlled by the behaviour of the ε-parameter (Akasofu, 1968) which begins to grow some hours before To (Freeman et al., 1993; Kerns and Gussenhoven,
Fig. 11. The variations of 1foF2 values for the positive substorm
that occurred on 05 March 1999 (To= 16:00 UT, I = +220 nT, τ = 1.5 h) through the latitudinal chain of stations of the IDCE, Upp.: LT = UT + 2, St. P.: LT = UT + 3, Sv.: LT = UT + 6, Now.: LT = UT + 7. The vertical lines mark substorm onset, To, and the
end of the substorm, Te. Asterisks are δfoF2 (%) values.
1990) but analysis of the IMF data for these substorms has not yet been undertaken.
The observed variations of 1foF2 may be associated with the effects of the energy and momentum transfer from the so-lar wind to the magnetosphere and ionosphere. In particuso-lar, increased fluxes of soft particle precipitation in the midday cusp, and Joule heating may affect thermospheric composi-tion and circulacomposi-tion. The changes in the ratio [0]/[N2] can be transported to lower latitudes and across the polar cap by the neutral wind (Danilov and Belik, 1991). This effect can precede the onset of a substorm by several hours. However, more observations will be required to determine the physical processes responsible for the pre-onset disturbances. After
To, the variations of 1foF2 and 1h0F obey the traditional transfer scheme corresponding to the tail modification, au-roral precipitation, heating, TIDs propagation, ring current and so on, as described by several authors (see, for example, Fuller-Rowell et al., 1994).
D. V. Blagoveshchensky et al.: Ionosphere dynamics over Europe and western Asia 1151
5 Conclusions
Using the data from 19 ionospheric and some geomagnetic observatories, the spatial variations of the height and max-imum plasma frequency of the F2-layer have been deter-mined for 41 isolated substorm intervals. The observatories extend all over Europe and western Asia. The substorms were selected because they had a sharp onset, lasted a few hours and occurred during a several hour period of geomag-netic quiet both before and after the study interval. The sub-storms had intensities of I ≥ 50 nT. Very intense subsub-storms (I > 500 nT) are not included in the analysis, due to the effects of a strong absorption and sporadic Es-layers which prevent F-region observations. The key findings are as fol-lows:
1. Substorm effects in the ionosphere occur simultane-ously (1 h resolution) almost all over Europe and the western part of Asia.
2. Negative substorms. (i) The 1foF2 values increase
> 6 h before substorm onset, To, with a maximum 2– 3 h before To. 1foF2 falls during the expansion phase which is then followed by a second maximum 1–2 h af-ter the end of the expansion phase. (ii) The 1h0F values 3–4 h before Tohave a little minimum but then increase to a maximum at To. There is a second maximum at the end of the expansion phase.
3. Positive substorms. The timing of the first maximum of the 1foF2 and 1h0F values depends on the substorm length – if it is longer, the peak is closer to To.
4. The values of the ionospheric parameters 1foF2 and
1h0F during a substorm-time can reach the sizes
|1foF2| = 2–3 MHz (δfoF2 = 50–70% from median
value) and |1h0F| = 50–70 km (δh0F = 20–30% from median value). The additional final goal is to find the physical mechanisms of the mentioned effect from the point of view of the solar-magnetospheric-ionospheric coupling.
5. The variations of 1foF2 and 1h0F can affect signifi-cantly radio-wave propagation via the ionosphere and explain the MUF variations obtained early on the HF paths, but the regular pattern of occurrence with re-spect to the time of the expansion phase onset offers an excellent possibility to improve short-term forecast-ing of radio-wave propagation conditions. Furthermore, we are going to reveal some methods and algorithms of forecasting the onset of the substorm expansion phase.
Acknowledgements. The authors wish to thank colleagues from
Finland, Kyoto WDC-C2 (AE-indexes) and the IDCE for provid-ing their data through the Internet. This work was supported by funding from the grant EST.CLG 975263.
Topical Editor M. Lester thanks two referees for their help in evaluating this paper.
References
Akasofu, S.-I.: Polar and magnetospheric substorms, Dordrecht, D. Reidel, 137p., 1968.
Blagoveshchensky, D. V. and Borisova T. D.: Substorm effects of ionosphere and HF propagation, Radio Sci, 35, 5, 1165–1171, 2000.
Blagoveshchensky, D. V., Egorova, L. V., and Lukashkin, V. M.: High-latitude ionospheric phenomena diagnostics by high-frequency radio wave propagation observations, Radio Sci., 27, 2, 267–274, 1992.
Blagoveshchensky, D. V., Borisova, T. D., and Egorova, L. V.: Pre-and after-substorm situations in the ionosphere Pre-and decameter ra-dio wave propagation, Geomagn. Aeron., 96, 4, 125–134, 1996. Borovsky, J. E., Wemzek R. J., and Belian, R. D.: The
occur-rence rate of magnetospheric substorms, J. Geophys. Res., 98, A3, 3807–3813, 1993.
Danilov, A. D. and Belik, L. D.: Thermosphere-ionosphere cou-pling during ionospheric storms (review), Geomagn. Aeron., 31, 2, 209–221, 1991.
Freeman, M. P., Farrugia, C. J., Burlaga, L. F., et al.: The interaction of a magnetic cloud with the Earth: Ionospheric convection in the northern and southern hemispheres for a wide range of quasi-steady interplanetary magnetic field conditions, J. Geophys. Res., 98, A5, 7633–7655, 1993.
Fuller-Rowell, T. J., Codrescu, M. V., Moffett, R. J., and Quegan, S.: Response of the thermosphere and ionosphere to geomagnetic storms, J. Geophys. Res., 99, 3893–3914, 1994.
Kerns, K. J. and Gussenhoven, M. S.: Solar wind conditions for a quiet magnetosphere, J. Geophys. Res., 95, A6, 20 867–20 875, 1990.
Lui, A. T. Y.: A synthesis of magnetospheric substorm models, J. Geophys. Res., 96, 1849–1856, 1991.
Piggott, W. R. and Rawer, K.: U.R.S.I handbook of ionogram inter-pretation and reduction, UAG-report 23 A, National Geophysical Data Center, Boulder, U.S.A., 1978.
Stanislavska, I., Gulyaeva, T. L., and Hanbaba, R.: Ionospheric Despatch Centre in Europe (IDCE), Proceedings of the 2nd COST 251 Workshop “Algorithms and Models for COST 251 Final Product”, 30–31 March 1998, Side, Turkey. CLRC RAL, Chilton, Didcot, UK, 27–30, 1998.
Troshichev, 0. A., Andrezen, V. G, Vennerstrom, S., and Friis-Christensen, E.: Magnetic activity in the polar cap – a new index, Planet. Space Sci., 36, 1095–1102, 1988.