HAL Id: hal-03047322
https://hal.archives-ouvertes.fr/hal-03047322
Submitted on 8 Dec 2020
HAL is a multi-disciplinary open access
archive for the deposit and dissemination of
sci-entific research documents, whether they are
pub-lished or not. The documents may come from
teaching and research institutions in France or
abroad, or from public or private research centers.
L’archive ouverte pluridisciplinaire HAL, est
destinée au dépôt et à la diffusion de documents
scientifiques de niveau recherche, publiés ou non,
émanant des établissements d’enseignement et de
recherche français ou étrangers, des laboratoires
publics ou privés.
in eastern China using self-organizing map
Mei Li, Zhihong Jiang, Pu Zhou, Hervé Le Treut, Laurent Li
To cite this version:
Mei Li, Zhihong Jiang, Pu Zhou, Hervé Le Treut, Laurent Li. Projection and possible causes of summer
precipitation in eastern China using self-organizing map. Climate Dynamics, Springer Verlag, 2020,
54 (5-6), pp.2815-2830. �10.1007/s00382-020-05150-4�. �hal-03047322�
1
Projection and Possible causes of Summer Precipitation in
Eastern China Using Self-Organizing Map
Mei Li1; Zhihong Jiang1; Pu Zhou2; Hervé Le Treut3; Laurent Li3
1Key Laboratory of Meteorological Disaster of Ministry of Education, Collaborative Innovation Center
on Forecast and Evaluation of Meteorological Disasters, Nanjing University of Information Science and Technology, Nanjing, 210044, China
2Fengxian Meteorological Service, Fengxian district Shanghai, China
3Laboratoire de Météorologie Dynamique, IPSL, CNRS, Sorbonne Université, Ecole Normale
Supérieure, Ecole Polytechnique, Paris, France
Corresponding Author: Zhihong Jiang, E-mail: [email protected]
86-025-58731135
Accepted manuscript for Climate Dynamics 2020-01
Acknowledgments
We acknowledge the climate modeling groups listed in Table 1 of this paper for making their simulations available, the PCMDI for collecting and archiving the CMIP5 model output, and World Climate Research Programme’s Working Group on Coupled Modeling. This study is supported by the National Key Research and Development Program of China (2017YFA0603804, 2018YFC1507704), and the National Natural Science Foundation of China (41675081). L Li and H Le Treut acknowledge the support of French ANR (Project China-Trend-Stream). Three anonymous reviewers are acknowledged for their constructive comments to improve an earlier version of the manuscript. The authors also declare that they have no conflict of interest.
2 Abstract
Self-organizing map (SOM) is used to simulate summer daily precipitation over the Yangtze-Huaihe river basin in Eastern China, including future projections. SOM shows good behaviors in terms of probability distribution of daily rainfall and spatial distribution of rainfall indices, as well as consistency of multi-model simulations. Under RCP4.5 Scenario, daily rainfall at most sites (63%) is projected to shift towards larger values. For the early 21st century (2016-2035), precipitation in the central basin increases, yet
decreases occur over the middle reaches of the Yangtze River as well as a part of its southeast area. For the late 21st century (2081-2100), the mean precipitation and extreme indices experience an overall
increase except for a few southeast stations. The total precipitation in the lower reaches of the Yangtze River and in its south area is projected to increase from 7% at 1.5°C global warming to 11% at 2°C, while the intensity enhancement is more significant in southern and western sites of the domain. A clustering allows to regroup all SOM nodes into four distinct regimes. Such regional synoptic regimes show remarkable stability for future climate. The overall intensification of precipitation in future climate is linked to the occurrence-frequency rise of a wet regime which brings longitudinally closer the South Asia High (eastward extended) and the Western Pacific Subtropical High (westward extended), as well as the reduction of a dry pattern which makes the two atmospheric centers of action move away from each other.
Keywords: climate change, precipitation projection, statistical downscaling, physical explanations, Self-organizing map
3
1. Introduction
A changing climate significantly impacts the frequency, intensity and duration of weather and climate extremes. And there are strong regional variations in the trends of these extreme events (IPCC 2013). Although global climate models (GCMs) are powerful tools for climate simulation and future climate projection at global scale, they can be hardly applied to regional climate issues due to their low spatial resolutions which do not allow to appropriately take into account complex regional terrains (Wilby et al. 2004; Gao et al. 2006). Especially for investigations on surface hydrology or water resources (Xu et al. 2004) that need high-quality precipitation as input, more precise and reliable regional information is indispensable. We need thus to perform climate downscaling, either with a dynamical regional model, or with a statistical methodology. Statistical downscaling generally tries to establish a statistical relationship between large-scale atmospheric circulation (considered as reliable from GCMs) and regional or even local climate condition (considered as of poor performance in GCMs). Compared to dynamical downscaling, statistical downscaling is less intensive for computational resources and easier to be setup for multiple simulations with different GCMs.
Many statistical approaches have been proposed and tested in the past, either to determine mean climate or synoptic variability (Wilby et al. 2004; Fowler et al. 2007; Fan et al. 2005; Chen et al. 2012; Salvi et al. 2013; Wu et al. 2016). But as shown by Wilby et al. (2004) and Fowler et al. (2007), most of them tend to underestimate variance and represent poorly extreme events. A remedial technique, known as Self-Organizing Map (SOM), proposed by Kohonen (1982, 1990), has been introduced into the field of climate downscaling by Hewiston & Crane (2006). It can overcome a few limitations of commonly-used statistical methods and improve the simulated variance (Yin et al. 2011). Hewiston & Crane (2006) used SOM for the first time in doing statistical downscaling of climate and conducted a daily precipitation simulation in South Africa by constructing the link between atmospheric states and daily rainfall probability distribution functions (PDFs). Utilization of SOM as a climate downscaling tool has also been used for Southeast Australia and the eastern coast of the United States. Yin et al. (2011) applying the same downscaling method to rainfall simulation in Southeast Australia showed that the statistical downscaling approach based on SOM was able to reproduce main statistical characteristics of the observation, including properties of extreme precipitation. Ning et al. (2012a, b) constructed a SOM-based climate downscaling model from NCEP reanalysis and rainfall measurements from 17 stations in Pennsylvania situated in the mid-Atlantic region of the United States. After training and validating the
4
SOM model, they selected 9 global models and used them to drive the pre-trained SOM model to simulate precipitation for the historical period and for a future period from 2046 to 2065. They showed that the downscaling algorithm was able to reproduce major characteristics of the observed precipitation, and with much reduced biases compared to raw GCM-simulated precipitation.
Since SOM links synoptic patterns and daily precipitation together, physical mechanisms of precipitation variation could be explored with the help of these patterns. For instance, Hope et al. (2006) explored the SOM nodes (20 different synoptic types) performed on sea-level pressure in southwest Western Australia. They examined the changes of occurrence frequency of these types which are linked to rainfall or dryness, and they formulated a convincing explanation for the significant and prolonged rainfall drop observed in southwest Western Australia since 1975. In fact, the dryness is due to less-frequent occurrence of a local synoptic trough structure for sea-level pressure. Hope (2006) furthermore analyzed the frequency changes of these SOM patterns in future scenarios as simulated in global climate models and concluded that the dryness in southwest Western Australia could be worsened in the future, since the synoptic conditions tend to shift to a situation with less troughs and more ridges in pressure under global warming. Verdon-Kidd et al. (2009) reported a similar investigation, but for Victoria, Australia in the southeast of the continent. In recognizing the dominant role of synoptic patterns (SOM nodes) for the regional precipitation, they furthermore investigated the correlation of these synoptic patterns to major global oscillations, such as the El Nino – Southern Oscillation, the Indian Ocean Dipole and the Southern Annular Mode. These researches showed excellent examples on diagnose of precipitation by SOM.
SOM was also used in a few studies on regional precipitation in China in relation to variations of synoptic patterns. Liu et al. (2016) used SOM as a large-scale circulation classification with daily 500-hPa geopotential height. Relevant synoptic patterns (18 nodes) were then linked to summer rainfall in the eastern and central Tibetan Plateau. They showed that large amount of precipitation in summer was closely related to the circulation types favorable to transporting abundant moisture to the region (e.g. enhanced and northward shifted subtropical high over the northwest Pacific and cyclonic circulation anomalies over the Bay of Bengal). The work of Liu et al. (2016) used a single atmospheric variable (500-hPa geopotential height) to search relevant SOM nodes. Clearly, it is also possible for SOM to explore synoptic patterns through multiple-variables.
5
In recent years, we also put many efforts in exploring SOM for climate downscaling in Eastern China. SOM was firstly used as a kind of clustering to evaluate the ability of 34 CMIP5 global models to reproduce atmospheric circulation patterns and their evolution in East Asia (Wang et al. 2015). The capability of SOM as a tool of statistical downscaling was then investigated in Zhou et al. (2016) with the establishment of a statistical relationship between atmospheric circulation from re-analysis ERA-40 and observed rainfall in Eastern China. It was shown that SOM had a satisfactory capability in simulating probability distribution properties of daily precipitation and its extreme statistics, but future projection was not investigated. In this work, we pursue our efforts in exploring SOM by extending Zhou et al. (2016) into a multi-model framework and performing climate projection for the 21st century with focus
on summer precipitation over the Yangtze-Huaihe river basin. Furthermore, we will perform additional diagnoses to investigate precipitation variation in relation to changes of synoptic patterns.
The rest of the paper is organized as follows: Section 2 describes the data and method that we used, Section 3 provides results on the establishment and multi-model evaluation of SOM. In Section 4, the ensemble mean and extreme daily precipitation over the basin domain in the 21st century are projected.
Section 5 explores the possible causes of the projection, and conclusions are summarized in Section 6.
2. Data and Method
2.1 Datasets
As in Zhou et al. (2016), the SOM downscaling model is trained with large-scale daily atmospheric circulation variables from ERA-40 (2.5°× 2.5°) and observed daily rainfall from 56 stations operated by the China Meteorological Administration (CMA) in Eastern and Central China covering the period 1961-2002. Only summer (June-August) is investigated. After being trained, SOM is applied to outputs of five GCMs for projection of future climate. They are BCC-CSM1.1m, MPI-ESM-MR, CNRM-CM5, NorESM1-M and MRI-CGCM3 from CMIP5 (Coupled Model Intercomparison Project, phase 5). A short summary of these models is shown in Table 1. Their selection is based on a balanced consideration among different factors: their performance in simulating regional atmospheric centers of action (Zhao et al., 2019), their spatial resolution and the availability of all necessary variables to drive SOM. The historical outputs of GCMs during 1986-2005 (considered as a validation or reference) and observed rainfall from CMA for the same period are employed to evaluate the efficiency of SOM. Future simulations under RCP4.5 scenario can be divided into two periods: the early (2016-2035) and late
6
(2081-2100) of the 21st century. Figure 1 shows our study area (27.5°-32°N, 110°-122.5°E) and location
of the stations in this region.
The selection of large-scale variables as predictors was largely inspired by Hewitson and Crane (2006), Chattopadhyay et al. (2008), Yin et al. (2011), Ning et al. (2012a), Borah et al. (2013) and Zhou et al. (2016), since our predictors selected to describe synoptic patterns are also sea level pressure (SLP), 2-m air temperature, specific humidity and relative humidity at hPa, u and v components of wind at 850-hPa, and lapse rate of temperature from 850 to 500-hPa. Among them, the 850-hPa humidity and surface temperature can reflect the water vapor availability, the lapse rate represents the vertical motion and instability, while moisture transport at low level is coded in wind components and sea level pressure. Daily synoptic situation is thus fully represented by these seven atmospheric variables. They are used to train the SOM model during the training stage and they are used as model inputs to predict daily rainfall when the SOM model is used to make downscaling with outputs from GCMs.
2.2 Self-organizing maps as a downscaling tool
SOM is an unsupervised artificial neural network model which can be typically depicted as a two-dimensional array of neurons and divided into input and output layers. The core algorithm includes two parts: one is to select the ‘winning node’ whose reference vector is the closest to the observation one following the principle of Euclidean distance minimization; and the other is to update the weight vectors of the winning node and its neighboring neurons (Kohonen, 1990; Hewiston and Crane, 2006). If we neglect its topological properties, SOM can behave in a similar way as the K-means clustering does, especially for the case of small number of SOM nodes.
Nevertheless, SOM is a powerful algorithm that can produce a large-number of nodes with smooth transition in their 2-dimensional plan. In the case of large number of SOM nodes (e.g. thousands of nodes), it is possible to perform clustering operations to obtain their emergent properties (Ultsch 2007) if the topological properties of SOM are not of main consideration. In this study, SOM was applied onto 56 stations close to each other, which produces 20x56 SOM nodes. We thus decided to perform a secondary-clustering operation (with K-means) to regroup SOM nodes into a small number of clusters, which helps us to clearly analyze the relationship between synoptic patterns and rainfall variation under global warming conditions. In our configuration, each station is treated separately. Daily atmospheric states around the station used as predictors are inputs to train SOM, and the SOM synoptic patterns are
7
output nodes for which we need to establish a probabilistic relation with precipitation. Before performing SOM, we divided the study area into a regular grid of 0.5 by 0.5 degrees. For each station, as in Ning et al. (2012a), we identified firstly the nearest grid and created 19 hexagonal cells to host each of the seven predictors. A matrix of 19×7 finally is entered into the SOM algorithm. However, to visualize and inspect atmospheric circulation fields, we use a larger area (as later shown in Fig. 11, Fig. 13), which allows us to assess, in an easier way, the large-scale atmospheric circulation patterns.
As shown in Zhou et al. (2016), the number of SOM synoptic patterns reached an optimal combination of 20 (4x5) if we search to minimize the quantization error within groups and to maximize topographic error among groups. Once the SOM synoptic patterns are determined for each of the 56 target stations, a probabilistic relation of the precipitation with each of the 20 synoptic patterns can be formulated. An example of SOM modeling can be found in Appendix for Wuhan station.
2.3 Precipitation indices
Five indices indicating summer mean and extreme rainfall are used in this research: number of rainy days (R1mm), number of heavy precipitation days (R10mm), total precipitation (PRCPTOT), precipitation intensity (SDII) and 95th percentile precipitation (P95). Specific definitions are shown in Table 2 and can be found in numerous literatures (Salinger et al., 2001; Frich et al., 2002; Zhang et al., 2011; Chen et al., 2015).
3. Evaluation of SOM downscaling model
With the relationship obtained between the SOM weather patterns and probability distributions of precipitation, a statistical downscaling model is thus established. It is then driven by predictors (seven meteorological variables) from five GCMs from 1986 to 2005 to produce daily precipitation as in a weather generator. The whole procedure is repeated for each of the 56 stations. The multi-model ensemble results are firstly evaluated.
3.1 Evaluation of downscaled daily rainfall PDF at individual stations
In order to investigate the ability of SOM in reproducing the probability distribution of daily rainfall four representative stations (Wuhan, Nanjing, Hefei and Yueyang) are selected as example for comparison and evaluation. Figure 2 shows the Q-Q plot of rainfall before and after downscaling. The closer the points are to the diagonal, the closer the simulation is to the observation (in the sense of
8
statistical properties). It can be seen that precipitation from GCMs is generally underestimated, especially for strong events. The deviation for events above 100 mm/day is larger than 50 mm/day. The downscaling did a very good job. Except for the slightly undervalued 70-100 mm/day precipitation at Yueyang station, biases at Wuhan, Nanjing and Hefei are basically within 30 mm/day. The PDF of rainfall at Hefei is almost identical to that from observation. Obviously, except for some large values of precipitation, the daily rainfall quantile produced by the downscaling is basically consistent with the observation, which means the underestimation of rainfall in GCMs can be remedied and the improvement on characterization of PDF tail feature (i.e. extreme precipitation) is most notable.
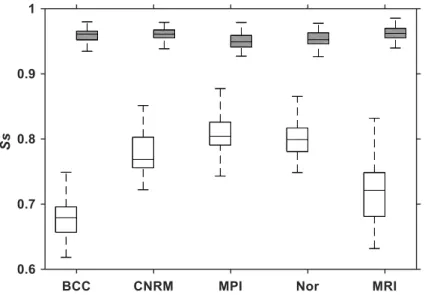
Skill Score (Sscore) can be used to further evaluate the overall skill of the downscaling method in
reproducing the statistical properties of the observation. Sscore (Perkins et al., 2007; Fu et al., 2013) is
defined as an integral of PDF which always takes the minimum from the two PDFs in examination. It was introduced to quantitatively characterize the coincidence of two probability distribution curves, that is, the resemblance of the simulated PDF to that from observation. The closer Sscore is to 1, the better is
the resemblance of the simulation to observation. Sscore for all stations forms an ensemble of values which
can be displayed in Fig. 3 as a box-and-whisker plot before and after the statistical downscaling respectively. The median of Sscore varies from 68% in BCC-CSM1.1m, 77% in CNRM-CM5, 80% in
MPI-ESM-MR, 80% in NorESM1-M and 72% in MRI-CGCM3 before downscaling to all above 90% after downscaling, implying a remarkable progress. The portion of PDF that is still not perfectly overlapped is certainly the deviation of strong rainfall (as shown in Fig. 2). In Fig. 3, we can also see that the SOM downscaling methodology improves and unifies the simulation performance of precipitation, while GCMs show low and very diverse performance among them.
3.2 Evaluation of spatial patterns for the downscaled rainfall indices
To examine the spatial structure of rainfall fields, we can use the commonly-used Taylor diagram (Taylor et al., 2001) (Fig. 4) which depicts the spatial correlation coefficient (the azimuthal angle) and the normalized standard deviation (radial distance from the origin) between the simulation and observation. Figure 4 displays the performance in the five GCMs (hollow symbols) and their counterpart after the SOM downscaling (solid symbols) respectively. We plotted all the five rainfall indices. The black small circle is the observation reference, and large circles from this point are the centered root-mean square error. The correlation coefficients of all indices deduced from raw GCM rainfall outputs are
9
lower than 0.6. Those for PRCPTOT, SDII and P95 from BCC-CSM1.1m even have negative correlations. Standard deviations from different models also show a large dispersion (from 0.3 to 2.3), suggesting an unsatisfactory performance. In contrast, after the SOM downscaling which produces rainfall with GCMs’ atmospheric fields as inputs, the spatial correlation coefficients all jump to 0.9, the normalized standard deviations are all close to 1.0, and the centered root mean square error of each precipitation index is smaller than 0.5 for most of the variables, which illustrates a good performance for the SOM downscaling method. The dispersion of results from GCMs also drastically decreases after the SOM downscaling, indicating that there is an enhancement of consistency of multi-model results through the SOM process.
In summary, the results shown above provide clear evidence that SOM downscaling method can effectively improve the probability distribution of daily rainfall and the spatial distribution of precipitation indices, demonstrating the added value of SOM to raw GCMs.
4. Projection of Summer rainfall variations
With the fact that SOM can significantly refine the daily precipitation simulation, presenting good performance when it is driven by atmospheric fields from GCMs, a good projection of precipitation changes in the future can be expected.
4.1 Daily rainfall PDF changes
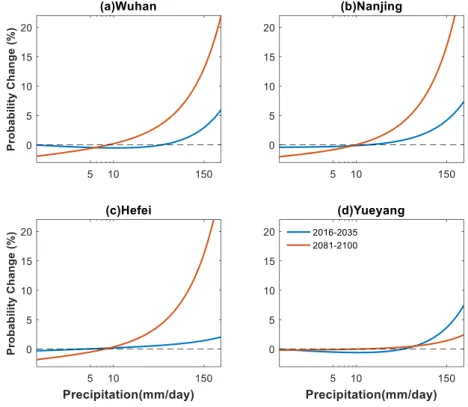
The characteristics of daily rainfall PDF variation can fully reflect the change of precipitation intensity and frequency. We thus investigate the PDF properties in the future as projected by SOM. The same four representative stations are selected as used above. Figure 5 plots the occurrence probability changes (relative to 1986-2005) in the early (2016-2035), and end (2081-2100) of the 21st century. The PDF was
fitted to a Gamma function with daily rainfall amounts at each station and for five GCMs. In the early stage, daily precipitation smaller than 10mm is projected to slightly decrease, while the probability of larger rainfall overall grows obviously. At the end of the 21st century, this trend is more remarkable, the
increment of heavy precipitation occurrence reaches 20% (except for Yueyang station), while light rain (<10 mm/day) would reduce. If we make statistics to the whole 56 stations, 35 stations (63% in the Yangtze-Huaihe river basin) show probability transferring from light rain (< 10 mm/day) to strong rainfall (>10 mm/day) in this period. On the contrary, 37% stations possess decreasing or unchanged extreme rainfall. Figure 6 presents the geographic distribution of all stations. It can be seen that stations
10
with transition from light to heavy rainfalls are mainly distributed in the central domain, while reducing heavy rainfalls occur to stations in the west and southeast region.
In an accompanying paper that uses the same datasets, but a non-homogenous hidden Markov model as the statistical downscaling tool, Guo et al. (2019) also obtained results approving probability transferring from light to strong rainfall for the whole basin domain.
4.2 Spatial changes of rainfall indices
The spatial distributions of downscaled ensemble mean summer PRCPTOT, SDII, R10mm and P95 changes (relative to 1986-2005) in the future are shown in Fig. 7. At early 21st century, the total (Fig. 7a)
and extreme (Fig. 7c, d) precipitation indices in the central Yangtze-Huaihe river basin are projected to increase, yet decreases occur over the western domain (middle reaches of the Yangtze River, west of 115°E), as well as sparse stations in the southeast zone. As for SDII, additional increasing stations are found in the north of the river’s middle reaches (Fig. 7b). In the last period of the 21st century,
precipitation experiences an overall increase relative to that in the early period except for several southeastern stations. PRCPTOT, R10mm and P95 in the central and eastern area (the lower Yangtze River, east of 115°E) increase significantly (at a significant level of 95%) with a relative change of nearly 30%. The variation of SDII is less distinct, but positive changes become more significant. In this period, decreasing rainfall still occurs in the western portion of the domain and a few stations in the southeast coastal region (Fig.7e-h), which is consistent with the spatial characteristic of daily rainfall PDF variation (Fig. 6). This result is consistent with Zhou et al. (2014) and Xu et al. (2018) which suggested that summer rainfall intensity and extreme precipitation would be slightly more severe in east China (27°-36°N, 116°-122°E) than in central China (27°-(27°-36°N, 106°-116°E) in the late 21st century.
The Paris Agreement adopted in December 2015 is an important effort of the international community to combat anthropogenic climate change. The central objective is to keep global temperature rise well below 2°C above the pre-industrial level and to pursue efforts to limit the temperature increase even further to 1.5°C. The methodology that we developed in this paper with SOM is a quite flexible one, and can be easily used to address challenges of the Paris Agreement, in particular, variation of precipitation under the background warming of 1.5°C and 2°C. By convention, the reference of climate variables is taken as the current climate in the historical simulations, while the global warming levels use the preindustrial era as the reference. To obtain the right window of the two warming targets, we used the
11
procedure already used in Shi et al. (2018): the time series of the global and annual mean surface air temperature is firstly filtered by a 21-year running mean operation; the first year for which the target warming value is reached is considered as the center of the window with plus and minus 10 years, and the period of 21 years is considered as the projection time reaching 1.5°C or 2°C warming level. Table 3 shows the central year for the two warming windows and for the five global models.
Figure 8 shows changes of total precipitation and precipitation intensity for the two warming targets. Results are the ensemble mean from the five global models. Under 1.5°C warming, the PRCPTOT of most stations in the lower Yangtze River are strengthened by nearly 7% (Fig. 8a). When the warming arrives at 2°C, the spatial pattern of PRCPTOT change remains always the same, but the increasing magnitude reaches almost 11% (Fig. 8c). As to SDII, enhancement is mainly located in the lower reaches of the Yangtze River under 1.5°C warming level. Under 2.0°C warming, there is a certain expansion of this increasing zone to the south and west of the domain, but the magnitude seems unchanged. Therefore, the half-a-degree warming from 1.5 to 2.0°C makes the total precipitation increase in the lower reaches of the Yangtze River, while it makes the precipitation intensity clearly increase in the south and west of the domain.
5. Physical explanations of projected precipitation variation
Since SOM offers the possibility of exploring the causes of future precipitation changes from the view of variation of synoptic patterns, we attempt to find the physical explanations of the projected rainfall variation by performing an analysis on these synoptic patterns. At the same time, it is also our responsibility to check the physical consistency of results issued from a statistical downscaling approach to prevent spurious results from occurring.
Conceptually, future change of precipitation may be achieved by (1) changes of the synoptic patterns; (2) changes in the occurrence frequency of these patterns. As mentioned above, there are 20 SOM synoptic patterns for each of the 56 stations. They share a lot of common behaviors since the 56 stations are not far from each other. But the total number is still too large for us to easily extract useful information. To resolve this issue, we use the K-means clustering method to regroup all SOM synoptic patterns. All the seven predictors in Section 2 of each SOM pattern are used for the secondary-clustering purpose. But we use here for illustration purpose a slightly larger domain (0°-60°N, 60°-160°E). Using a larger domain
12
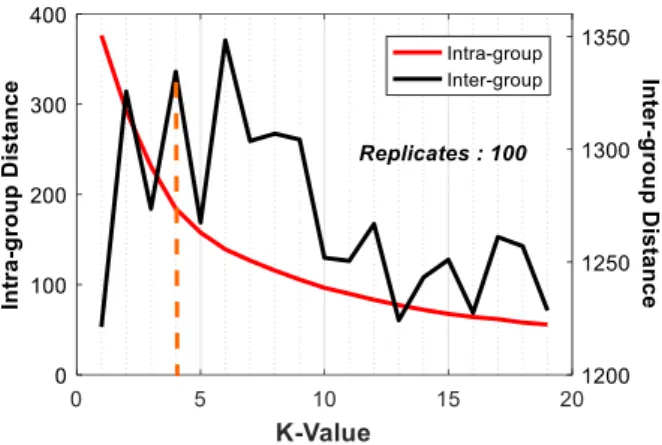
allows us to make a better description of the large-scale atmospheric circulation. SOM synoptic patterns become now regional synoptic regimes. To determine the most suitable number of clusters, we can use the basic principle of the algorithm (Mc Queen, 1967) to optimize both intra-cluster distance and inter-cluster distance. Figure 9 displays the two Euclidean distances in function of K, the number of inter-clusters. When K equals 4, the inter-cluster distance is relatively large, while the intra-cluster distance is no more significantly reduced. We can now affirm that 4 is a good choice for the number of clusters to be used.
5.1 Stability of future regional synoptic patterns
The stability of synoptic patterns regrouped into four clusters needs now to be evaluated, since its non-stationarity (or non-stability) might constitute a way by which climate change manifests. To do so, we can calculate a quantization error corresponding to each cluster. As used in Ning et al. (2012a), a quantization error, fully defined by the distribution of states that form the cluster, is the sum of the absolute differences (Euclidean distances) of each state from the cluster mean (analogous to the within-cluster variance). The quantization error (QE) can be used to describe the quality of the within-clustering. Larger quantization errors indicate greater spreading among the states mapped into a cluster. In our study, we use the Wilcoxon rank test to investigate whether significant differences would occur on quantization errors (QEs) of each cluster (regional pattern) in future climate, compared to its historical counterpart, which allows us to discuss on the stability of the pattern.
Figure 10 shows the stability of regional patterns’ QEs in the future under the five models (each GCM corresponds to four patterns). The upper part of the dividing line indicates that the QE has no significant change in a future period, that is, this pattern possesses stability. The stability is poor for the lower part of each panel. It can be found that except for the weak stability of patterns driven by MPI-ESM-MR and NorESM1-M (only for the third pattern) in the early periods, there was no significant change in QE from other models in all periods. In other words, the 4 regional patterns have high stability in the future. This conclusion, although not trivial a priori, is expected and in agreement with works reported in Corti et al. (1999) who stated that the spatial patterns of atmospheric response to global warming may in fact project principally onto modes of natural climate variability. They furthermore performed diagnoses on the atmospheric circulation in the Northern Hemisphere, and reached to the conclusion that recent climate change can be interpreted in terms of changes in the frequency of occurrence of natural atmospheric circulation regimes. We can thus concentrate our efforts hereafter on the occurrence frequencies of the
13 regional synoptic regimes.
5.2 Variations in frequency of regional synoptic regimes
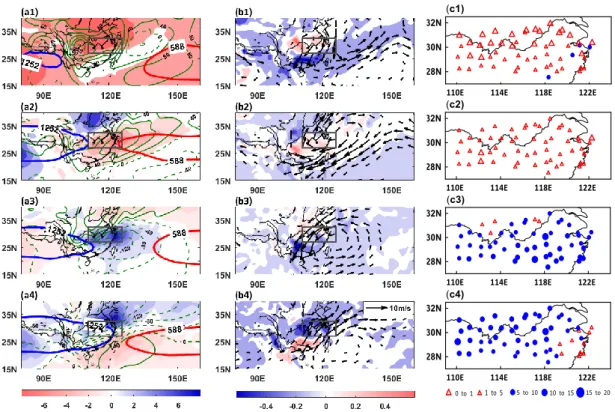
Before investigating the occurrence frequency variation of the regional synoptic regimes, we need to check their circulation configurations and their corresponding precipitation patterns, as depicted in Fig. 11. The left panels show regional synoptic charts, including the characteristic isolines of the South Asian High (SAH) (12500 gpm) and the Western Pacific Subtropical High (WPSH) (5880 gpm), together with hPa relative humidity anomalies and SLP anomalies. The middle panels show 850-hPa wind anomalies and their divergence. The corresponding spatial distributions of precipitation are shown in the right panels.
For the first regional regime (first row), the SAH is obviously westward retreated (at 100°E), while the WPSH is eastward retreated (at 135°E), making them far away from each other. Our target area (shown as a black rectangular) is occupied by anomalous high SLP and low humidity (Fig. 11a1). As for the low-level wind and divergence anomalies, there is an anomalous anticyclonic circulation with strong water vapor divergence over the area (Fig. 11b1). This atmospheric circulation regime is not favorable for local precipitation, with the regional average of only 1.7 mm/day. Half of the studied stations have rainfall smaller than 1 mm/day, suggesting that this regime is a dry one (Fig. 11c1) which is denoted hereafter as Dry-1 (D-1) synoptic regime.
As to the second regional regime (second row), SAH moves eastward to 108°E, while WPSH extends westward to 122 °E to reach the target area, bringing high pressure and low humidity (Fig. 11a2). The anticyclonic anomaly around the WPSH covers the entire area of interest, and the
divergence of moisture is stronger in west than in east (Fig. 11b2). When this regime occurs, the areal mean precipitation is 1.9 mm/day and none of the stations exceed 5 mm/day (Fig. 11c2). This regime is hereafter denoted as Dry-2 (D-2) synoptic regime.
For the third regional regime (third row), SAH further extends eastward (to 112°E), allowing low sea-level pressure and high humidity (at 850 hPa) to occur (Fig. 11a3). The lower level is mostly controlled by cyclonic and convergence anomalies (Fig. 11b3). As to the spatial distribution of precipitation, the average rainfall of nearly 40% of stations exceeds 10 mm/day and the maximum reaches 16 mm/day (Fig. 11c3). We define this regional regime as Wet-1 (W-1) synoptic regime.
14
121°E) and WPSH extends further westward to the southeast zone of the Yangtze-Huaihe river basin. They are tightly linked to each other but WPSH does not behave as it does in D-2. Thus, our target area on the northwest side of WPSH can be completely controlled by strong low pressure and high humidity anomalies (Fig. 11a4). The low-level jet from the South China Sea and that from the Bay of Bengal converge together to develop a strong water vapor transport belt, bringing abundant moisture to the region and leading to strong moisture convergence (Fig. 11b4). In this case, except for a few stations in the southeast region affected by the anomalous anticyclone, the average precipitation of 45% stations exceeds 10 mm/day and the largest amount reaches 20 mm/day (Fig. 11c4). This regional regime is defined as Wet-2 (W-2) synoptic regime.
The four regimes described above can exert significant effects on the spatial distribution of precipitation in the Yangtze-Huaihe river basin. They obviously reflect an evolution from an extreme dry regime to an extreme wet one.
It is quite obvious that there is a good relationship between the circulation patterns of each regional regime and its corresponding precipitation distribution. We can now explore their occurrence frequency in the reference period (1986-2005) and in two periods of the 21st century as displayed in Fig. 12. We
can see that the median of D-2’s frequency has almost no change in the future. W-1 also shows a similar stationarity with an increase of the median about 9%. The regime D-1 (in diminution) and the regime W-2 (in augmentation) show however significant variations, the occurrence of W-W-2 being more frequent in time.
As shown, the rainfall increase in the central Yangtze-Huaihe River basin and the decrease in the middle reaches as well as in southeast of the domain in the early 21st century (Fig. 7a-d) can be linked to
the slight rise of D-2 and W-2 pattern (Fig. 12b, d), as well as the reduction of W-1pattern (Fig. 12c), which would together lead to the strong convergence over the central (Fig. 11b4) and anti-cyclonic anomaly over the west (Figs. 11b2) and southeast (Fig. 11b4). In the late period, the main variations of regional patterns are still the rise of W-2 by the median nearly 20% (Fig. 12d) and the reduction of D-1 by 25% (Fig. 12a), indicating the enhancement of convergence in the whole basin. Thus, the mean and extreme rainfall indices would experience an overall intensification except for stations over southeastern region which show more severe reduction (Fig.7e-h).
15
regional patterns have high stability in the future, the change of precipitation distribution being mainly related to their frequency variation. The expansion and nearly overall enhancement of large-value precipitation at late 21st century are linked to the rise of extreme wet pattern with westward extension of
WPSH and eastward extension of SAH, as well as the reduction of extreme dry pattern with WPSH and SAH pushing away each other. At the end of the 21st century, the augmentation of extreme wet pattern
and the decrease of extreme dry pattern can reach almost 25%, resulting in the significant intensification of large-value precipitation.
6. Conclusion
In this paper, we used the Self-organizing map (SOM) to simulate summer daily precipitation over the Yangtze-Huaihe river basin (27.5°-32°N, 110°-122.5°E) in Eastern China. We used the multi-model ensemble approach to evaluate the downscaling efficiency and to make projection under RCP4.5 in the 21st century. Finally, we performed a regime analysis for the atmospheric circulation. Such regimes have
clearly-identified but different rainfall patterns, which helps us to find physically-based explanations for precipitation variation. Main conclusions of this study are as follows.
(1)
SOM is a two-dimensional neural network, capable of transforming complex atmospheric states into an ensemble of nodes with smooth transition from one node to its neighbors. As a climate downscaling tool for precipitation, SOM establishes a statistical relationship between these nodes and the rainfall. After training the SOM model with atmospheric variables from ERA-40 re-analysis and daily rainfall records from 56 surface stations, we then used it with historical simulations from five GCMs for a validation of the SOM model. SOM shows good performance in terms of probability distribution of daily rainfall and spatial structure of precipitation indices, demonstrating an added value to GCMs. The skill scores measuring the coincidence rate of precipitation PDFs from model and observation have their median from 68% to 80% before downscaling, but all above 90% after downscaling. The improvement in extreme precipitation is especially remarkable. The spatial correlation coefficients of all rainfall indices jump from below 0.6 in GCMs to above 0.9 after downscaling with SOM. Additionally, the consistency among multi-model simulations is also enhanced.16
21st century (early and late) under RCP4.5 scenario, and for two global warming levels (1.5 and
2.0°C) targeted by the Paris Agreement on climate change. Visible from the daily rainfall probability distributions, 63% of sites which are mainly located in the central area of interest exhibit shifts to larger values. At the early 21st century (2016-2035), the total precipitation and extreme indices in
the central basin are mainly characterized by increase, yet decreases occur in the middle reaches of the Yangtze River and sparse stations in the southeast region. In the last period (2081-2100), precipitation experiences an overall increase except for a few southeast stations. PRCPTOT, R10mm and P95 in the lower Yangtze River increase significantly by nearly 30%. Under the two targeted warming levels, total precipitation in the lower reaches of the Yangtze River increases from 7% at 1.5°C to 11% at 2°C warming, while precipitation intensity is enhanced more clearly in south and west of the domain in response to the 0.5°C additional warming.
(3)
Results from SOM also provide us an opportunity to investigate the underneath mechanism for projected variations of precipitation, since SOM establishes ultimately the relationship between atmospheric circulations and regional precipitation. We applied furthermore a clustering algorithm to compact information. It is found that 4 regional synoptic regimes have high stationarity or stability in future scenarios, which implies that changes of future precipitation distribution are mainly attributable to the occurrence frequency variation of these regimes. The expansion and intensification of large-value precipitation for the 21st century are revealed to be linked to the riseof wet pattern which brings closer WPSH (moving westward) and SAH (moving eastward), as well as the reduction of dry pattern which makes WPSH and SAH move away from each other. Finally, we believe that our SOM downscaling methodology is a reliable one in production of high-quality mean and extreme precipitation as well as in searching relevant synoptic patterns that are responsible for rainfall changes. Datasets issued from our study can be used by end users or other research communities dealing with climate change.
17
Reference
Borah N, Sahai A K, Chattopadhyay R (2013) A self-organizing map – based ensemble forecast system for extended range prediction of active/break cycles of Indian summer monsoon. JGR Atmos 118: 9022-9034. doi:https://doi.org/10.1002/jgrd.50688
Chattopadhyay R, Sahai A K, Goswami B N (2008) Objective Identification of Nonlinear Convectively Coupled Phases of Monsoon Intraseasonal Oscillation: Implications for Prediction. J Atmos Sci 65:1549-1569. doi: https://doi.org/10.1175/2007JAS2474.1
Chen WL, Jiang ZH, Huang Q (2012) Projection and simulation of climate extremes over the Yangtze and Huaihe River Basins based on a Statistical Downscaling Model. Trans Atmos Sci 35(5):578-590.
Chen X, Xu Y, Yao Y (2015) Changes in climate extremes over China in a 2℃, 3℃, and 4℃ warmer world. Chin J Atmos Sci 39:1123-1135
Corti S, Molteni F, Palmer T (1999) Signature of recent climate change in frequencies of natural atmospheric circulation regimes. Nature 398:799
Fan L, Fu C, Chen D (2005) Review on creating future climate change scenarios by statistical downscaling techniques. Advances in Earth Science 20:320-329. 10.1007/s10409-004-0010-x Fowler HJ, Blenkinsop S, Tebaldi C (2007) Linking climate change modelling to impacts studies: recent
advances in downscaling techniques for hydrological modelling. Int J Climatol 27:1547-1578. https://doi.org/10.1002/joc.1556
Frich P, Alexander LV, Della-Marta P, Gleason B, Haylock M, Tank AK, Peterson T (2002) Observed coherent changes in climatic extremes during the second half of the twentieth century. Climate Res 19:193-212. https://doi.org/10.3354/cr019193
Fu G, Liu Z, Charles SP, Xu Z, Yao Z (2013) A score‐based method for assessing the performance of GCMs: A case study of southeastern Australia. J Geophys Res: Atmos 118:4154-4167. https://doi.org/10.1002/jgrd.50269
Gao X, Xu Y, and Z C Zhao (2006) Impacts of Horizontal Resolution and Topography on the Numerical Simulation of East Asian Precipitation. Chinese Journal of Atmospheric Sciences 02:185-192. 10.1016/S1003-6326(06)60040-X
Guo L, Jiang Z, Ding M, Chen W, Li L (2019) Downscaling and projection of summer rainfall in Eastern China using a nonhomogeneous hidden Markov model. Int J Climatol 39:1319-1330. https://doi.org/10.1002/joc.5882
Hewitson B, Crane R (2006) Consensus between GCM climate change projections with empirical downscaling: precipitation downscaling over South Africa. Int J Climatol 26:1315-1337. https://doi.org/10.1002/joc.1314
Hope PK, Drosdowsky W, Nicholls N (2006) Shifts in the synoptic systems influencing southwest Western Australia. Climate Dyn 26:751-764. https://doi.org/10.1007/s00382-006-0115-y
Hope PK (2006) Projected future changes in synoptic systems influencing southwest Western Australia. Climate Dyn 26:765-780. https://doi.org/10.1007/s00382-006-0116-x
IPCC (2013) Climate Change 2013: The Physical Science Basis. Cambridge University Press 1535 pp. doi:10.1017/CBO9781107415324
18
Kohonen T (1982) Self-organized formation of topologically correct feature maps. Biol Cybern 43:59-69. https://doi.org/10.1007/BF00337288
Kohonen T (1990) The self-organizing map. Proceedings of the IEEE 78:1464-1480. https://doi.org/10.1109/5.58325
Liu W, Wang L, Chen D, Tu K, Ruan C, Hu Z (2016) Large-scale circulation classification and its links to observed precipitation in the eastern and central Tibetan Plateau. Climate Dyn 46:3481-3497. https://doi.org/10.1007/s00382-015-2782-z
MacQueen J (1967) Some methods for classification and analysis of multivariate observations. Proceedings of the fifth Berkeley symposium on mathematical statistics and probability, Oakland, CA, USA, 281-297
Ning L, Mann ME, Crane R, Wagener T (2012) Probabilistic projections of climate change for the mid-Atlantic region of the United States: Validation of precipitation downscaling during the historical era. J Climate 25:509-526. https://doi.org/10.1175/2011JCLI4091.1
Ning L, Mann ME, Crane R, Wagener T, Najjar Jr RG, Singh R (2012) Probabilistic projections of anthropogenic climate change impacts on precipitation for the mid-Atlantic region of the United States. J Climate 25:5273-5291. https://doi.org/10.1175/JCLI-D-11-00565.1
Perkins S, Pitman A, Holbrook N, McAneney J (2007) Evaluation of the AR4 climate models’ simulated daily maximum temperature, minimum temperature, and precipitation over Australia using probability density functions. J Climate 20:4356-4376. https://doi.org/10.1175/JCLI4253.1 Salinger M., and Griffiths G (2001) Trends in New Zealand daily temperature and rainfall extremes. Int
J Climatol 21:1437-1452. https://doi.org/10.1002/joc.694
Salvi K, Kannan S, Ghosh S (2013) High-resolution multisite daily rainfall projections in India with statistical downscaling for climate change impacts assessment. JGR Atmos 118:3557-3578. doi:10.1002/jgrd.50280
Shi C, Jiang Z H, Chen W L, Li L (2018) Changes in temperature extremes over China under 1.5°C and 2°C global warming targets. Advances in Climate Change Research 9:120-129. https://doi.org/10.1016/j.accre.2017.11.003
Taylor KE (2001) Summarizing multiple aspects of model performance in a single diagram. J Geophys Res: Atmos 106:7183-7192. https://doi.org/10.1029/2000jd900719
Ultsch A (2007) Emergence in self-organizing feature maps. H Ritter, R Haschke (Eds), International Workshop on Self-Organizing Maps (WSOM '07), Neuroinformatics Group, Bielefeld, Germany, ISBN 978-3-00-022473-7.
Verdon-Kidd D, Kiem A (2009) On the relationship between large-scale climate modes and regional synoptic patterns that drive Victorian rainfall. Hydrol. Earth Syst Sci 13:467-479. https://doi.org/10.5194/hessd-5-2791-2008
Wang Y, Jiang Z, Chen W (2015) Performance of CMIP5 models in the simulation of climate characteristics of synoptic patterns over East Asia. J Meteorol Res 29:594-607. https://doi.org/10.1007/s13351-015-4129-4
Wilby RL, Charles S, Zorita E, Timbal B, Whetton P, Mearns L (2004) Guidelines for use of climate scenarios developed from statistical downscaling methods. Supporting material of the
19
Intergovernmental Panel on Climate Change, available from the DDC of IPCC TGCIA 27: - Wu D, Jiang ZH, Ma TT (2016) Projection of Summer Precipitation over the Yangtze-Huaihe River Basin
Using Multimodel Statistical Downscaling Based on Canonical Correlation Analysis. Journal of Meteorological Research 30:867-880.
Xu C Y, Singh VP (2004) Review on regional water resources assessment models under stationary and changing climate. Water Resour Manage 18:591-612. https://doi.org/10.1007/s11269-004-9130-0 Xu Y, Gao X, Giorgi F, Zhou B, Shi Y, Wu J, Zhang Y (2018) Projected changes in temperature and
precipitation extremes over China as measured by 50-yr return values and periods based on a CMIP5 ensemble. Adv Atmos. Sci., 35, 376-388. https://doi.org/10.1007/s00376-017-6269-1
Yin C, Li Y, Ye W, Bornman JF, Yan X (2011) Statistical downscaling of regional daily precipitation over southeast Australia based on self-organizing maps. Theor Appl Climatol 105:11-26.
https://doi.org/10.1007/s00704-010-0371-y
Zhao C, Jiang ZH, Sun XJ, Li W, Li L (2019) How well do climate models simulate regional atmospheric circulation over East Asia? Int J Climatol 1-15. doi: 10.1002/joc.6205
Zhang X et al. (2011) Indices for monitoring changes in extremes based on daily temperature and precipitation data. Wiley Interdisciplinary Reviews: Climate Change 2:851-870. https://doi.org/10.1002/wcc.147
Zhou B, Wen QH, Xu Y, Song L, Zhang X (2014) Projected changes in temperature and precipitation extremes in China by the CMIP5 multimodel ensembles. J Climate 27:6591-6611. https://doi.org/10.1175/JCLI-D-13-00761.1
Zhou P, Jiang ZH (2016) Statistical downscaling of regional daily precipitation over Yangtze-Huai River basin based on Self-Organizing Maps. Climatic and Environmental Research 21:512-524. https://doi.org/10.1007/s00704-010-0371-y
20
Fig. 1 Geographic locations of the 56 weather stations with rain gauges in the Yangtze-Huaihe river basin
in Central and Eastern China. Superimposed is the Yangtze River. The four stations served as illustration in the paper are marked. They are all along the Yangtze River, except Hefei that is about 100 km away.
21
Fig. 2 Q-Q (quantile by quantile) plots of daily precipitation showing direct results from GCM (hollow
triangle) and those (solid circle) with SOM downscaling applied at Wuhan (a), Nanjing (b), Hefei(c) and Yueyang (d) stations respectively. The operation was done for the historical simulations (1986-2005), considered as validation or evaluation within the SOM methodology. Five GCMs used to drive SOM are BCC-CSM1.1m (blue), CNRM-CM5 (green), MPI-ESM-MR (red), NorESM1-M (orange) and MRI-CGCM3 (purple).
22
Fig. 3 Boxplot of Sscore from the 56 stations over the Yangtze-Huaihe river basin. Sscore measures the
coincidence rate between the PDF of simulated daily precipitation and that of observation. Hollow boxes are datasets directly from the five GCMs: BCC-CSM1.1m (BCC), CNRM-CM5 (CNRM), MPI-ESM-MR (MPI), NorESM1-M (Nor) and MPI-ESM-MRI-CGCM3 (MPI-ESM-MRI). Solid boxes are their counterparts after downscaling.
23
Fig. 4 Taylor diagram showing multi-year (1986-2005) mean summer precipitation indices before
(hollow) and after (solid) the SOM downscaling. Five driving GCMs are BCC-CSM1.1m (blue), CNRM-CM5 (green), MPI-ESM-MR (red), NorESM1-M (orange) and MRI-CGCM3 (purple), respectively.
24
Fig. 5 Relative changes (relative to 1986-2005) of daily precipitation probability density function in the
early (2016-2035) (blue solid line) and late (2081-2100) (orange solid line) 21st century at Wuhan (a),
Nanjing (b), Hefei (c) and Yueyang (d) stations. Ensemble results from SOM downscaling driven by five GCMs are used. The y axis corresponds to probability change while x axis represents the intensity of daily precipitation (mm/day). The black dashed line means zero change.
25
Fig. 6 Geographic distribution of stations with increasing (blue cross) or decreasing (red cross) strong
26
Fig. 7 Spatial distributions of downscaled ensemble mean (SOM downscaling driven by five GCMs)
summer PRCPTOT (a, e), SDII (b, f), R10mm (c, g) and P95 (d, h) variations (relative to 1986-2005) in the early (2016-2035) (a-d, upper four panels) and the late (2081-2100) (e-h, lower four panels) 21st
century. Blue circles indicate positive changes, while red triangles indicate negative changes. The size of circle or triangle represents the magnitude of relative variation. The purple crosses are plotted for stations that passed the significance test (at level 95%).
27
Fig. 8 Spatial distributions of downscaled ensemble mean (SOM downscaling driven by five GCMs)
summer PRCPTOT (a, c) and SDII (b, d) in the Yangtze-Huaihe river basin at global warming level of 1.5°C (a, b) and 2°C (c, d). Blue circles indicate positive changes; red triangles indicate negative changes. The size of circle or triangle represents the magnitude of relative variation. The purple crosses are plotted for stations that passed the significance test.
28
Fig. 9 Intra- and inter-group distances in function of number of clusters. The red solid line corresponds
to the left vertical coordinate, representing the average intra-group distance, and the black solid line corresponds to the right vertical coordinate, indicating the average inter-group distance. The orange dotted line marks the best K.
29
Fig. 10 Stability of the 4 regional patterns (a-d) in the early (2016-2035) and late (2081-2100) 21st century
(blue: BCC-CSM1.1m, green: CNRM-CM5, red: MPI-ESM-MR, orange: NorESM1-M, purple: MRI-CGCM3). When the bar is in the purple shadow area (upper part), it indicates that the quantization error (QE) does not pass the Wilcoxon significance test, i.e. the QE in this period has no significant change compared with the historical period, and this regional pattern keeps its stability. On the contrary, when the bar is in the red shadow region (lower part), the QE passes the Wilcoxon significance test, i.e. the QE in this period has significant changes compared with the historical period, and the stability of the corresponding regional pattern is poor.
30
Fig. 11 Circulation patterns (left and middle panels) and rainfall distributions (right panel) in the training
period (1961-2002) for each of the four regional regimes. The black rectangular depicts the target area of the Yangtze-Huaihe river basin. Left panels (a1) - (a4): The bold blue line (12500 gpm) indicates the position of the 200-hPa South Asian High (SAH); The bold red line (5880 gpm) is the characteristic position of the Western Pacific Subtropical High; The color shading shows 850-hPa relative humidity anomaly (unit: %) with positive in blue and negative in red; The green contours show SLP anomaly (green solid lines: positive; green dashed lines: negative and zero) (unit: hPa); Middle –column panels (b1) - (b4): 850-hPa wind anomaly (arrows) (unit: m s-1), only winds with a speed larger than 0.5 m s-1
are plotted; 850-hPa divergence anomaly (red shading for positive and blue for negative) (unit: 10-5 s-1).
Right panels (c1) - (c4): The spatial distribution of average daily precipitation (total rainfall amount of one regional pattern divided by the number of days belonging to this regional pattern) (units: mm day-1).
31
Fig. 12 Boxplots of annual occurrence frequencies variation (relative to 1985-2005) of the 4 regional
32
Table 1 List of global climate models
Model name Institution ID Country Resolution
BCC-CSM1.1m BCC China 1.1249°×1.1215° MPI-ESM-MR MPI-M Germany 1.8747°×1.8654° CNRM-CM5 CNRM-CERFACS France 1.4061°×1.4008° NorESM1-M NCC Norway 2.5°×1.9° MRI-CGCM3 MRI Japan 1.1°×1.1°
33
Table 2 Precipitation indices and their definition (Salinger et al., 2001; Frich et al., 2002; Zhang et al.,
2011; Chen et al., 2015)
index Name Definition Units
R1mm Number of rainy days Count of days when precipitation ≥ 1 mm/day days R10mm Number of heavy
precipitation days
Count of days when precipitation ≥ 10 mm/day
days
PRCPTOT Total precipitation Total precipitation from days when precipitation ≥ 1 mm/day
mm
SDII Precipitation intensity Mean precipitation rate for rainy days mm/day P95 95th percentile
precipitation
34
Table 3 Calendar year when global mean temperature from GCMs crosses 1.5°C and 2°C under RCP4.5
Model 1.5°C 2°C BCC-CSM1.1m 2014 2039 MPI-ESM-MR 2023 2045 CNRM-CM5 2037 2059 NorESM1-M 2041 2074 MRI-CGCM3 2054 2085
35
Appendix: Example of SOM nodes and associated rainfall cumulative probability distributions for Wuhan station
This appendix shows an example (for Wuhan) illustrating how SOM is used as a climate downscaling tool. The 20 SOM synoptic patterns are shown in Fig. 13 and the corresponding precipitation cumulative probability distribution functions (CDF) are shown in Fig. 14. It can be seen that the frequency of each pattern is between 2 and 9%, and the quantization errors are all controlled below 11 with a uniform distribution on different patterns, indicating that each pattern possesses expected and almost homogeneous capability to reflect information of its corresponding samples. The upper left patterns in Fig. 13 are dominated by lower humidity and higher SLP with northerly dry wind anomaly, while the lower right by higher humidity and lower SLP with southwest wet wind. Patterns in the middle are “transition patterns”. Moreover, circulation states of adjacent patterns are similar to each other, while far-away patterns are greatly different. This is an indication that the 20 patterns together have the expected capability in reflecting overall information and synoptic evolution (distributions and variations of circulation elements) at this station. Based on the above SOM synoptic patterns, the CDF of rainfall corresponding to each pattern is obtained (Fig. 14). Similar behaviors can be observed as for the SOM synoptic patterns: CDFs of adjacent SOM synoptic patterns are similar to each other, and show obvious differences for far-away patterns. A joint inspection for what shown in Figs. 13 and 14 reveals expected results, that is, a lack of rainfall corresponds to a combination of higher SLP, lower humidity and northerly dry wind and abundant rainfall takes place in the opposite situation of lower SLP, higher humidity and southwest wet wind. This provides evidence that the relationship between SOM synoptic patterns and observed rainfall is reasonable, and different SOM synoptic patterns can reflect different distribution characteristics of rainfall.
36
Fig. 13 The 5x4 nodes of the Self-organizing map (SOM) obtained for Wuhan station and during the
training process (1961-2002) of the neural network. Anomalous fields, as a deviation from their mean climatology, are plotted or superimposed for each node. The green contours show sea-level pressure (SLP) anomaly (green solid lines: positive; green dashed lines: negative and zero) (unit: hPa); Arrows represent 850-hPa wind (unit: m s-1, only plotted when amplitude larger than 0.5 m s-1); 850-hPa relative humidity
anomalies (unit: %) are shown in shading (negative in red and positive in blue). The purple frame depicts the position of our interested area, the Yangtze-Huaihe river basin. The letter ‘h’ above each panel represents occurrence fraction (%) of the pattern, the letter ‘qe’ is quantization error calculated as the sum of the absolute differences of all states forming the cluster from the cluster mean.
37
Fig. 14 Cumulative probability distribution function (CDF) of precipitation at Wuhan station,