GRADE 9 MATHEMATICS IN THE COMPUTER LAB:
ANINTRODUCTORYSTUDY*
PENELOPE J. GURNEY University of Ottawa
ABSTRACT. A pilot project was conducted at a secohdary school in which computers were used extensively in the teaching of maihematics at the grade 9 level. In this paper, the progress in mathematics of the students involved is compared to that of matched studenrs in another s.;hool who did not use computers. AU student tests and exams were coUecte~ during the school year from both groups, and analyzed. Gender appears to be a factor in the differences noted in results, but other factors, including attitude al~d type of sofrware used, may also play a role.
RtSU Mt. Un projet-pilote a été mené dans une école secondaire où les ordinateurs ont été utilisés pour la didactique des mathématiques eu neuvième année. Dans cet article, je compare le progrès en mathématiques de~ étudiants qui utilisent régulièrement un ordinateur et de ceux dans un autre écc.te qui n'en utilisent pas. Tous les tests et les examens des étudiants des deux grovpes ont été conservés et analysés pendant l'année. L'un des résultats importants ,indique que le sexe peut être la différence principale, quoique d'autres facteurs, comme l'attitude et la sorte de logiciel utilisé, peuvent aussi jouer un rôle important.
The use of computers across the curriculum is bec.oming commonplace in many areas in the elementary schools, particularly in language arts. The secondary schools, however, and, more specifically, the mathemat-ics classrooms of secondary schools, remain for the most part free of modem technology. This is a result of many fac~rs, .including the lack of software tied to the mathematics curriculum, the lack of sufficient computer equipment, and the difficulty that untrained, or inadequately trained, teachers have in using the existing systems effectively. The underlying reason appears to be that the teachers of mathematics are
*The author wishes to acknowledge and thank the Maurice Priee Foundation for a grant that made it possible to conduct this research.
Pene/ope J. Gurney not convinced that the use of computers will henefit mathematics learning and teachir'g, and hence consider the purchase of hardware and software not to be a worthwhile endeavour (Capper, 1988). There is sorne reseal ch evidence supporting the use of computers in specific areas of the rnathematies curriculum. James Kaput (1992) pro-vides a hroad overvkw of current studies of such usage, and concludes that computers should have a place in the teaching of mathematics. Sorne authors (Fey, 1986; Thomas, 1991) have suggested that the use of computers in the :nathematics classroom can improve the teaching and learning that takes place. The accounts are persuasive, but anecdo-tal, and do not men:ion supporting research. There have been a few studies ( Heid, Sheets, & Matras, 1990; Smart, 1987) which deal with one particular topic in mathematics such as algebra or geometry, and suggest that the computer might he helpful in teaching that one topie. Other authors (Dinkheller, Gaffney, & Vockell, 1989; Farrell & Farmer, 1988) simply assume that the use of computers in mathematics instruc-tion is good, without providing evidence to support their statements. The arguments appe.u convincing that computers may make a differ-ence in the leaming of topics in geometry in particular, and perhaps in other areas of mathematics as well (McLeod, 1992). This does not answer the broader question, however, of cost effectiveness: is it worth-while for a school or a school board to buy computers on a large scale,
and
have themused
extensively in the teachingand
learning of mathematics? The present study addresses the issue of using computers in the math-ematics class on a day-to-day basis. There are several possibilities inher-ent in the use of computers in the mathematics classroom. First, the computer may or may not be of benefit to the leaming of mathematies in general by students. Second, the attitude of students towards math-ematics may he affected, positively or negatively, by the use of comput-ers. Third, there ma)' be a cognitive element in the use by individual students' use of computers, in that the ability to use different mental representations may be different among those who use computers regu-larly in leaming mathematics. Last, and perhaps of greatest importance to the school board, is the underlying idea that the computer may be of assistance in meeting the needs of groups of students with widely differing levels of abilfty, partieularly those in grade 9 destreamed classes.THE NATURE OF THE STUDY
In the school year of 10993-4, a joint project was set up by the author and one school board in Ontario to examine the possibility of using com-puters in teaching mathematies. In one new school, a Macintosh
Grade 9 Mathematics in the Computer Lab
tory was set up for use by the grade 9 destreamed mathematies classes, to permit two non-immersion grade 9 math classes ta he taught, wher-ever possible, in the computer labo The computer was to be used as a tool for review, for enrichment, and to assist iJl teaching topies.
In
other words, the computer was ta be integrated into the course wher-ever its use was warranted in the mathematics curriculum. The expec-tation was that if the use of computer software could possibly help in the teaching of mathematics, any benefits wouldhe
more apparent and measurable in classes which contain the wide range of abilities found indestreamed grade 9. "
Of primary interest ta both the teachers in that school and the school board, then, was the question of whether the students would benefit from this type of teaching. This henefit might take the form of academic advantage; it could involve greater liking for "he subject; it might develop a greater ability in using different formsof mental representa-tion. It was decided, moreover, that anecdotal evidence would not be sufficient to justify continuing with such a program: sufficient data would have to be coUected to ensure that there \Vas a measurable and meaningful relationship hetween good mathematics leaming and com-puter use.
It was proposed, therefore, that the academic, attitudinal, and develop-mentalleveIs of students at this one secondary school be measured, and compared ta the like levels of similar students at a school where no computers are available for mathematies classes. By this means, not only would the staff of the pilot school know whether or not to con-tinue such a program in future years, but the school board would find out whether this program could he of assistance in other schools. FoUowing discussion with board personnel, a control school was se-lected, in which the students of grade 9 mathematies would have no access to computers. This school was selected on the basis of similarity to the pilot school on the following factors: a) Bath schooIs operate on a full-year system, in which mathematics is taught from Septemher ta June; b) In both schooIs, the French immersion students (often the most gifted) do not study mathematics with the non-immersion stu-dents, hence the non-immersion classes involved in this study contain a fairly high proportion of low achievers; and c) The socio-economie backgrounds of the students are similar.
The control group could not be selected from wimin the pilot school, because aU teachers in that school made sorne
use
of the computer lab within the mathematies program, and hence the requirement that the control group not use computers would be a perceived hardship to thePenelope J. qurney
teachers and studenu of this group. Furthermore, since the mathemat-ics software on the machines in the laboratory was freely available to all students at lunch and after school, there seemed to be no way to ensure that students not in any pilot group would not have any access to the software.
SUBJECTS
There are several graç:le 9 classes at the pilot school. Two were selected to take part in the stl:.dy, so that those students who, with their parents, decided that they did not wish to take part, could easily be moved to other classes at the start of the school year. As it turned out, this did not occur, since the students involved in the group, and their parents, were anxious to keep any possible advantage, and would have objected strenuously to any attempt to remove a child from the study.
The complete set ofsubjects is described in Table 1. The 38 students in the pilot group wêre, in general, very weak in mathematics. In the mathematics exam given by the school board at the end of grade 8, for example, only three .students had a grade higher than 73%, and 26 of them had a mark les~ than 50%.
TABLE 1. Subject description Group Pilot Control Mal~ 22 26 Females 16 31 Total 38 57
The control school had three classes of non-immersion grade 9 stu-dents, all taught bY· the same teacher; from these three classes, 57 students (including
26
boys and 31 girls), with permission from their parents, volunteered to be part of this study. Since these students were not singled out in any way, but were taught in the traditional way within the standard Classes, as part of the classes, the membership or non-membership of any student or students in the study did not present a problem to the teacher. The greater number of subjects in the control group, as compared to the experimental group, moreover, permitted more one-to-one matches of ability to be made between the two groups. There were both weak students and strong students in this control group: on the grade 8 mathematics test written by aU grade 8 students in the board, 15 st\ldents received a mark greater than 73%, while 21 had a grade lower than 50%.Grade 9'Mathematics ln the Computer Lab
Since the complete set of subjects was not evenly matched in various factors, subsamples were formed from the pilot and control groups, aU matched as to gender and on the results that they had achieved on eleven different topies tested in the common grade 8 mathematies examination of the previous year. There were 26 matches, consisting of eleven boys and 15 girls from each school. The other students either did not have matches, or had received extra help in mathematics from resource teachers during the school year, and hence could not be considered to have the same education as the avera4e student in the class. PROCEDURE
The students in the control group were taught throughout the year in a standard, strongly disciplined way. The classes VI ere highly structured,
and earlier topies were constantly reviewed, in an effort to encourage mastery of the mathematies as a whole; in addition, tests were cumula-tive, again to encourage leaming. No access to computers within the mathematies courses was, or could be, provided ror these students. During the first half of the year, the pilot group spent much of their mathematies class time in the computer lab: the mathematics lessons were delivered right· in the lab, and software v'as used both in the lessons themselves and in reinforcement of lessOlls. The software used came primarily from the Wings series of math teaching software, but also included graphing software and review tutorials. The students were encouraged to explore the tutorials after their lessons had been com-pleted, so as to review elementary mathematies concepts on their own, in whiehever order they wished. The lab was also available outside of class to any student in the school.
As the first half of the school year progressed, th~ twO teachers in the pilot school continued to work ahead in integrating computer software into the mathematics currieulum. They were making an effort to teach aH possible units using the computer, giving classroom instruction in units for which suitable software did not exist. At the completion of approximately sixty percent of the material in the ';:oursej the remaining topies in mathematics could not be effectively taught using the compu-ter, so the classes were moved into regular classrooms, and taught using more traditional methods. The computers were still available to the students at lunch and after school, but were no longer employed as a part of, and during, the math class itself. Hence the results described below are in two parts: first, the results from the first part of the year,
Pene/ope J. Gurney when the experimenl:<il group was using computers, and then for the latter part of the school year, when the experimental approach had ceased. MEASUREMENT TOOI.S
Regular testing and examinations
AU students in both the pilot and the control group experienced the normal end-of-topic tests whieh measure achievement, done in every class at the end of a topie of study. This was carried out at regular intervals throughout the school year, and copies were made of aU tests, for later inspection. When both sets of students had studied a specifie topie, then the results of similar questions on the topie were compared and recorded. It would have been disruptive to the two sets of teachers to have expected them to have identieal tests, but the questions asked were very similar, and hence direct comparisons were possible for the core topies and most of the optional ones in grade 9. The students also wrote mid-term and final exams, and a posttest based on the same kind of test items whieh had appeared on the original grade 9 entrance exam whieh they had written at the end of grade 8. AU of these were photocopied for schc·ol-to-school comparison.
Attitudinal questionnaire
One aspect of mathematies whieh is currently of interest is the student attitude towards it. There are" many students who dislike mathematics, and drop out of rnathematics study as soon as it is permissible to do so (Lafortune & Kayler, 1992; Steen, 1990). Since aU students in grade 9 must study mathernaties, however, it is inevitable that the classes contain sorne studerits who dislike the subject. It is also possible that the use of computersin teaching mathematics will change the attitudes of sorne children. For these reasons, permission was asked from both the students and their parents in both groups, to have the students fiU in an attitudinal questionnaire. The students fiUed in this questionnaire twiee - once at the beginning of the course and once at the end. The attitude scale selected was that of Fennema and Sherman (1976), which was developed in a study of 1233 secondary school students, and has since become a standard instrument. The Fennema and Sherman scale is a Likert scale, with values ranging from "strongly agree" to "strongly disagree". Items included "GeneraUy 1 have felt secure about attempting math" and "Most subjects 1 can handle, but 1 have a knack for flubbing up math". The scale was used, for example, in the
Grade 9 Mathematics in the Computer Lab
tion of a new college course (Hollowell & Ducl\, 1991), where the experimental group consisted of 108 students, and the control group held 875. Hence it was
decided
to use thisattitude
saùe in the curren.t study.Task interviews to examine mental representation
Are the students able to use visual, verbal, and enactive mental repre-sentations? It is thought by some (Aylwin, 1985) that the use of different forms of mental representation is developmental in nature, and that the amount of use of each of the forms of mental representa-tion varies amongst individuals. It is known that there is a relationship between experience in mathematics and the ability to utilize different modes of mental representation in adults (Gumey, 1992); but little is known about the ability
of
children to use different modes of mental representation. There are reaUy two questions at play here. First, do the students use aU three modes of mental representation? Second, do the students use the most appropriate modes of mental representation when . solving different problems in mathematics? Sim;e a particular math-ematical idea can often he ·represented in more than one way, the related ability to change representations, when necessary, is alsO impor-tant (Hiebert & Carpenter, 1992).It was felt that the question of which mode of mental representation is used by an individual student in the solution of
J
problem, could best he answered by individual sessions with student and researcher, in which the student was observed while attempting to solve problems. Six boys and six girls of different levels of demonstrated mathematical ability from each of the two groups (pilot and cont~ol),selected by their teachers, were therefore asked to solve problems.The problem-solving was done on a one-to-one basis, with each stud~nt explaining to an observer the methods of solution heing used, and the reasons for foUow-ing these methods; materials were provided so that each problem could he attempted using various forms of mental representation. The prob-lem-solving was carried out near the end of the school year, and required one session per student of up to 30 minutes. The student was audio-recorded as he or she descrihed each thought process during the problem solution. The observer also made notes during the process, describing the actions taken by the student. The solution itself, any rough notes made by the student, the observer's comments, and the audio tape were analyzed afterwards to see how the student conceptu-alized the problem, the mental representation used in the solution, and the techniques used in the solution.Pene tope J. Gurney
RESULTS Attitude
The attitude of the students on entering the program was similar in both groups of students, in that those who were successful in the grade 9 entrance exam were more positive towards mathematies than were those students who were not successful. In both groups, however, the attitudinal scale gave mixed messages: students with consistently low grades (lower than 30% in a few cases) in mathematics stated that they could learn mathematies with no diffieulty; yet some of the students with very high grades stated that they did not like mathematies, and were not ready for advanced work in mathematies; and some stated that they partieularly enjoyed problem-solving, while at the same time they insisted that they disliked word problems. As expected, many of the students with poor grades did not see that mathematies could possibly have any relevance in life and work after secondary school. These attitudes did not change during the school year for more than one or two students in either group, indicating that it is probable that attitudes are formed much earlier in a school career. In general, however, the attitude of higher-achieving students in both groups was more positive than that of weaker students.
Mid-term exam
One comparison examined in this study is that of the January mid-term examination results. It should be noted, however, that some of the early topies studied in mathematies by the two groups were different, so there may be little relevance for these interim results. In both the pilot group and the control group, however, the marks received on the mid-term examination were considerably higher than those on the grade 8 final mathematies exam. Table 2 illustrates the change for the 26 matched pairs. There is no way to tell, from these data, whether the marks were higher on the midterm exams because of mark inflation (since many of the highest achieving gr~de 8 students were in immersion classes and hence were not part of this group), or because the students knew they were in a research project, or for any other reason. There is, furthermore, no way to tell whether the midterm exams in the two schools were of comparable difficulty, since the topies taught in the two schools in the first term were not ic1entical. It is interesting, however, to note which students were succesfiful, and which were not. lt is considered normal that marks in grade .,,9 improve somewhat over those of the grade 8
Grade 9 Mathematics in the Computer Lab
TABLE 2. Comparison of scores of pilot and control grc·ups on exams
Group N Grade 8 SO Grade 9 S 0
exam mid-term
Pilot 26 52.65% 12.4 67.3% 16.3
Control 26 53.4 15 .. 0 63.7 17.1
mathematics exit exam, but the expectation is for an increase of per-haps five percentage points. The main, and important, difference found on the January mid-term exam involved gender. The girls, in general, improved considerably in both schools.
As
can be seen in Table 3, this difference is statistically significant.TABLE 3. The relation between January exam scores and gender - Analysis of variance Source Male between Female wlthin TOTAL OF 50 51 SS 2442 12691 15132
MS
2442 254 F 9.62· P 10.003A doser analysis of this difference in scores shows that there is a greater difference in scores at the pilot school than at the control school, in that this difference is statistically significant at the 99% level, whereas it is not so in the control group. This is illustrat~d in Table 4. TABLE 4. Scores of pilot and control groups on exams by gender
Pilot Number Grade 8 Grade 9 mid-term
Girls 15 53.1% 73.87%
Boys 11 53.4 58.36%
Control Number Grade 8 Grade 9 mid-term
Girls 15 55.1 % 68.09%
Boys 11 51.4 55.9%
In the pilot group, every girl in the class improvcd. Two-thirds of the girls had a mid-year grade which was more than ~O percentage points higher than the grade 8 score; the others aU had gr~des which were from 10 to 19 percentage points higher. The seven girwwho had an A (80% or more) at mid-year had received scores ranging nom 38% to 68% on the grade 8 exit exam. A description of these sco~ is set out in Table 4 above. The boys showed some improvement also. but not to as marlCed a degree. In particular, one-quarter of the boys had a mid-year grade
Penelope J. Qurney
which was more than 20% higher than that of the grade 8 exam, and 19% had grades which were from 10 to 19% higher. The four boys who had an A at mid-year included the only three in the class who had an A on the grade 8 ex~t exam, plus one who had received only 47% on the grade 8 exam.
In the control group there was also sorne improvement, and again the improvement was more striking for the girls than for the boys. Approxi-mately 12% of the boys and 44% of the girls had a score at mid-year which exceeded their grade 8 exam score by 20 percentage points or more, while an additional one-fourth of both boys and girls surpassed their grade 8 scores by 10 to 19 percentage points. The number of A grades at mid-year was a little higher, with the four boys and six girls increasing to six boys and ten girls. Two boys and one girl went down from an A to a lower grade, while three boys and five girls went from Bs and
Cs
to the A grade.In neither the pilot group nor the control group was anything known about their instruction in grade 8 mathematics before they entered secondary school. The only thing known was that aIl grade 8 teachers of mathematics follow the same curriculum, and that all students write the same mathematies exam at the end of the school year. The order of instruction was therefore an unknown variable in the experiment. A second unknown effect was that of destrearning. This was the first year in which students in grade 9 had not been placed in different classes according to demonstrated ability in subject areas such as rnathematics. As a result, sorne students followed a more difficult curriculum than they would have followed in previous years, while others had foUowed a less challenging program. At the midway point, this did not appear to have harrned the students.
In examining the individual topies taught during the year, topic by topie, sorne interesti~g trends appeared. In the control group, there were several streams .~f students. There were, first of aU, those who did consistently weIl onéach selected problem, and those who did consist-ently poorly. Thesestudents neither improved nor changed for the worse during the cowse. Next, there were students who started off weU, and became consistè~i.tly worse during the year. There were also those who improved steadily during the year. FinaIly, there were those who altemated between good and poor work.
This did not occur in,the pilot group. In this group, there appeared to be only two strearns.The first consisted of those who did consistently
Grade 9 Mathematics in the Computer Lab
well, while the second altemated between good apd poor work. Hence, it appeared that the students in the pilot group had taken control of their own progress, and worked to improve it. The streams which were evident in the control group data did not appear in the
data
from the pilot group.END-OF-YEAR RESULTS
The end-of-year results for the pilot group did not closely resemble those of the mid-year. They were not as encouraging, for either the . group as a whole or for the girls. Two different measures were examined at the end of the school year. The first of these was simply the final exams in the two schools, as compared to the grade 9 entrance exam and the January exam. This appears in Table 5 helow.
TABLE S. Exam scores for two samples by gender
Pilot Number Grade 8 Grad~ 9 Grade 9
mid-term final
Girla 15 53.1% 73.6% 66.2%
Boys 11 52.0% 58.36% 57.7%
Control Number Grade 8 Grada 9 Grade 9
mid-term final
Glrla 15 55.1% 68.09% 58.9%
Boys 11 5V~% 55.9% 52.36%
As
can be noted in Table 5, the improvements found on the grade 9 mid-term did not persist for the female studentsm
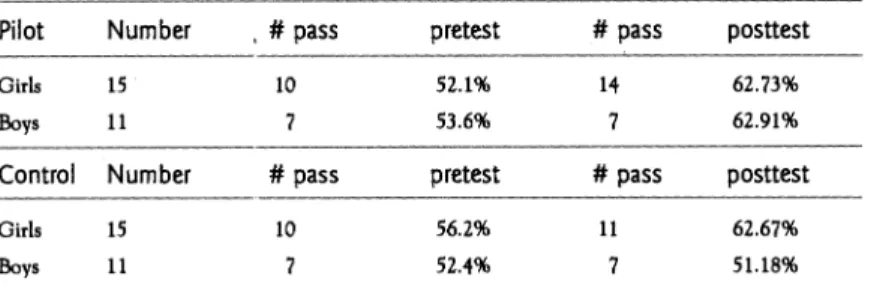
the end of the year, although the girls in the pilot sample apparently did retain more of their gains than did either the boys or the control sample.The posttest scores could not he used in analyzing results, since one of the classes in the pilot school did not write the 1i,est under test condi-tions, but rather used it as an optional review in preparation for the grade 9 examination. Copies of these final examinations had heen made, however, and the examinations for grade 9 mathematies in both schools contained questions similar ta those of the grade 8 exit exam for more than' 90% of the tapies. This fact is due to the nature of the destreamed grade 9 curriculum, in which an attempt is made to bring aU students ta a common level. Hence these questions were used in the comparison of the grade 8 and grade 9 achievemer·t levels in mathemat-ics tapies. The results appear in Table 6.
Pene/ope J. Gurney TABLE 6. Scores on common elements: Beginning and end of grade nine Pilot Number , # pass pretest # pass posttest
Girls 15 10 52.1% 14 62.73%
Boys 11 53.6% 7 62.91%
Control Number # pass pretest # pass posttest
Girls 15 10 56.2% 11 62.67%
Boys 11 7 52.4% 7 51.18%
From this table, it can be seen that one group of students, namely, the boys in the control group, did not improve their scores on basie math-ematieal questions during the grade 9 year. The general difference in scores was not statistieally signifieant, due probably to the small sample sizej yet the nature of the individual scores of these boys is interesting. Of the six boys who had faHed the grade 8 entrance exam, five failed the equivalent questions at the end of grade 9, and four of these had scores as much as 30% lower than in grade 8. This occurred despite the considerable amount of extra help provided for these students during the course of the year. These grades kept the average at the grade 8 level despite the improvement of sorne boys during the year. Overall, in the control group, eight students failed the grade 8 material on the grade 9 exam, while two of the pilot group did. Hence overall, the girls from both groups improved their scores on the fundamental grade 8 topies repeated in grade 9, as did the boys in the pilot group.
Individu al interviews
One-on-one intervÏtws with students in the control group and the experimental group were conducted near the end of the term. The teachers were directed to select four students who were good in math, four who were poor in math, and four students who were average in mathematies; they were further asked to ensure that half of each set were boys, and half girls. Hence the selection was not entirely randomized, in order to ensure that each sample held both girls and boys of various demonstrated levels of ability. During each interview, the student had four problems to solve, white providing a running commentary on his or her thoughts during each attempt to solve a problem. The prohlems were of different kinds: each student had one problem whieh could he solved only by drawing a diagram; one which could be solved by step-by-step logieal argumentj and two which could be solved in different ways. Many of these were chosen from the Ontario Assessment Instrumen~ Pool for grades 7 to 9. During each interview, the
Grade 9 Mathematics in the Computer Lab
student sat at a table with paper of various sizes, graph paper, protrac-tors, rulers, compasses, and aU kinds of manipulative material within easy reach.
1 t was obvious in the interviews that the students were not used to the kinds of problems with which they were presented, in that they reaUy had no idea of what to do with the problems presented. The ways in which the pilot and control students dealt differently with the problems are, however, instructive. First, and perhaps most important, is that very few students drew any diagrams at aU, let alone for those questions which could not be solved without onej and those few who did draw diagrams, often did not draw correct diagrams which might help them in the problem solution. There were two individuals, however, one boy in the control group and one girl in the pilot group, who did draw appropriate diagrams where such diagrams would helpj there was also one boy who used the manipulative material on the table to build a scale model to solve a problem in which such an approach was very useful. The boy in question, from the pilot group, was not considered by his teachers to be a good student of mathematics, but he was the only student to solve the problem correctly.
There were differences between the two groups in sorne aspects of problem solving, but these differences did not have anything to do with the use of computers in the classroom. The students in the control group had obviously been taught sorne basic problem-solving strategiesj most of them wrote down the given information on a separate sheet of paper, and then looked for something which could be answered. If the problem mentioned percentages, for example, dlen percentages were determined in a manner which was mathematically correct, though not aU the percentages found were those asked for. The students in the pilot group had no such strategy in mindj these students, for the most part, decided on a plan of action by guesswork, or attempted, unsuccessfuUy, to obtain hints from the observers. They showed no evidence of know-ing how to solve problems, or even of havknow-ing met any of the corn mon strategies in the grade 7, 8, or 9
Guidelines Far Mathematics (1985).
Furthermore, these students did not understand sltfficient mathematics to begin to solve sorne of the problemsj for eXaJllple, the majority of these students did not know how to caIculate a pe~centage, how to find an area, or how to substitute values for variables in an equation. In fact, six of the 12 students in the pilot sample simply refused to attempt problems which they did not feel confident about solving, compared to none of the control sample. SpecificaUy, a probIem which had severalPene/ope J. Gurney parts, or which required a diagram to be drawn, was more likely to be refused, whereas a short, one-sentence question would most likely be attempted.
The questions dealing'with logical thinking were well done by the majority of students in both groupSj all students demonstrated an ability to think clearly and reason mentaIly to come up with a conclusion which made sense. The other problems, however, did not fare as weIl: the standard problems, and the problems requiring diagrams, were not, in general, well-done. There was little evidence of ability to visualize situations, or to relate the questions to mathematical concepts. A problem which had to be broken into several small problems was, in general, poorly done, since the students who attempted this kind of question often ended up getting lost in the detail. The control sample did, however, succeed in solving approximately two-thirds of each problem of this type,while those in the pilot sample managed at most one-quarter of the problem.
There was a noticeable difference in both samples between the behav-iours of boys and of girls, in that the boys attempted to do everything mentally, while the girls would write things down. This was particularly noticeable in the control sample, where all students tried to solve aU the questions, but also existed in the pilot sample, for those questions which were attempted. Only after aU mental efforts had failed, would the boys write anything down. As a result, the arithmetic computations clone by the boys were often incorrect, even when the methods were correct. When the diagrams which had been drawn were examined, they bore little resemblance to the problems which they purported to representj the students were not able to visualize the problems. For example, one of the questions dealt with a tree which had a rope attached to the top of the tree and the ground, while another talked of a cliff, and an observer who walkeddirectly away from the cliff. For neither problem was a good diagram drawn: in the tree problem, not one student drew a line representing the ropej while in the cliff problem, the cliff was not drawn as a verticalline (to the ground), but rather was represented by >, neither horizontal nor vertical, and with no connections to any-thing. Measurements which were provided served only to verify one of the common myths of problem-solving, namely, that "if a problem contains two or morl! numeric values, then the solution can easily be found by combining these values to obtain a numeric result." Four students (three from rhe pilot sample and one from the control sample) combined angle meamre and side measure to obtain either a sum or a
Grade 9 Mathematic$ in the Computer Lab
product, which somehow seemed reasonable to them, rather than sim-ply draw a diagram and measure the desired value. Only two students out of the 24, one from each group, ttied an approach which had a chance of leading to the correct solution.
At the end of each problem-solving episode by students of the pilot sample, a set of six questions were asked about the use of computers in their mathematics classroom.
These questions asked the student to specify theit usage of the comput-ers both inside and outside of the mathematiCl; class, the degree of assistance provided by the computer software in l!arning mathematics, and whether the students enjoyed the process. .
One of the students had replies which were differcnt from the others in the samplej this one student did not use the comp~lters much during the math class, and did net like them, while the otl.er eleven stated that they had used the computer extensively, and did like using this technol-ogy. The students stated that the computer was "fun", and that using the computer was easier because "you don't hav~ to write everything out on paper". They felt, furthermore, that the ccmputer is better than ordinary classroom instruction beca~ the computer is an individual assistant, who can provide immediate help and immediate correction. Of the twelve students, however, five felt that they could have leamed just as much from a textbook, or from normal clasl interaction, but four out of the five did enjoy the computers more than regular class. None of the students used the computers outside of class for mathematics, although they did use computers for other things, such as word processing. In the pilot classroom, the software used was found to be inadequate for direct instruction, and was used more for practice and drill. The teach-ing method saon settled into a short lesson, followd by a brief worksheet, then finally the computer component. The topics dealt with by the software included calculations, order of operatior:$, integer arithmetic, fractions, exponents, algebraic relations, and word problems, while utility software, such as function graphing, charts, and spreadsheets, were also used.
DISCUSSION
It is clear from the attitudinal questionnaire that rnany of the students in grade 9 have an unrealistic low opinion of the benefits of mathemat-ics, in that many of them do not believe that mathematics is necessary for the world of work. Furthermore, these students do not know whether REVUE DES SCIENCES DE L·tDUCATION DE MCGILL • VOL 31 N° 1 HIVER 1996 97
Penetope J. Gurney they have any skill in. this area, nor what their strengths and weaknesses are. One partieular student, for example, who stated that mathematies is easy, did not have' a mark on any test greater than 40%, while an excellent student, with excellent marks, thought that she could not do advanced mathematies. It may be optimistie, therefore, to think that one can change the ;~ttitudes of such students towards mathematies at this late date in their schooling.
The results from the examinations on content, of both grade 8 and grade 9 material, show that in the pilot group, grade 8 basie material was leamed during the grade 9 year, and that the new grade 9 topies were better completed by the girls than the boys. This is illustrated by the fact, as shown in Tahle 4 and Table 5, that the scores received on the grade 9 final ( topies from both grade 8 and grade 9) were higher for the girls, and lower for the boys, than the score on the grade 8 material alone. For the control group, the girls appeared to have leamed more of the grade 8 math topies and fewer of the grade 9 topies, while the boys did the oppositt!.
It is partieularly inter,esting to note that the girls in both the pilot group and the control group showed greater gains in mathematies achieve-ment than did the boys during the first part of the year. In the control group, the higher achievement continued while elementary material was retaught, while in the pilot group, the improvement coincided with the use of computers in the classes. It is possible that the girls in the control group appreciated the mastery leaming approach to mathemat-ies, and the second chance to leam elementary topies whieh had not been mastered earlier; In the pilot group, the achievement levels of the girls improved significantly more than the boys while the computers were being used, but these gains were not aU maintained during the non-computer portion of the course. lt is possible that the use of computers provided these girls with individual attention whieh could not exist in a normal classroom; it is also possible that the novelty of the situation provided the girls with greater incentive to work at mathematies, since few girls had used computers previously other than for ward processing, whûe most of the boys were familiar with computer games. At this time, it cannot be concluded that the use of the computer software provided in the pilot mathematies classroom was of signifieant benefit to the students studying new material in mathematies. There may well have been an advantage for both boys and girls in the leaming of the grade 8 materiaI whieh they had not leamed previously, as shown
Grade 9 Mathematics in the Computer Lab
",'
•
in Table
5;
but in learning new material, the results are not clear-cut. What is known, however, is that much of the software available during the study did not match precisely the mathematics curriculum being taught, and hence that better, and very much more expensive, software would have to be written or purchased in order to test adequately the usefulness of the new technology. The software available in the market does not, in general, match the curriculum being taught in our schools, and appears suited only for review of previously leamed material. This review material does have potential for use by students who need more reinforcement than is feasible in a regular cl~sroom. Of particular importance are those programs which do more than provide "yes or no" feedback, but rather lead the student through a bOlution, step by step. The teacher still has to provide other methods of solution, but the computer can provide one-to-one attention where needed.At this point in the research, more questions have been raised than have been answered. The question of effectiveness of computer soft-ware has not yet been adequately answered, siru;e this would require more expensive software than is currently reascnable. The currently available software, however, will not replace any instruction by teach-ers. Furthermore, it is indeed possible that girls who have not mastered the basics in mathematics can benefit from standard software, but this is only suggested from the data, not proven beyot;d doubt. In addition, the gender differences found in the results in both grade 9 groups suggest that possibly new approaches must be found for adolescents who have not reached expected levels of achievement in mathematics.
As
shown in Table 5, students in the pilot (computer) group did leam enough of the earlier mathematics topics to warrant a pass on these topics, but the average scores were still only at a C level, which is not very high for such material. The girls in the control group, but not the boys, also improved their scores only to this level, which is
disappoint-ing in a mastery approach. >
On another general topic, the whole issue of the teaching and leaming of problem-solving needs to be addressed. The difficulties in this do-main appeared to be at a deep level: even those students who had memorized a list of techniques for problem solution seemed unable to apply them appropriately. Moreover, there was a lack of understanding of the actual questions being asked, and a lack of ability to visualize the situations in which the questions were posed.
It is important to consider this study as a starting place for future study, on questions not only of teaching methods, but also of attitudes towards
Pene/ope J. Gurney mathematics, preconceptions of students towards mathematics, and gender differences in the study of mathematics.
In conclusion, a board of education cannot entrust the mathematics education of student::.i to computer-based materials unless it is prepared to make a very significant expenditure for superior software. Since such superior software does not yet exist for complete courses, or even for complete units, the question is academic at this time. It was originally thought that computer software might replace the need for textbooks, but this has not haPI'ened either: textbooks are still a necessary part of the mathematics proJram. In order that current software be used effec-tively, the classroom'teacher must teach the topic to the student in the same way as the computer software, which runs counter to the current philosophy of multipl! approaches leading to understanding. The teacher must also teach the s1:Udent how to use the software, since there is little standardization in the user interfaces for different pieces of software. Furthermore, much of the inexpensive software addresses only one-line questions, and hence is not suitable for advanced work. The teacher ends up having to do more work in integrating computers into the curriculum than the integration is worth.
REFERENCES
Aylwin, S. (1985). Structure in thought and feeling. New York: Methuen.
Capper,
J.
(1988). Computùs and /eaming: Do the'J wOTk? Office ofTechnology Assessment Contract Report. Washin~ton DC: Center for Research into Practice.Dinkheller, A., Gaffney, J., & Vockell, E. (1989). The computer in the mathematics curriculum. Santa Cruz, CA.: Mitchell.
Farrell, M., & Farrner, W. (1988). Secondary mathematics instruction: An integrated approach. Providence, RI: Janson Publications.
Fennema, E., & Sherman.
J.
(1976). Fennema-Sherman Mathematics Attitude Scales: Instruments designed to measure attitudes toward leaming of mathematics by females and males. Catalog of Se/ected Documents in PS'Jchology, 6(1),31.Fey,
J.
(Ed.). (1986) Aigebra with ComPUteTS. College Park, MD: University of Maryland. Gumey, P. (1992) On the association between modes of mental representation and mathematics experience in pre-service education students. Unpublished Ph.D. thesis, University of Ottawa.Heid, M.K., Sheets, C., & Matras, M.A. (1990). Computer-enhanced algebra: New roles for teachers and students. In T. Cooney &
c.
Hirsch (Eds.), Teaching & /eaming mathematics in the 1990s. Reston, V A: National Council of Teachers of Mathematics. Hiebert, J., & Carpenter, T. (1992). Leaming and teaching with understanding. ln D. Grouws (Ed.), Handbook on mathematics teaching and leaming. New York: Macmillan, pp. 65-97.Grade 9 Mathematics in the Computer Lab
Hollowell, K., &. Ouch, B. (1991). Functions and statisties wh:h computers at the college level. A report prepared for the American Educational Research Association Annual Meeting, University of Delaware.
Kaput,
J.J.
(1992). Technology and mathematies education. ln D. Grouws (Ed.), Hand-bookof
research on mathematics teaching and leaming. New Y ork~ MacMillan,pp. 515 - 556. Lafortune, L., &. Kayler, H. (1992). Les femmes font des MATHS. Montréal: Les Éditions du remue-ménage.Mcleod, D. B. (1992). Research on affect inmathematies educarion: Areconceptualization. ln D. Grouws (Ed.), Handbook of research on mathematics teaching and leaming. New York: MacMillan, pp. 575 - 596.
Ontario, Govemment of. (1985). Mathematics, curriculum gtÎideIine far intennediate and
senior dWisions. Ministry of Education for Ontario.
Smart,
J.
(1987). Implications of computer graphies applications for teaching geometry. In M. Lindquist &. A. Shulte (Eds.), Leamingand teaching geùmetry, K-I2. Reston, VA: National Council of Teachers of Mathematies.Steen, L. (1990). Mathematies for ail Canadians. In T. Co.lney &. C. Hirsch, (Eds.), Teaching el leaming mathematics in the 1 990s. Reston, VA: Naional Council ofTeachers
of Mathematies. .
Thomas, D.A. (1991). Children, teachers and mathematics. Maryland: Allyn and Bacon.
PENELOPE J. GURNEY is an assistant professor in the Faculty of Education, University of Ottawa, specializing in mathematicsand computer science methods courses, and methods and interpretation in quantitative research.
PENELOPEJ. GURNEY est professeure adjointe à la Fa(:ulté de l'Education de l'Université d'Ottawa et se spécialise dans la didactique des mathématiques et de l'informatique, et les méthodes et interprétation en recherche de type quantitatif.