EFFECT OF CONCENTRATED LOADS ON SHALLOW BURIED POLYVINYL CHLORIDE AND POLYETHYLENE TUBING
by
TIMOTHY JAMES MCGRATH
BS, Northeastern University (1973)
Submitted in partial fulfillment of the requirements for the degree of Master of Science in Civil Engineering
at the
Massachusetts Institute of Technology September, 1975
Signature of Author • • • • r " • • • • . ...- ./..- • 0 . . . ~ • • • • • • • • • . . . . . Departtfnent of Civil Engineering, June 27, 1975
~~ .,.; ~ /.,..,~ P >
Certified by. 0 • • e • • • • • • • • -.-- 0 • • • • • • • • • • • • • • Thesis Supervisor
Accepted by • • • • • II ., • • - • •p .
Chairman, Departmental Committee on Graduate Students of the Department of Civil Engineering
ABSTRACT
EFFECT OF CONCENTRATED LOADS ON SHALLOW BURIED POLYVINYL CHLORIDE AND POLYETHYLENE TUBING
by
TIMOTHY JAMES MCGRATH
Submitted to the Department of Civil Engineering on June 27, 1975 in partial ful-fillment of the requirements for the degree of Master of Science in Civil
Engineer-ing0
This thesis presents a study of the behavior of PVC and corrugated PE plastic pipe under simulated wheel loads. Data is presented on pipe deflections, soil-pipe interface pressures, and soil strains for pipe buried with 6, 12 and 18 inches of soil cover and surface loaded with 10,000 pounds on a 10 inch diameter plate. In 5 of the tests the PVC pipe was instrumented with strain gages on the inside and outside of the pipe at the crown, invert and springlines. The test results are compared with an elastic theory for deeply buried pipe to observe if the elastic predictions can be used as a design basis for the shallow burial-concen-trated load problem.
Thesis Supervisor: Title:
Herbert H. Einstein Associate Professor of Civil Engineering
ACKNOWLEDGEMENTS
This proiect was funded in part by The National Cooperative Highway Research Program, Proiect 4-11 whose assistance was greatly appreciated. Thanks are also extended to all the employees of Simpson Gumpertz and Heger Inc. who helped in preparation of the final manuscript, especially Mr. Richard E. Chambers, whose time I frequently monopolized in search of advice and support. Mr. Joe Rixner of Haley &Aldrich Inc. helped me out with many of my soils problems, Dre Ernest T. Sel ig of the University ot' Buffalo provided a great deal of his time and equip-ment to help conduct the test program, and Professor Herbert H. Einstein of MIT aided in developing the test program, and provided many useful suggestions in writing the manuscript. My greatest thanks are due to my wife, Ginny, who managed to supply a great deal of moral support and give birth to a beautiful baby daughter in the middle of it all.
CONTENTS Page Title Page Abstract 2 Acknowl edgements 3 Table of Contents 4 List of Tables 6 List of Figures 7 CHAPTER INTRODUCTION 9
CHAPTER 2 THEORETICAL ANALYSIS 12
2.1 Material Properties 12
2.2
Buried Pipe Design 142.2.1 Soil Structure Interaction 14
2.2.2
Finite Elements 172.2.3
Elasticity Solutions 202.3
Previous Studies 21CHAPTER 3 TESTING PROGRAM 27
3.1 Apparatus
27
3.2
Samples 303.3
Test Procedure 323.4
Test Resul ts 353.4.2
Defl ections40
3.4.3
PVC Strains43
3.4.4
Effect of Flat Bedding50
3
e4.5
Load Plate Settlements50
3.4.6
Effect of Tank Size on Pipe Performance 50CHAPTER 4 DISCUSSION
54
4. 1 Criteria For Establ ishing a Minimum Depth of Cover
54
4.2
Allowable Minimum Cover 584.3 Design For The Concentrated Load-Shallow Burial
Situation 63
CHAPTER 5 CONCLUSIONS 67
5. 1 Minimum Cover
67
5.2
Design Method 685.3
Recommendations For Future Research 69References 71
APPENDIX A BURNS AND RICHARD ELASTICITY SOLUTION 73
LIST OF TABLES
Number Title Page
2.1 Physical Properties of PVC and PE 13
3.1 Physical Properties of Samples Used In Test Program 33
3.2
Summary of Test Conditions 364.1 Deflections and Stresses at 10,000 Pound Load 60
Number 2. 1
2. 2
2. 3
2. 4
2. 5
2. 6
3. 13. 2
3. 3
3. 4
3. 5
3. 6
3. 7
3. 8
3. 9
3.10 3.11 3.12 3.13 LIST OF FIGURES TitleStrength Variation With Temperature In PE Determination of One-Dimensional Modulus Radial Pressures On Pipe for Various Load Widths Radial Pressures On Pipe for Varying Depth of Cover Hoop Bending Moment In Pipe for Various Load Widths Piosson Effect Inan Elastic Material
Cross-Section Through Test Tank and Load Apparatus Instrumentation Locations Around Test Pipe
Stresses In Sand Without Pipe Crown Soil Stresses for PE Pipe
Typical Pressure Distribution Around Test Pipe Effect of Bearing Failure On Pipe Deflections Deflection Profile Along PVC Pipe
Deflection Profile Along PE Pipe
PVC - Vertical Deflection Vs. Load PE - Vertical Deflection Vs. Load Crown Strains - PVC - Dense Sand Crown, Invertand Springl ine Strains
Variation In Crown Bending Strains With Load Condition
18 18 23 23
25
25
28 31 37 39 39 41 42 42 4444
4547
483.14 Variation In Springline Thrust With Load Condition 49 3.15 Comparison of Flat and 90 Degree Bedding Influence On
Vertical Deflections 51
3.16 Comparison of Flat and 90 Degree Bedding Influence On
Bending Strains 52
4. 1 Extrapolation of Deflections In Loose Soil to 10,000 Pound
Load 59
4. 2
Stresses for Use In Burns and Richard Analysis 64B1 Sta ndard Compaction Test Resul ts 78
CHAPTER 1
INTRODUCTION
Over the past twenty years plastic pipe has seen increasing usage in a wide variety of applications. Among these applications is drainage of roadways, both in the form ofstorm sewers, and underdrains. Plastic pipes are light, flexible, and,
since they are manufactured by extrusion processes, can be produced in any reason-able length desired. These factors help in reducing construction costs by reducing the manpower and equipment needed to place individual lengths, and by reducing the number of field ioints. Plastic piping systems can also be desirable due to their resistance to the corrosive effects ofmany fluids, which 'NOuld shorten the Iife of other pipe materials.
Structurally, buried pipes mustbe designed for two types of load after installation, earth loads, which are simply the 'Neight of soil bearing on the pipe; and live loads, which are primarily wheel loads imposed frorri the surface. Soil pressures due to wheel loads are generally insignificant for smaller pipes buried over ten feet, but they increase very rapidly with decreasing burial depth until they are predominant at depths less than about four feet. During road construction, particularly high-ways, the weight of construction equipment rolling over pipe installations before backfilling is completed can create a more severe loading condition than the pipe
will ever be subiected to again. To reduce these loads, ASTM specification 02321, for the installation of thermoplastic sewer pipes does not permit heavy equipment to travel over buried pipes until 2.5 feet of cover is placed and com-pacted over the crown of the pipe. If such provisions were removed or lessened the cost of road construction might be reduced by allowing contractors more freedom; however, culvert technology has not as yet provided a method to design for wheel loads and shallow burial. Until such a method is developed, these restrictions must be used to prevent damage to drainage systems.
The purpose of this thesis is to study the structural performance of buried plastic se'Ner and drain pipe under simulated wheel loads, and to establish the following:
1. An indication of minimum cover required to protect plastic pipe installations from construction equipment loads. This depth is governed by the magnitude of the load, the rate at which the load attenuates with increasing depth and the physical properties of the pipe and surrounding soil.
2. Arational design approach to treat the concentrated load problem.
Due tothe multitude of types and shapes of plastic pipe available, it is necessary to restrict this thesis to two particular piping systems, polyvinyl chloride (PVC)
CHAPTER 2
THEORETICAL ANALYSIS
2. 1 Material Properties
Structural analysis ofplastic pipe must of necessity begin with a brief look at
plas-tics and the processes that make them into pipes. Plasplas-tics are organic compounds whose properties are dependent upon molecular structure. PVC and PE are both thermoplastics, that is their properties vary with temperature. Figure 2.1 shows this variation for polyethylene. The effect on PVC is similar but less pronounced. Thermoplastics are manufactured into pipe form by 1) heating a resin, 2) forcing it through an extruder, 3) performing any molding operations necessary (corruga-tions, belled ends) and 4) cooling the finished product. The properties of the finished product are affected by such factors as the type and formulation of resin, the manufacturing process, and the processing temperature. The structural pro-perties of plastics vary also with time, however,since this thesis is studying short term loads, only short term properties will be discussed.
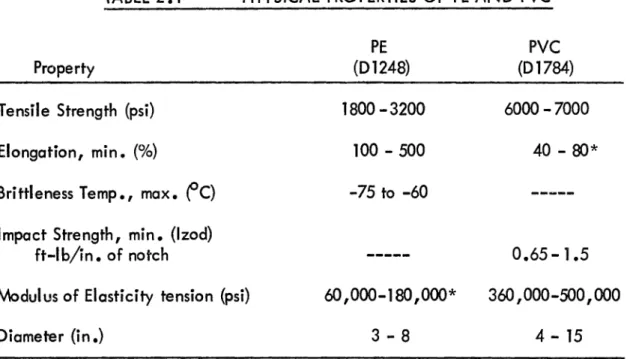
Corrugated PE underdrain pipe is specified in ASTM standard F405-74 which in turn calls for material conformance with ASTM D1248. Some of the physical pro-perties of PE from D1248 are shown in Table 2. 1.
PVC sewer pipe is governed by several specifications (02729, D3033, D3034).
D2729 is for a thinwalled pipe, while D3033 and D3034 specify pipe with thicker
walls and are almost identical. All three specifications refer to the material stan-dard 01784 for the plastic specification. Some of the physical properties for PVC
from 01784 are shown in Table 2.1.
TABLE 2.1 PHYSICAL PROPERTIES OF PE AND PVC
Property
Tensile Strength (psi) Elongation, min. (%)
Brittleness Temp., max. fC)
Impact Strength, min. (lzod) ft-Ib/in. of notch
Modul usof Elasticity tension (psi) Diameter (in.)
PE
(D1248) 1800 -3200 100 - 500 -75 to -60 60 ,000-180 ,000* 3 - 8 PVC (D1784) 6000 -7000 40 - 80* 0.65-1.5 360 ,OOO-SOO ,000 4 - 15*Taken from Ref. 1, not specified by ASTM
Since both of these material specifications were primarily intended for pressure pipes, which are normally stressed mostly in tension, no compressive or flexural strengthsare specified. PVC plastics typically have compressive strengths of about 9500 psi and flexural strengths ofabout 12,000 psi. PE plastics have a compressive strength of about 3100 psi and a fl exural strength of about SOOO psi.
2.2 Buried Pipe Design
Historically the design of buried tubes (i.e., pipes, culverts, etc.) has been divided into two fields, one for IIrigidll
conduits such as concrete pipe and the other for lIf1exiblell
conduits such as corrugated metal culverts. Kigid conduits are designed to resist earth and Iive loads primarily by internal forces. This
meams that the main form of resistance is through bending moments, resulting in rather stiff sections and therefore the classification IIrigid.II Flexible conduits
however are designed to deflect laterally under load in order to utilize the passive resistance of the surrounding soil. This type of design resists loads more by mem-brane action than by bending and resul ts in much thinner sections. The maior
difficulty with these traditional culvert design practices is that they were developed empirically for specific types of pipe and do not provide an adequate design method for
all
buried pipes. That is, there isan intermediate range of stiffnesses forwhich
neither design method is adequate, as is discussed below.2.2.1 Soil-Structure Interaction
The traditional design methods mentioned classify installations as flexible or rigid
solely
from the bending stiffness of the pipewall,
called the IIring stiffness":s
=
EID3
E = Modulus of elasticity of pipe material (psi)
I
=
Moment of inertia of pipe wall per unit length (in. 4;in.)with respect to ring bending
D
=
Mean diameter of pipe (in .)In recent years, however, a better understanding of the soil structure interaction around pipes has brought into use a new parameter, the flexibility coefficient:
M
sF =
-S
where F = Flexibility coefficient (dimensionless)
Ms
=
One-dimensional compression modulusof soil (psi)I(See below for discussion of this parameter.)
The flexibility coeffi cient is a more sui table parameter for the description of buried pipe installations because it shows that performance is governed by the relative stiffness of soil and pipe, rather than the absolute value of either one. That is, a given pipe installation could be considered either flexible or rigid depending upon the soil in which it is buried.
It has also been shown by Lew (3) and Selig (4), that the performance of a buried pipe can be influenced by the ring compressibility of the pipe. This can be the case in metal culverts where sl ip can occur in bol ted ioints, and in plastic pipes,
described by the compressibil ity coefficient:
where C = Compressibility coefficient (dimensionless)
A
=
Cross-sectional area of pipe wall per unit length (in.2/in.)Allgood (5) suggests that a system for which F is greater than 1000 be classified as flexible (in the traditional sense) and any system for which F is less than or equal to 10be classified as rigid. The area in betYleen is the aforementioned lIintermediate" range. Considering that a typical value for the ring stiffness of
PVC or PE pipe is about 1.0 psiI then by All good 's cl assifi cation any pipe buried in a soil with Ms less than 1000 psi would be in the intermediate range. This indicates that for plastic pipe it is desirable to find a new design method which can treat the entire range of pipe stiffness.
Both of the above coefficients use the one-dimensional modulus (MJ as the para-meter to describe soil stiffness. This replaces the soil parameter traditionally used in flexible conduit design, the modulus of soil reaction (E '). The modulus of soil reaction is used with the Iowa formula for determining flexible conduit deflections,
but is highly empirical. Krizek (6) presented a number of attempts at correlating E' with other soil properties but these have never proved entirely satisfactory. The one-dimensional modulus however can be determined from a simple laboratory
test. The procedure calls for determination of a stress-strain curve for the test
soil in its natural state. The one-dimensional modulus is then selected as the slope of the secant from zero to the point on the curve which represents the cal-culated load. This procedure is shown in Figure 2.2. It is important to note that this procedure involves the assumption of linear stress-strain characteristics in the soil. This is adequate in general, however some investigators (6, 7) have introduced methods of treating the true non-linear behavior of soil.
Methods that are presently available for the analysis and design of buried pipe that can treat circumferential stiffness, as well as the intermediate ring stiffness range, fall into two general categories, closed form elastic ity sol utions, and numerical methods in the form of finite elemert analyses. Photoelastic and holographic interferometric (8) methods have also been used to analyze pipe problems, but these are not intended as design methods.
2.2.2 Finite Elements
Perhaps the most comprehensive method available for the analysis ofburied pipes is the computerized finite elementapproach. Finite elements in their most com-plete form can be used to analyze almost any situation, such as concentrated loads, poor bedding, non-uniform soil or non-linear soil behaviorc Some solutions have even been made to treat longitudinal effects along the length of the pipe.
/0000 ~-~ ~-"""IIIIl-""" """'Ill'~
'"""'
... ... ~ -'ilIIIl '--~ ~."
~,"
-20 0 +20 +4fO ~ ~ -1-/00 TEMPeRATURe(DC.)
Yiel...o
SrteE5S(psi)
- - - UL.rIMATE T!!!!NSIL-E S'rRENarrt
(psi)
Flauli'6
2./
5'rlCeNarH
VARIATION WItH IFMPeIfArU/fc INPc
(I=R'OJW ~eF.
2)
p
-
.
.
..
.
..
.
...
program for culverts called CANDE (Culvert Analysis and Design). T\I\<) of these levels use finite elements, one having a standard, internally defined mesh repre-senting the system while the other allows the mesh to be completely defined by the user. The third level of this program is an elasticity solution by Burns and Richard
which will be discussed in Section 2.2.3.
Although finite element analyses could provide such a thorough solution to the shallow burial-concentrated load problem, there are tY/O major factors which make it less desirable as a design method:
1. Computerized solutions can frequently be time-consuming and expensive. In the case of small pipe, which is frequently governed byother criteria (e.g., handling), it isonly rarely
that one can iustify this expense.
2. Any analysis isonly as accurate as its input. The variability of soil compaction and bedding effects are extremely difficult to predict, and are highly variable along the length of a pipe. The result of this variability is that an engineer using the finite element method must either check numerous possible conditions, or else accept a sophisticated analysis using mostly estimated properties and conditions, and leaving as much doubt as to the accuracy of the solution as an approximate analysis.
In view of the above facts, finite element methods will not be considered further asa potential design method for shallow pipes of the type being considered here.
2.2.3
Elasticity SolutionsMost theoretical analyses of buried cylinders consider the soil as a linearly elastic, isotropic homogeneous medium with eithera cylindrical inclusion (Burns and Richard (9), H8eg (10)I Dar and Bates (11), or an equivalent ring of soil
representing the cylinder (Richards and Agrawal (12)). The latter solution models
the pipe wall as a ring of soil with a thickness calculated to give the model the same ring stiffness as the pipe. The problem with this solution is that the ring compressibility and ring flexibility cannot be modelled simultaneously. This method will not be discussed further.
The remaining analyses are all similar and only the Burns and Richard solution (which is presented briefly in Appendix A) will be referred to hereafter, as it is the most commonly quoted. This solution was intended for deeply buried cylinders but has been shown both theoretically (9) end in tests (10) to be accurate for depths of burial as small as one pipe diameter (for uniform loads)I making it applicable in that respect to the shallow burial problem to be studied here. Drawbacks associated with the Burns and Richard analysis are:
1e This solution was developed for a uniform surface loading and needs to be modified to treat concentrated loads appl ied at the surface.
2. This solution considers the cylinder to be perfectly bedded in the soil and also considers the soil to be constant in its properties. Very few pipes, particularly small ones such as underdrains, are bedded perfectly into the supporting soil, and uniform soil con-ditions are rarely achieved in the field.
Despite its limitations, the Burns and Richard solution is a potential design method for the shallow burial-concentrated load problem because:
1• It treats all stiffness ranges of pipeC)
2. It addresses the soil-structure interaction of buried pipe.
3. It is desirable to use the same design method for all phases of pipe design and the Burns and Richard solution is accepted by some as an adequate method for designing deepl y buried pipes.
2 .3 Previous Studies
by Anand (13) and Richards and Agrawal (12) using the finite element method. The Anand study modeled a concrete pipe with one pipe diameter of soil cover over the crown0 The loading was a strip load, varying in width from 1 to 3 pipe
diameters and located directly over the crown. The Richards and Agrawal analy-sis used a Iine load over the crown and varied the depth of cover from 1.2 to 2.0 times the pipe radius and the ratio of pipe material modulus to soil modulus from 1 to 600. Both studies modeled the soil as a Iineerty elastic material.
Figure 2.3, reproduced from the Anand paper, shows the variation in radial pressures on the pipe as the load width increases and also the Burns and Richard solution for a uniform load over the entire surface0 For the narrowest loading condition, Anand found that there is a pressure concentration at the crown. As the load width increasesI this conce ntration decreases, and the pressu re di stri-bution about the pipe becomes more uniform. The Burns and Riehl rd solution predicts a nearly uniform pressure about the entire pipe.
Figure 2.4, taken from the Ricrnrds and Agrawal study shows the effect on the radial pressure distribution of varying the depth of cover over the pipe. There is a very high positive pressure concentration at the crown and a negative pres-sure for rt between 30 and 90 degrees. The concentration is more pronounced
than that in the Anand siudy because there is less cover over the pipe and the load is concentrated.
CAS~ CAS&4 BURNSt RICHARD
\1 "
,
I a-t54.L f" t f • I I t,
\ \ \ \ \ \ o d d [ ) a' - - - C A S E I b=d ---C4~e2b"'2d ---CASE3 b=8d---BURNS AND RICHARD
FiG4 2.3
~o/Ak-P!fCS5uREs ONp!p~FOIf VAR,OU5 LOADWI
DTHSANAND (l3)
---4!R-/..
66
---Z/R=2.0
rlGUte
2.4
!fAD/AI..PJe$S:Su!ees
ONPI,.
/lOR. VAItYIHtJ 061"11 ~p COVI/CThe bending moments in the pipe of the Anand studyI shown in Figure 2.5, are
greatest at the crown, w~ich is consistent with the pressure distribution. As the load width increases from 1 to 2 pipe diameters (i.e., twice the load) the mo-ments also increase significantly, due to the additional surface load. However, as the load width increases from 2to 3pipe diameters, very little cronge in moments occurs, and, as the load width increases further, to the Burns and Richard solution, the moments actually reduce to less than those for Case 1. This beha-vior can be explained by considering the Poisson effect of a stress on an elastic material. That is, a normal stress on an element creates a lateral strain, as shown in Figure 2.6. In Anand's Case 1, the applied load is carried primarily by the pipeI such that the vertical soil stresses, adjacent to the pipe are low,
and no lateral strains are created to resist pipe deformations. The situation is similar in Case 2 where the pipe carries more of the load and develops larger bending moments. The effect of increasing the load width further, howeverI
produces a lesser increase in the load on the pipe, but does increase the vertical stresses in the soil. This increase in confining pressure produces a Poisson effect in the soil, which means greater lateral support for the pipeI and subsequently
lower bending moments. This effect of increasing the load width, is even more pronounced in true soil, which has non-linear stress-strain characteristics. Soil at low confining pressures (e .g., a narrow load) has a low modulus and subse-quently provides little lateral support for the walls of an embedded pipe.
- - CASE. /
b=d
--- CAse
Z
b =2d-~·----CASe.3
b=3d
----BURNS
AND
RICHARD
F!e~
2.5
l100p
BeND/Nez VOMcNT INPipe
FOR ~RIOU5' LOAO WIDTHSANANC (13) IN/TIAL SHAPE
--,t
ex
I
VDEFORMEO :5/-1APEJ
H
~yr
-I I I I L ))= POISSON':5 RATIOMATE.RIAI.-The above anal ysis s".,Jgests that a design method for the shallow burial-concen-trated load problem should address two points:
1 •
Soil
Modulus: As discussed in Section 2.2.1, deep culvert design typically assumes linear soil behavior and uses the secant modulus associated with the vertical load on the pipe to definesoil
stiffness. If the load is a concentrated wheel load, however, the soil behaves as if only the earth load were confining it.This means that the soil modulus selected should either ignore the effect of the live load, or consideronly part of it, depending on the degree to which the load has attenuated.
2. Load Attenuation: Load attenuation with increasing depth has a significant effect notonly on the load on the pipe, but also on the manner in which the soil reacts to pipe deformations. That is, as the load spreads laterally through the soil, it increases the confinement of the soil and hence the soil stiffness which aids the pipe in resisting load.
CHAPTER 3 TESTING PROGRAM
A small scale test program was developed to observe directly the behavior of plastic pipe under concentrated loads, and to determine the accuracy of elastic theory as discussed in Chapter 2. Besides the two types ofplastic being considered two
other variables were introduced:
1. Depth of burial: Tests were performed with 6, 12 and 18 inches of soil over the crown of the pipe. This produced a wide range of pipe behavior.
241 Soil Density: For each depth of cover, tests were performed with
two soil densities, hereafter referred to as uloasell and IIdensell
respectively. By varying the soil density 8to 10pcf a wide range of soil stiffness was achieved. (As will be discussed later the
IIloosell
soil condition is a good field condition while the IIdensell
soil condition is probably better than could be achieved in the field
for the soil used in this study.)
3 • 1 Apparatus
The tests were performed in the 30-inch deep 35-inch diameter cylindrical steel
tank shown in Figure 3.1It A frame vias constructed over the tank to support the
... \ \ ...
.
\ '...
~.
.. , ,.
Loaa'..lock 10" ¢ Plotg: ( ..
~.
...~-
. .
... .....
--
. Dzr'/qc-f7on P~btz_-4_
t"/'Iou'"17:ta'DIDIGogtz )
\ " "• \ , . . .
~~
.i ",\_&' ·
II'"
\ .
, a . .
" " \ \ " , .. " 3.1 ... \.~ ~J \ \ \ , b \ ... \"
\ . .. ' "
.. \ \ \ \. \.
===' l ~ \ . \ \ • • \0 \.~\-t
~-~II
~
from the icck to the soil through a series of shims with a lO-inch diameter circular plate in direct contact with the soil.
The test soil used was concrete sand from a local sand and gravel supplier. This choice was based on tVv'O factors:
1. It is specified as embedment material in several states, especially for underdrains.
2. More uniform materials, such as Ottowa sand, which are frequently used in such studies do not have the bearing capacity to support the intended load, as shown in exploratory tests.
Tests were performed on the sand to determine the maximum standard densityI grain
size distribution and stress strain curves f .he determination of the
one-dimen-sional modulus (Ms). This data is presented in Appendix B. In place, sand den-sities were measured by the rubber balloon method, ASTM D2167.
Vertical and horizontal pipe deflections were measured with dial gages which were mounted in sleds such that they coul d be moved along the pipe length through an access hole in the side of the tank. Deflections were taken at the pipe centerl ine and at 6and 12 inch offsets (See Figure 3.1) •
Interface pressures were measured with 1~ inch diameter stress gages installed in the soil ~to 1inch away from the soil-pipe interface and located as shown in Figure 3.2. These gages utilize a pressure sensitive diaphragm mounted with strain gagesand re·ad on a standard strain indicator.
Soil strains were measured around the soil-pipe interface at the locations shown
in Figure 3.2. The gages used were of the coil-inductance type, 1inch in diameter. In this system, one coil is excited with a known voltage, which in-duces a voltage in a second coil proportional to the distance between the two.
For the tests on PVC with 12 and 18 inches of cover, strain gages were attached to the interior and exterior of the pipe at the crown invert and both springlines, as shown in Figure 3.28 These provided measurements on axial and bending strains in the pipe.
3.2 Samples
Sample size was Iimited to 6 inches in diameter. Using this size pipe assured that there would always be over two pipe diameters of soil on either side of the pipe.
The PVC sample pipes used were manufactured by the Johns-Manville Company in accordance with ASTM Specification 03034, SDR-35. The PE sample pipes were manufactured by Advanced Drainage Systemsand conformed structurally to
~-I Run
II-/~ ~
I-Run 7-/0, 1~·/51 0 "
J
I ...--
Run
G-/~
t
Run//-1= /iit./n I - 10ASTM F405. All sample dimensions were measured to check conformance to the applicable requirements. Twelve inch segments were removed from each sample forparallel plate tests, to check conformance with specified strength requirements. After the load tests were conducted, 12 inches were removed from the central por-tion of the tested samples and parallel plate tested to determine if any strength loss took place. Resul ts of these measurements and tests are compared with ASTM requirements in Table 3.1.
3.3 Test Procedure
Different sand densities were achieved by varying the Iift thickness and the num-ber of tampings. The end of a 4 x 6 tin,num-ber was used as to compact the soil. The IIloosell condition was installed in six inch lifts and tamped twice, producing dry densities of about 102 pcf (90% AASHTO T-99). This density would be considered
a good field installation for this material. The sand for the lldensell
condition for this test program was installed in 2 inch lifts and tamped 3 times, producing dry densities of about 110pcf (100% AASHTO T-99). This density is greater than could normally be achieved in the field for this material but is useful in examining the benefit of a very stiffsoil.
Tests with no pipe embedded in the sand were run for each density condition to compa re load attenuation wi th elastic theories.
TABLE 3.1 PHYSICAL PROPERTIES OF SAMPLES USED IN TEST PROGRAM
-Sample A-1 J-2 J-3
Pipe Material PE PVC PVC
Applicable ASTM
Specification F405 D3034
03034
Diameter (in.)
ASTM 6.0 !3%(inner) 6 .275~ .0110 (outer) 6.275~.011 (outer)
Mi n. measured
5.98
6.2706.248
Max.
measured6.01
6.286
6.302
Wall Thickness (in.)
ASTM (min.) NR .180
.180
Min. measured .188 .186
Pipe Stiffness (psi)
ASTM (5% Deflection) 30(min) 46(min) 46(min)
Before Test 40
68
69After Test 45
74
NTASTM (lOOk Deflection) 25(min) NR NR
Before Test After Test Pipe Flattening ASTM 33 35
NR
No Visible Defect@60% Deflection Before Test After Test NR =No Requirement None None None NTAt the start of the tests with pipe, 6 inches of bedding sand was placed in the test tank and compacted to the dense condition. This sand was left in place through-out the test program so that all pipes would have the same support. The bedding sand was grooved and the sample pipes installed, such that the sand supported the
lower 90° arc of the pipe. After the pipe was installed the remaining instrumen-tation and sand were placed as described.
To determine the effect of departing from the 90° bedding condition, one test was performed with IIflatll
bedding. This test was made with 12 inches of cover in loose sand.
In the loose sand tests, the load was applied in 1000 pound increments, and mea-surements were taken after each increment was appl ied. The load was increased until bearing failure occurred in the sand. When bearing failure did occur, the load was removed, and the system was allowed to rebound for one-half hour, after which a final reading of all instruments was made. In the dense sand tests, the load was applied in 2000 pound increments, until either bearing failure, or the maximum intended load of 10,000 pounds was reached. At this point the load was removed, and the system was allowed to rebound for one half hour, after which the full load was reapplied in a single increment. Measurements were taken, the load was removed and the system was again allowed to rebound for one-half hour, after which a final reading of all instrumentation was made. In
all but t'NO instances all the sand (except that for bedding) was removed after each test. Since the pipe deflections measured during the tests with 18 inches of dense sand were sl ight (<U.5%), the top 6 inches of sand was removed and the
tests with 12 inches were performed.
3 .4 Test Resul ts
Table 3.2 presents c summary of the key parameters of all tests, including sand densities, moisture contents and the maximum load. Bearing failure occurred at
a load ofabout 5000 pounds in the loose tests end at 8000 pounds in one dense test (Run 6). Bearing failure did not occur in any other tests with dense sand.
3.4.1 Loads
Load attenuation with depth, as determined from the load tests on sand without an embedded pipe are presented in Figure 3.3. The loose and dense conditions pro-duced the same soil stresses until the loose sand began bearing failure at a load ofabout 3000 pounds. The load at which this occurred varied from test to test, depending upon the actual sand density. The sharp increase in the stresses at the
poin-tof failure is primarily due to the large displacements in the bearing plate necessary to increase the load, that is, the distance between the stress gage and load plate is decreasing considerably with each load increment.
TABLE 3.2 SUMMARY OF TEST CONDITIONS
Test # Plastic Sample # Depth Dry Density %Moisture Max. Load
1 PVC J-3 611 L-10l pcf
4.5
4,000 Ib 2 None None L-101 3.2 4,700 3 PVC J-3 611 D-111 5.0 10,000 4 None None D-1104.3
10,000 5 PE A-l 611 L-l004.3
5,000
6
PE
A-l 611 D-l114.2
8,000 7 PVC J-2 1811 0-1084.2
10,000 8 PVC J-2 1211 D-108 4.2 10,000 9 PVC J-2 1811 L-1024.6
5,000
10 PVC J-2 1211L-l05
4.15,000
11* PVC J-2 1211 L-102 5.14,000
12 PE A-1 1811 D-1084.3
10,000
13
PE A-I 1211 D-1084.3
10,000 14PE
A-l 1811 L-l004.7
3,000
15 PE A-l 1211L-98
4025,000
~
~
/
0
/
Oense $Qna~
/
---
£"oose Sana/
---
AVl!N"of/e t=t-wssure ",.,t:/et-eI
L-QQUt=YQ". (~/PtAreQ)
0
)I(Seo,..,n9
(:Qfl"r.~
/
•
610."'-c
rll.OI"YI.Inlt!"Q,.m/
C elf:lBt,-c(:)fV6s"..-erh,e;ry ConiCQI0
I
,q..~_"t-.
~
f
~I
Q.I
•
0
~
I
/
~
~
I
~I
0 ~/\
~~
c
QI
"
I
~
I
JJ2
~ 18 HC"...r-pl]
eooo
4((/fJ()6IJoo
8fKXJ
AppllllO''-OQa-IHI
The predicted stresses from elastic theory (Reference 14) for a uniform pressure over a circular area, and for a conical pressure distribution over a circular area are also presented in Figure 3.38 The elastic predictions underestimate the mea-sured stresses in all cases, but the error decreases wi th increasing depth of cover.
The predictionsof the conical distribution are more accurate for 6 and 12 inches of cover while at 18 inches of cover the uniform distribution prediction is in closer agreement with the measured stresses.
The results from the stress gages, when used to measure interface radial pressures, were frequently inconsistent with other data taken, such thatthe results are
sub-iect to question. The inconsistency of this data could be attributed to placement techniques, the fact that the gage is a rigid inclusion in the sand and may be
effecting the stress pattern locally or, in the case of the PE pipe, the effect of
the corrugated surface. Despite the inconsistencies in this dataI twoobservations can be made:
1. As shown in Figure 3.4 the pipes embedded in loose sand carried a significantly larger load than those in dense sand. This would be expected since the flexibility coefficient for the dense sand
systems was much higher than that for the loose sand systems.
2. The radial pressures were always highest at the crown, lesser at the springl ines and least at the invert. Figure 3.5 shows the
30
/8/1
C"ve,-,.
Oenee Sand12"Cover
Oenee
50nc/ ~--leIiCovert-ooee Sand~----18"Covert..OOf!tte Sand
eooo
."00f:) 6000 S()()() /~~pltsd 1..000'.
165-f=i9.
3.
'!
C/"'Own50i
I
5fres5ee ,=-orpe PIpe
10
o
Crowl?5p
r1f79
1,n.e---,
(n.,e"~-eooo
~()(X)6000
0
4000
AppftfJd
t.Ot:JtI-
(beinch cover-dense sand test.
3.4.2 Deflections
Vertical deflections were almost always greater than horizontal for both PE and
PVC pipes, however the difference was much more pronounced for the PE pipes where the vertical deflections were approximately twice the horizontal. Both vertical and horizontal deflections displayed the same trends and therefore, for simplicity, only data on vertical deflections will be presented.
The effect of bearing failure in the sandon pipe deflection is shown in Figure 3.6
for the PE - 6inch cover-dense sand test. After fail ureI load is transferred onto the pipe resulting in excessive deflections. Since pipe behavior after sand failure is outside'the scope of this study further references to deflections will neglect such effects where possible.
Figures 3.7 and 3.8 show the deflection profile along the length of the PVC and PE pipes at maximum load. In all tests, deflections were small at the cross-section 12 inches from the pipe centerl ine. For PE pipe in loose sand the deflections appear to concentrate more at the pipe centerl ine and die out quickly, producing a IIkinkll
in the deflection profile, while in all other instances the deflections die out at a more uniform rate. In both six inch cover tests for PE and the dense sand-six inch cover test for PVC, the soil strain gages located over the crown at
~
~
k~
~
~
~
<t
2yn7/'v":1 9N/d:ft?:gg~
~
"
8
~
~ ~~
fa
~
~
[
ClI
~
~ C) C>~
"
Q:
8
'-J
~
~Q
~ ~ ~~
~
(J Q.: ha'{
~
~
~
ltJ
\Q C> ~ ~co
1-NO /.J.:; .=77:1:;;;0 7'c?':J/..I.ClaA%
~
~
l{
41LOOSlZ 501/ DtZn6/Z 5011
---18"Covar 1~/Covar G'lCO\.4Zr ----..,,~_ __'Notrz: C'-'rvtZ6 -fOr lootsc2' 5011
OI'?Z ,-e,,- /OQa'e ~ ~ /b.e.
CUA<2fS 1'2;v-dt2nStZ SOIl onz~
loade ~ 10;000
/tJS-
---
-
0-6----~---~---~
~ Gil /~/IOI=7bnca Prom PIPZ CQI,,1tzr(lntZ - /nchee
- - - - I..t::JJ::18:I SoIl
- - /JzI?etz SoIl
Waltz : Cu;-vcr.s ~ 100'" satl
QI"fZ ~ IG'lG7O'S
==
fJOOOIbe.e
I./l'Ve5 7&-- ~ SJt:JIIt:lI-Iefa-loads
~ IC>-,OOOI"•.
~
/ ~"
'2 ~~~
~li
(j i:: 4~
I,
~ 5 ~*
r.Ir'5""
~.7 Dzflecflol?Profi/tr
AIQ"9
PVC
'olptZo
ISIICover~_
....
<&
_---~---_
t;.;f...
I?"~
OI:J1t7~ "I'CI??
Ptptl
C.,,7tzrl/~-Int::hce
a distance 6 inches from the centerl ine of the pipe showed positive strains (i .e. tension). This indicates that the pipe at this location has no externally applied load, but is deflecting due to the load at the pipe centerl ine. This effect was not seen in pipes with greater cover, indicating a more distributed load pattern.
Pipe deflection versus appl ied load are shown for all cases in Figures 3.9 and 3e10. The PVC and PE pipe deflections are similar for tests with 6 inches of
cover but for the tests with 12and 18 inches of cover the PE pipes deflected more than the PVC. Higer deflections would be expected in the PE pipe since its ring stiffness is about 60% that of the PVC (See Table 3. 1). The deflections with 6 inches of cover were similar, probably due to the closeness of the pipe to the loed plate, such that local effects controlled the pipe behavior.
In the tests in dense sand, after the maximum load was reached it was removed and then applied again in a single increment. In all except one case the deflec-tions ~ncreasedfurther upon second appl ication of the load. The increases ranged from 4 to 25 percent of the deflection due to the first cycle. In the PVC-6 inch cover-dense sand test the deflection decreased 2 percent on the second application.
3.4.3 PVC Strains
Figure 3.11 shows the crown strains due to ring deformations as recorded for test numbers 7 and 8. Axial and bending strains, also sho\vn, 'Here calculated
/0000 -.Dense So.nJ ):( Bee::t,..i'lj FQilure
*
rest .Il?teYr~ft~d / /I
/ //
I
6I'Cover ---..~zooo
4{)OO 6000 8000Ali/it;
cI
Load - Pounds
F"'ju.re
3.9
PVC -
Vcr-fica.1Def/ection
Vs.
Load
\.:' 0
S
-i::. \..J ~ ~ '( VCJ
...3
~ u ~,
l
0) ~r
I
0
0 ~5
- - - LooseS~nJ 0 6 "Cove,.. ... - Dense Sanof i--.... u'I
):( Bea",.;,,! rt'Aill.fre QJ 12./I Co.,e.,.
'"'
~ \J 3 ~ /8" Cover"
'32-v ~ ~
~
I ~ 0 0 ~OOO J/OOO I' ' 6000 8000 /0000AfP
lied.
L
o(A"d - POlAnds~ t)
f\t-w---..---r
'"
~ v aZ~
V) u ~ u .~ 0 .... .;.-. ... - - - - . . . - - - - -...----.ilIlp---~+ ~ 0 ... ~ ~-t
, V) Q Q ~ tTe
5t
/It7 - /8 /' C
ot'e.rres
t
~8
-/~"Caver
~ ~ ~ \:) ~ \) () 0 ~ '=> ~ c ~ \0 <Xl <:)
"
<:) ~ ~ ~ <0'<)'"
A{J{Jlier:J.
1..
OD.d.s -
Po
iAl7cis
assuming a linear strain variation across the cross-section. When the load was removed, the axial strains were released, yet most of the bending strains remained. This suggests that bending stresses may accumulate if the pipe is subjected to re-petitive loads. This
will be
discussed further in Chapter4.
Figure 3.12 compares bendingand axial strains at the crown, invert and springl ine for the 12 inch cover-dense sand case. For conversion to stresses the ring formula:
F/fj - EI
V - O.149R3
is used in coniunction with the parallel plate test results (Table 3.1) to calculate E. For these PVC samples E~ 510,000 psi. Bending stresses are greatestat the crown whereas axial thrusts are largest at the springline. The invert is in almost pure compression. These trends were observed in all other cases except the 18
inch cover-dense sand test, where the springl ine bending stress was greater than that at the crown. This is due to the increased depth of cover and more uniform loading on the pipe.
Figure 3.13 shows the change in crown bending stress for each load condition. The influence of sand stiffness is shown very clearly here. The 18 inch cover-loose sand pipe was subiected to about half the load as that of the 12 inch cover-dense sand case; however, the former still developed considerably larger strains.
-1000
t='vc
tellCover
o.n6t:Bond
_ ... e,'·"w/"/
.. - - - SI'~".intJ"i?tI - - - - In\'fI,.,,<o
~()(J() IfII)IOfJIJD 01(}()fXJ 0
Applle:l
"'ood..
,btl
(00200
200
- - - ("oose
Sand
/':f.
Otmse
SQnd
1\ )(
Searirl9rai/l./re
/ IBI/CoverI
/
/
I
/
/
/
/
/
/
" , /
/
" , // . £
1...---8
~
o
f(J()()IfJfJIJ
JtXXJ
«IIJD- . . . . ,..,
/JfIJIJO ftIOr) 1(JfJOOAp(illiJIJd
I.QfItf/-
/lJe
179-
g.13
VoriOttOn ,,,
o.wn
" , i " "
5ffWi,,-,
wit'''
18" Cover
- - - - -~c=roNSQneI
--a.".
Sand
I
·1
I
I
QI
1=19 ,,, 14
Vcr~on,n
f¥wY~.71It-u.• .,.
~.again shows the change in sand stiffness to be far more significant than the change in load.
3.4.4 Effect of Flat Bedding
Figures 3015 and 3.16 show the effectofflat bedding on deflections and strain levels. Pipe deflection increased slightly over that for 900 bedding, however
the maior change was at the invert where the bending strains increased about 400%. Crown strains did not increase significantly and remain the largest strains0
3.4.5 Load Plate Settlements
In the dense sand tests, the load plate settlements required to develop the 10,000 pound load averaged 0.25 inches. In the loose sand tests average plate ments of 0.75 inches were necessary to develop a 5000 pound load. These settle-ments probably had an effect on the pipe performance, as will be discussed in Chapter 4.
3.406 Effectof Tank Size on Pipe Performance
During test numbers 11 through 15 a stress gage was placed at the level of the spri~gline, near the edge of the tank. A pair of soil strain coils were also
placed at the springline level, halfway between the pipe and tank walls. The purpose of these gages was to observe any lateral effects produced by the tank
o
Flof8H(/I"9
/ .
3 0 0 0 . . . - - - .
2000
fOOO
- - - CrownWS!d:llng
-- -- - - Invet+
90°
&ddlng
-
- -
Crown Floi'S«IdI'ng
.
----Inv~r"lRoI-8ttdding
Appfted
'-oDd·
/68.
I'lq.
3.18
CQtnpQr,·son
0'
Fbi
Qnd.o-
8«b'Ing
which would infl'-'ence the pipe performance. In the dense sand tests the stress gage showed pressuresof about 10 to 12 psi, while the strain gages showed
neglible strains. This seems to indicate that lateral pressures are transmitted to some extent to the sidewall of the tank. Some of these pressures would be
present in an unconfined test and some were due to the constraintof the tank but the fvIo cannot be separated. In the loose sand tests the stress gage indicated pressures about 6psi and the strain gage indicated higher strains. This indicates that in the loose sand less of the pipe effects are transmitted to the tanke Side-wall friction was not considered to be a factor in these tests due to the nature of the load applied.
CHAPTER 4
DISCUSSION
4.1 Criteria for Establishing a Minimum Depth of Cover
Criteria for acceptable pipe performance under the load and burial conditions considered here fall into 2 basic catagories:
1 • Deflections: In flexible pipe design, deflections of up to 5% are typically considered acceptable. This rule was developed from experience with metal culverts, which normally fail at deflec-tions of about 20%, on the theory that a limit of 5% provides a safety factor against failure of about 48 This 5% limit is also normally used as a limit on plastic pipe deflections. This limit is applicable to deeply buried pipes, which are subiected to a single static loading cycle, through the addition of backfill. When designing for wheel loads however the designer must con-sider the effects of multiple loadings, with the pipe deflecting and rebounding during each cycle. Loudon (15) conducted a study in which a 47,000 pound gravel truck (33,000 pounds on the tandem rear axles)I was repeatedly driven over 4 inch dia-meter plastic tubing with 12 inches of cover. The tubing was
embedded in gravel up to 2 inches over the crown, ove:r which 10 inches ofa clay loam soil was added. He reported deflections less then 0.5% on the fi rst pass, but that clefl ections increased through each of 14 load cycles to almost 5%. The depth which the gravel truck sank into the soil was not reported, but may have infl uenced the resul ts • The test resul ts reported in Chapter 3
01so indicate that deflections increase upon repetitivf~loadin9.
These cumulative effects cannotbe reproduced in an elastic theory, such as Burns and Richard, because they are due to the inelastic behavior of soil. If a design method is to be basedon elastic theory therefore, it can only analyze a single! load cycle, and should use a limiting deflection of less than 5%. Also to be
considered when designing for wheel loads during construction is the addition of more backfill after the wheel loadiing, which will cause additional deformations. In view of these i~acts, the Iimiting deflection used in further discussion will be 2.5%0 This limit allows for the cccurrence of several load cycles, and additional long term deflections. (This is not intended {"O
repre-sent an allowable deflection in installations subiect to a large number of load cycles.)
pressure pipe, which is sublected primarily to tensile forces, very Iittle is known about the long term behavior ofnon-pressure pipe, which resists loads primarily in flexure and compression. This lack of information makes it necessary to be conservative in choosing an allowable stress. The considerat:ons iust dis-cussed with respect to deflection Ii mi tations al so apply here and provide further cause to be conservative in selecting a design slTess. Further discussion will neglect the fact that the flexural strengthsof PVC and PE are known to be greater than the tensils strengths,as stated in Chapter 2. An allowable stress due to a single cycle of wheel loading will be considered to be 1/3 of the tensile yiel d strength, or 2200 psi for PVC and 1000 psi for PEe This allows a margin of 3 for uncertainty ofthe behavior of plastics under flexural and compressive stresses, the effects of several load cycles, and long term effects after the installation is complete. This is a larger margin than used for deflections due to the greater uncertainty.
A third factor which influences the concentrated load-shallow buried problem, but for which no criteria will be establ ished, since it relates to sand behavior,
is bearing capacity. Sand density was varied in this study primarily to examine the effects of soil stiffness, as it provides lateral support to an embedded pipe.
Density also has a significant effect on the bearing capacity of sand, and in this respect also has a tremendous influence on the shallow burial problem. In all of the loose sand tests and even in one dense sand test, bearing failure occurred before reaching the intended load of 10,000 pounds. When this occurs, the load plate undergoes large deflections into the sand with additional load being trans-ferred onto the pipe. Figure 3.6shows the effect of bearing failure on pipe performance0 Large plate deflections can also occur before the soil actually
fails. As was noted in Section 3.4.5, to develop a 5,000 pound load in loose sand required 3 times the plate movement that was necessary to develop a 10,000 pound load in dense sand. Considering the attenuation of a concentrated load with increasing depth, these large deflections undoubtedly caused an increased loadon the pipe. Discussion of recommendations for minimum soil cover, will
assume the following:
1e The soil has the bearing capacity to support the design load.
2. The stated depths ofcover \vill refer to the distance from the crown of the pipe to the bottom of the impression left by the tire.
The load condition which will be discussed is the same as that used in the test program, ioe. a 10,000 pound load on a single tire.
4.2 Allowable Minimum Cover
In order to discuss the subiect of minimum cover in as general a sense as possible, and since sand behavior is primarily controlled by stiffness, the two density con-ditions will now be referred to by their one-dimensional modulus, rather than as loose and dense. In this way the test results can be applied to any soils (under the conditions discussed in Section 4.1) with similar stress-strain characteristics. As discussed in Chapter 2, the soil modulus which best describes sand behavior under concentrated loads is at or near the minimum possible value. Computing the minimum modulus from the curves for 110 pcf and 102 pcf sand in Figure B2 yields:
Ms-Loose
=
2000 psiM D
=
9000 psi 5- enseThese values will be used to describe the soil stiffness in the tollowing discussion.
Table 4.1 presents the maximum deflections, axial stresses and bending stresses recorded for all of the 9000 psi sand tests and the extrapolated deflections (Figure 4. 1) and stresses for all of the 2000 psi sand tests, assuming that no bearing failure had occurred prior to reaching the 10,000 pound load. From these resul ts the followi ng observations can be made:
/2
PVC
PIPE--- Pc
PIPE/
- - - CXTl:/?APOL.-ATION5 )( BeARI,V(3 FAIL-URI: 10 / //
/8
//
/ //
~ ~
/ /i:
/
~
GI ' Cover~
/~4
/ / /X
1i
/~
.QP
" ,i::
/~
~
/ "---:S2.
~ ~---/8"
Cover
0
0
t2000
«JOt)GOOO
~ooo 10,000App/
ied
L,oad -
L,bs.TABLE 4& 1 DEFLECTIONS AND STRESSES AT 10,000 POUND LOAD
I
Depth of Measurement PVC
PE
Cover
Ms
=
M -s - Ms=
Ms=
2000psi 9000 psi 2000 psi 9000pSIDeflection 0/0 12
5.25
12.5
4.75
6 inches Axial Stress psi
-
-
-
-Bending Stress psi
-
-
-
-Deflection %
3.5
0.5
8.00.75
12 inches Axial Stress psi 490
235
-
-Bending Stress psi
3480
280-
-Deflection % 1.2
0.25
2.5
0.55
18 inches Axial Stress psi
280
175-
-2. 12 Inch Cover: In 9000 psi sand both the PE and PVC pipes per-formed satisfactorily. In 2000 psi sand, the PE pipe deflected well over the specified Iimit while the PVC pipe deflectedaniy 51ightly too much but was 80% overstressed.
3. 18 Inch Cover: With 18 inches of cover over the crown all pipes performed satisfactorily. Deflection in the PE pipe in 2000 psi sand was marginal but did meet the limits.
To make recommendations concerning ailowable minimum cover from these resul ts requires consideration of several factors which were not studied here, such as the potential variations in construction practices, embedment material quality, and the dynamic effects of a tire actually rolling over a pipe installaf·ion. One must also consider what happens to the pipe after a wheel loading during con-struction. For example, the test with a flat bedding condition showedonly slight
increases in deflectionand peak stresses over the comparable test with 90° bed-ding, however, a 400% increase in bending stresses was observed at the invert. If more backfill were added, the increased stresses at the invert could become
a governing factor in the design.
Different pipe diameters also have an effect on the response. While the
control-ling factors in pipe response are load attenuation, and soil stiffness, larger pipes will be subjected to the concentrated effects of a wheel load at greater depths
than will smaller pipes, and an allowance should be made for this. Consideration of all these points leads to the following recommendatic.ns:
1. 9000 psi sand: Ifa sand stiffness of 9000 psi can be achieved then 12 to 18 inches (depending on field control) of cover will provide adequate protection for pipes having ring stiffnesses in the range of the PEand PVC tested here.
2. 2000 psi sand: In 2000 psi sand, the variation in ring stiffness between PE and PVC has a greater effect. In the case of PVC,
18 inches of cover is adequate if good control is exercised over the installation. If the quality control is questionable, then this cover should be increased, and although no tests were performed wi th over 18 inches of cover, 24 inches shoul d be adequate. For PE pipeI since the 18 inch test was marginal, 24 to 30 inches
of cover should probably be required, although no tests were con-ducted at these depths of cover to confirm this.
These recommendations should be increased 51ightlyfor larger diameter pipes, but since only one diameter was considered here, specific recommendations cannot
4.3 Design for the Concentrated Load-Shallow Burial Situation
An elastic analysisof the test pipes was made to see if the Burnsand Richard theory could be used to predict pipe behavior sufficiently accurate for design purposes. Utilizing the ideas put forth in Chapter 2, the load used in the analy-sis was the vertical soil stress at the springline (Figure 4.2) as measured in the
no-pipe 9000 psi sand tests. The soil modulus was calculated from Figure B2 using the vertical soil stress at the depth of the springline, but 2pipe diameters later-ally away from the load axis as shown in Figure 4.2. This stress more accurately
reflects the state of the
soil
which resists pipe movement, than do thfe soil stresses near the pipe. Table4.2
compares the Burns and Richard predictions of deflec-tions, axial stress and bending stress with those measured in the burial tests. The following observations can be made:1• Deflections: The deflection predictions underestimate those measured inall of the 6 inch cover tests, but improve with depth. For the 12 inch cover-9000 psi sand case and
all
the 18 inch cover cases the predictions are sufficiently close for design pur-poses.2. Thrusts: The Burns and Richard thrust predictions are always within 30%of those measured in the burial tests. The
predic-tions are always high in the 9000 psi sand and always lowin
20 ApPI-/EO SURFAce LOAD
S"'If~SS DISrlelBUTION AI 5p;e/~'-INe OUE
ro
5URFACe LQ4D
EAABEOOED PIPe
@srH.e'5S FOR Use IN 8uteNS AND RICHAICO ANA/..YSIS
TABLE 4.2 COMPARISON OF TEST RESULTS WITH BURNS AND RICHARD THEORY
00-01
PVC PE
Load Maximum
Bending Axial Bending
Condition Load Method Deflection Axial Stress Deflection
Pounds Stress Stress Stress
0/0 psi psi 0/0 psi psi
611
Burial Test
5.5*
-
-
5.1-
--0 Cover
5000
Burns & Richard 1.8555
820
2.6
880 490c Test/Theory 3.1
2
etO
Sl-
-
-
-.-
1211 Burial Test 1.75 245 17404.0
-
-enD-Cover
5000
Burns & Richard0.7
190 320 1.0 310 1900
0 Test/Theory
2.5
1.35.4
4.0
-
-0
N 1811
Burial Test
0.6
140 5301.0*
-
-Cover 5000 Burns &Richard
0.5
110 220 0.7 190 130Test/Theory 1.2 1.3
2.4
1.4
-
-611 Burial Test
5.25
-
-
4.25*
-
--0 Cover 10000 Burns & Richard 1.0
970
3901.6
850 250c
Test/Theory
5.3
2.7
0
-
-
-
-en
11- 1211 Burial Test
0.5
235
2800.75
-
-a.
Cover10000
Burns &Richard 04t4 340150
0.6 320 1008
Test/Theory1.25
0.7
1.9
1.2-
-~ 1811
Burial Test 0.25 175 200
0
055
-
-Cover 10000 Burns & Richard
0.24
200
1000.4
200 65Test/Theory
1.0
0.9
2.0 1• 1-
-*Soil failed before reaching indicated load. Values have been extrapolated to account for this.
Note: Variations in stress and deflections are approximately linear. To compare 2000 psi sand
much stiffer, is able to arch more load around the pipe than is the 2000 psi sand.
3. Bending Stresses: All of the Burns and Richard predictions of bending stresses underestimate those measured considerably. This is because the peak bending occurs as a local effect at ~he crown, rather than as a general ring bending, as predicted by Burns and Richard. In the 2000 psi sand the ratio of measured bending ;)tresses to those predicted by Burns and Richard, decreases from 5.,4 to 2.4 as the depth of cover increases from 12 to 18 inches. In the 9000 psi sand the ratio is approximately 2 in both cases. If a larger data set were available, these ratios caul d be establ ished for varying depths of cover, pipe diameter, and soil conditions providing a modification factor to be applied
to the Burns and Richard solution.
In general it can be seen that the Burns and Richard analysis gives better predic-tions for the tests in 9000 psi sand than it does for those in 2000 psi sand. This is because the 9000 psi sand, being more highly compacted and therefore stiffer, is subject to fewer
non-I
inearities and local effects. The 2000 psi sand undergoes a great deal of compaction during testing, and it is sometimes difficult to distin-guish exactly where bearing failure begins to influence the tests.CHAPTER 5
CONCLUSIONS
5.1 Minimum Cover
Burial tests have been conducted to observe the structural behavior of PVC sewer pipe end corrugated PE underdrain pipe under concentrated loads. Based on the results of these tests, recommendations have been made for allowable minimum cover:
1. PVC SeVIer Pipe: PVC pipe performs satisfactorily according to the criteria set forth in Section 4.1 under a 10,000 pound single wheel loading, \vhen covered with 12 to 18 inches of sand with a modulus of 9000 psi or with 18 inches of sand withe modulus of 2000 psi and good field control. If the field control is limited than this limit for 2000 psi sand should be increased. Although no tests were run with more than 18 inches of cover it is expected that 24 inches should be adequate.
2. Corrugated PE Underdrain Pipe: Corrugated PE pipe deflects within acceptable Iimits when covered with 12 to 18 inches of 9000 psi sand or
01
though tests were not performed at thesedepths, would be expected to perform acceptably if covered with 24 to 30 inches of 2000 psi sand.
Application of these results should consider possible variations in construction and loading, as well as the influence ofsoil conditions. Design for such situations should allow for both the soil stiffness and the expected depth of the impression left in the soil by the wheel ofa vehicle. The cumulative effect of multiple loadings should also be considered. The suggested depths should be increased for larger diameter pipe, but since onlyone diameter pipe was used, no recommen-dation can be made.
The recommendations can be extended to soils other than sand if the stress-strain characteristics are similar, SJch as a dry or overconsolidated clay. The consolida-tion effects in a soft clay vvould have a significant effect in the test results, but a soft clay is a poor backfill material and should not be used under the loads discussed here.
5.2 Design Method
The Burns and Richard elasticity theory has been evaluated for its ability to pre-dict pipe performance under concentrated wheel loads. For the data gathered in this test program, the theory always gave predictions for axial thrust within