Motion and the Sound Field Near the Tympanic Membrane
The MIT Faculty has made this article openly available.
Please share
how this access benefits you. Your story matters.
Citation
Cheng, Jeffrey Tao et al. “The Effect of Ear Canal Orientation
on Tympanic Membrane Motion and the Sound Field Near the
Tympanic Membrane.” Journal of the Association for Research in
Otolaryngology 16.4 (2015): 413–432.
As Published
http://dx.doi.org/10.1007/s10162-015-0516-x
Publisher
Springer US
Version
Author's final manuscript
Citable link
http://hdl.handle.net/1721.1/104902
Terms of Use
Article is made available in accordance with the publisher's
policy and may be subject to US copyright law. Please refer to the
publisher's site for terms of use.
Research Article
The Effect of Ear Canal Orientation on Tympanic Membrane
Motion and the Sound Field Near the Tympanic Membrane
J
EFFREYT
AOC
HENG,
1M
ICHAELR
AVICZ,
1J
ÉRÉMIEG
UIGNARD,
1C
OSMEF
URLONG,
1,2 ANDJ
OHNJ. R
OSOWSKI1,31
Eaton-Peabody Laboratory, Department of Otology and Laryngology, Massachusetts Eye and Ear Infirmary, Harvard Medical School, 243 Charles Street, Boston, MA 02114, USA
2
Center for Holographic Studies and Laser Micro-mechaTronics, Department of Mechanical Engineering, Worcester Polytechnic Institute, 100 Institute Road, Worcester, MA 01609, USA
3
Speech and Hearing Bioscience and Technology Program, MIT-Harvard Division of Health Sciences and Technology, 77 Massachusetts Avenue, Cambridge, MA 02139, USA
Received: 30 July 2014; Accepted: 2 April 2015; Online publication: 25 April 2015
ABSTRACT
The contribution of human ear canal orientation to tympanic membrane (TM) surface motion and sound pressure distribution near the TM surface is investi-gated by using an artificial ear canal (aEC) similar in dimensions to the natural human ear canal. The aEC replaced the bony ear canal of cadaveric human temporal bones. The radial orientation of the aEC relative to the manubrium of the TM was varied. Tones of 0.2 to 18.4kHz delivered through the aECinduced surface motions of the TM that were quantified using stroboscopic holography; the distri-bution of sound in the plane of the tympanic ring PTR
was measured with a probe tube microphone. The results suggest that the ear canal orientation has no substantial effect on TM surface motions, but PTR at
frequencies above 10kHz is influenced by the ear canal orientation. The complex TM surface motion patterns observed at frequencies above a few kilohertz are not correlated with simpler variations in PTR
distribution at the same frequencies, suggesting that the complex sound-induced TM motions are more related to the TM mechanical properties, shape, and boundary conditions rather than to spatial variations in the acoustic stimulus.
Keywords: ear canal orientation, tympanic membrane motion, umbo displacement, sound pressure distribution, middle ear, stroboscopic holography
INTRODUCTION
The mammalian external and middle ears act togeth-er to couple entogeth-ergy from airborne sounds to the inntogeth-er ear, where mechano-neural transduction occurs. One of the centerpieces of this process is the conversion from sound pressure and volume velocity in the ear canal to the mechanical forces and motions of the ossicles, where this transformation is the result of the action of the tympanic membrane (TM). This paper uses measurements of sound pressure in an artificial ear canal and concurrent stroboscopic holographic measurements of the motion of the surface of the TM (e.g., Cheng et al. 2013) to investigate whether ear canal orientation affects TM motion and the sound field near the TM surface, and how well the sound pressure and TM displacement are spatially correlat-ed.
The average adult human ear canal is 2.5 cm long and 0.7 cm in diameter (Shaw1974). The lateral half of the ear canal is formed by cartilage while the medial half is bound by bone. At the medial end of the ear canal, the TM is positioned at an approxi-mately 45 ° angle to the canal’s long axis in the
Correspondence to: Jeffrey Tao Cheng & Eaton-Peabody Laboratory, Department of Otology and Laryngology, Massachusetts Eye and Ear Infirmary&Harvard Medical School&243 Charles Street, Boston, MA 02114, USA. email: Tao_Cheng@meei.harvard.edu
DOI: 10.1007/s10162-015-0516-x
D 2015 Association for Research in Otolaryngology
413
horizontal plane (DiMaio and Tonndorf1978; Stinson
1985; Ravicz et al.2014; see Fig. 1AinBMETHODS^),
where the projection of the long axis of the ear canal on the TM makes an angle of about 60 ° with the manubrium in a parasagittal plane (e.g., Ravicz et al.
2014; see Fig. 1B in BMETHODS^). Whether the
canal’s structure and its orientation affect the trans-formation of sound pressure to TM motion is unclear, though some models of this transformation suggest that the orientation of the ear canal contributes to the generation of TM surface waves that travel from the TM’s rim toward its center (Parent and Allen 2007,
2010).
In our previous holographic measurements, the cartilaginous and bony ear canal of the human temporal bone was removed in order to view the complete surface of the TM. Furthermore, we used a semi-open sound source that generated wave fronts roughly parallel to the tympanic ring plane. Under these conditions, the distribution of sound pressure along a TM diameter was found to be generally uniform with only small variations (±3 dB) at frequen-cies as high as 20 kHz. While we did observe motions on the TM surface consistent with small traveling-wave-like disturbances with this stimulus arrangement, generally, our measurements describe larger standing displacement waves on the TM surface that are more consistent with the excitation of stationary modal motion patterns, e.g., Tonndorf and Khanna (1970).
The present study investigates: (i) whether sound stimuli that travel down the ear canal produce significant non-uniformities in the sound field near the TM surface, particularly at frequencies above 10 kHz where the wavelength of the sound ap-proaches the dimension of the TM; (ii) how such spatial variations in the ear canal sound pressure near the TM are affected by changes of the ear canal orientation relative to the TM; and (iii) whether such canal-dependent variations in sound pressure pro-duce similar dependencies in the displacement of the TM surface.
To test these ideas, we developed an artificial ear canal (aEC) with similar dimensions to the real human ear canal. The aEC is coupled to the TM surface at an angle to mimic the real human ear canal anatomy (Ravicz et al. 2014), such that sound waves propagating down the aEC are first incident on one edge of the TM and then propagate through the air to the opposite edge of the TM (Stinson 1985; Stinson and Khanna1989). The effects of aEC orientation on TM motion and sound field near the TM surface are studied by varying the radial orientation of the aEC relative to the TM. To maximize the sensitivity of our technique to variations in aEC orientation, we com-pare sound pressure near the TM or TM motion with the aEC in its normalBanatomical^ orientation and in
the opposite orientation. The results assess whether varying the orientation of the aEC to the TM leads to coupled alterations in TM surface motion and sound field near the TM.
METHODS
Human Temporal Bone Preparation and Setup
The preparation of human temporal bones (TB) has been described previously (Cheng et al. 2010). Five bones (TBs 1, 3, 4, 6, and 7) without history of otologic diseases were used in this study: TBs 1, 3, and 6 were from left ears and TBs 4 and 7 from right ears. The temporal bones were kept in saline solution after harvesting and were constantly moistened during the experiment. The cartilaginous and bony ear canals were removed to expose about 90 % of the TM surface. The middle-ear cavity was opened to access the facial recess, which enabled visual observation of the tympanic cavity to check for normality of the ossicles, tympanum, and the cochlear windows. The recess remained open during the experiment. A thin layer of ZnO suspended in saline (60 mg/cm3) was applied evenly to the TM lateral surface to increase its reflectivity for better holographic measurements. The thickness of the coating layer is about 2∼3 μm, which is small compared with the mean thickness of the human TM of 80 to 100 μm (Van der Jeught et al.2013), consistent with measurements that suggest the
HOLOGRAPHY LASER BEAM
ARTIFICIAL EAR CANAL (aEC)
PLANE OF TYMPANIC RING MEDIAL SUPERIOR PROBE TUBE MICROPHONE SOUND SOURCE 45˚ OPTICAL WINDOW (A) (B) MIDDLE EAR UMBO 2 mm VERTEX
EAR CANAL VERTEX
60˚
aEC
MANUBRIUM
FIG. 1. A Experiment setup. The aEC is terminated at 45 ° to its long axis and coupled to the annulus of the TM. The laser beam (blue) is incident on the TM via a glass optical window (orange) in the ear canal wall for holographic measurements of TM motion. A probe tube microphone positioned down the aEC long axis is used to measure the sound pressure distribution in the plane of the tympanic ring. The ear canal vertex is where the sharp tip of the diagonally cut ear canal comes into contact with the tympanic ring.B A cartoon shows the spacing and coverage of the sound pressure measure-ments in TB 3 (left ear) as an example. The aEC is coupled to the TM roughly along the anatomical ear canal orientation, with the ear canal long axis at an angle of about 60 ° with the manubrium in a parasagittal plane.
effect of the paint on TM function is small (Rosowski et al.2009; Cheng et al.2013).
The prepared temporal bone was held by a brass rod attached tightly to the petrous bone inferior to the TM surface, roughly perpendicular to the plane of the tympanic ring. The rod was held by a 3-axis manipulator (MM3301-L, World Precision Instru-ments, Germany), and the TM was positioned in front of the camera of the holographic system (Cheng et al.
2010) with the tympanic ring plane perpendicular to the holographic laser beam and parallel to the holographic camera plane (Fig.1A).
The Artificial Ear Canal
The aEC is described in detail in Ravicz et al. (2014). Briefly, the approximately 3 cm long ear canal was made of brass and had an oval cross-section with a major diameter of 1 cm. The end of the brass tube distal to the TM was perpendicular to the tube’s long axis, while the proximal end was at a 45 ° angle, forming a circular opening. A transparent anti-reflection-coated optical window (CVI Melles Griot, Rochester NY) replaced part of the brass tube wall to allow the holographic laser to illuminate the surface of the TM and the holographic camera to capture the vibration of the TM (Fig.1A). The window was 2 mm thick and reduced the cross-section area of the aEC by about 10 %. The aEC was positioned between the camera and the temporal bone, with the long axis at an angle of 45 ° to the laser beam, such that the proximal end of the aEC was parallel to the plane of the tympanic ring and the sharp tip of the diagonally cut ear canal came into contact with the tympanic ring to form the ear canal vertex (Fig.1A). The space between the aEC proximal end and the TM annulus at the coupling site was sealed by either vacuum grease or silicone impression material to reduce sound leakage.
Manipulations of aEC Radial Orientation
We varied the radial orientation of the aEC relative to the TM by rotating the temporal bone about an axis defined by the laser beam, perpendicular to the tympanic ring plane. In this manner, the TM annulus was maintained perpendicular to the laser beam to allow quantification of surface motion of the TM normal to the tympanic ring plane. As a consequence, the distance between specific locations on the TM surface and the sound source varied with different aEC orientations.
The angle between the projection of the long axis of the ear canal onto the TM and the long axis of the manubrium was used to describe the orientation of the aEC (Fig. 2). The varied orientations of the aEC
used in all five temporal bones in this study are shown in Figure2. Right ears are mirrored in this figure to match the left ears. An orientation of 0 ° (12 o’clock) was defined as aligned to the long axis of the manubrium.
The solid black arrow shows aEC orientations that are approximately aligned to the anatomical human ear canal orientation (60–75 ° posterior to a line through the manubrium, see Fig. 1B), while the red open arrows show the aEC orientation approximately opposite to the anatomical ear canal orientation (TBs 1, 3, 4, 6, 240–255 °; TB 7, 265 °, shown by a separate arrow for accuracy). We also used four additional orientations in TB 1 (the blue open arrows at 90, 180, 270, and 360 °), and one additional aEC orientation in TB 3 (brown arrow, ∼315 °). The small variations between similar orientations in different bones are due to variations in the bone anatomy, which influenced the exact orientations we could achieve. The aEC was resealed to the TM annulus after each change in orientation.
Acoustic Stimulation and Measurement
Sound Pressure Measurement in the Plane of the Tympanic Ring
Broadband chirps with frequency components be-tween 0.05 and 25 kHz were synthesized with custom experimental control software (High-frequency Mea-suring System, Eaton-Peabody Lab., Boston, MA) written in LabView and run on a PXI system (National Instruments, Austin, TX). The stimulus signals were amplified (D45, Crown, Elkhart IN) and delivered to the sound source (CF1, Tucker-Davis Technologies,
TB3: 315° TB1: 90° TBs 1,3,4,6,7: 60~75° TBs 1,3,4,6: 240~255° TB1: 270° TB1: 180° SUPERIOR ANTERIOR INFERIOR POSTERIOR TB1: 360° (Anatomical aEC Orientation)
(Opposite to Anatomical aEC)
(Left ear)
TB7: 265°
FIG. 2. A view of the TM showing the various orientations of the aEC long axis (indicated by arrows) relative to the manubrium (outlined by the dotted line, at 0 °). The solid black arrow represents the aEC orientation that approximates the anatomical ear canal orientation. Red arrows are approximately 180 ° from the anatomical orientation (opposite orientation); blue and brown arrows show other aEC orientations.
Alachua FL) to produce sound pressures near the TM between 80 and 120 dB SPL. Acoustic stimuli entered the aEC near the distal open end via a flexible tube coupled to a nipple in the aEC wall (see Fig.1A); the distal aEC remained open during measurements. The stimulus sound wave traveled down the aEC to induce vibrations of the TM.
A calibrated microphone (EK3027, Knowles, Itasca, IL) with a probe tube (0.8 mm outer diameter and 0.5 mm inner diameter, 45 mm long) was mounted on a 3-axis micro-manipulator to measure sound pres-sures approximately in the tympanic ring plane (PTR),
about 2–4 mm lateral to the umbo. The probe tube was sufficiently small that the sound field in the aEC was not affected (Ravicz et al.2014). The microphone probe was inserted via the distal aEC opening (Fig. 1A) and advanced down the aEC until the tip of the probe was approximately at the tympanic ring plane. The position of the probe tip was monitored via a surgical microscope focused down the aEC or through the transparent window on the aEC wall to avoid damaging the TM. With the micro-manipulator, the microphone probe was moved to various locations within the tympanic ring plane with a 1–2-mm spacing (with an accuracy of better than 200μm) that covered 50–80 % of the plane (as shown in Fig. 1B). The location of the probe tube tip at each measurement was documented by the holography camera through the aEC transparent window. Though we attempted to position the probe tube in the tympanic ring plane in each aEC orientation, irregularities in the temporal bone surface anatomy caused small variations (within ±2 mm) in the location of the PTRmeasurement plane
relative to the anatomical tympanic ring plane. At each sound pressure measurement location, the amplified microphone responses to a series of repeat-ed chirps were averagrepeat-ed via an A/D acquisition board (on the same PXI system that generated the stimulus signals, see above) and the averaged PTR magnitude
and phase (phase-locked to the stimulus) at each frequency were computed (Cheng et al. 2013). The measurements were repeated at various aEC orienta-tions for each bone. The location over the umbo within the tympanic ring plane was identified in each orientation, and multiple measurements were per-formed at this location and several other measure-ment locations to assess repeatability and check that the condition of the bone had not changed (e.g., due to drying or shifts in position). The sound pressure over the umbo was used to normalize the PTR
distribution during data reduction.
Our method of coupling the sound source to the distal end of the ear canal via a side-mounted tube introduces transverse non-uniformities in the sound field at the distal ear canal end. At low frequencies, these non-uniformities decay rapidly within a short
distance from the distal ear canal, but at frequencies above 10 kHz, these non-uniformities can extend some distance medially down the ear canal toward the TM in a frequency-dependent manner (Kinsler et al. 1982, pp. 216–218; Fletcher 1992, pp. 196–198;
Ravicz et al. 2014). In our aEC, non-uniform sound wave modes at frequencies of 18 kHz and above (based on aEC diameter of 1 cm) can propagate to the TM and introduce non-uniformities in the sound field near the TM surface that will complicate our analyses. Therefore, in this report, we exclude both sound pressure and TM motion results produced by stimuli of frequencies equal and above 18 kHz. Sound Pressure Monitoring During Holographic Measurements
To monitor the sound pressure applied to the TM during holographic measurements, the microphone probe tip was moved to the edge of the TM to avoid blocking the view of the TM surface seen by the holography camera. Continuous sinusoids at 18–21 selected frequencies between 0.25 and 18.4 kHz were generated by a stimulus generator (AFG 3102, Tektronix, Beaverton OR), amplified and coupled to the sound source to induce vibration of the TM as described above. The sound level was set at each frequency to produce resolvable holographic fringes on the TM surface. The microphone captured the time waveform of the sound pressure over 20 ms during each holographic measurement, and fast Fourier transforms defined the sound pressure at the stimulus frequency and assessed harmonic distortion. The fundamental sound pressure component at the stimulus frequency was at least 20 dB higher than the second harmonic.
Stroboscopic Holographic Measurements
The details of stroboscopic holographic measure-ments and computation of displacement magnitude and phase of the TM have been described previously (Cheng et al. 2010, 2013). A series of nine phase-locked stroboscopic holograms of the TM (at relative stimulus phases of 0,π/4, π/2, … 2π) were recorded at each of the selected stimulus frequencies in each of the varied aEC orientations to derive a displacement vs. time waveform at each point on the TM surface. The Fourier transforms of these waveforms defined the magnitude and phase of the TM displacement at over 200,000 points on the TM surface. Correlation analysis between the measured displacement wave-forms and the sinusoidal displacement reconstructed from the stimulus frequency transform values sug-gested low distortion in the displacements, with the correlation coefficients usually higher than 0.95
(Cheng et al. 2013). Unfortunately, because of a recently discovered bug in our controlling software, there is an uncertainty in the phase of the holograph-ically measured displacements relative to the phase of the stimulus waveform; therefore, we are unable to correct accurately the displacement phase by the sound pressure phase. This uncertainty does not affect the accuracy of our descriptions of spatial variations in the phase of the displacement or sound pressure that occur at any one stimulus frequency because they are normalized to the displacement or sound pressure at a single reference point over the umbo, and spatial variations in the relative phases of these quantities are accurately portrayed in subse-quent spatial maps.
Data Reduction and Analysis
Registration and Normalization of Sound Pressure Maps To help compare PTR distribution obtained from
different aEC orientations among different TBs, and correlate PTR maps with TM displacement maps, we
registered each of the PTR measurements to a
TM-based coordinate system, as shown in Figure 2, with right ear TMs mirrored to match left ears. All PTR
measurements were further normalized to the sound pressure over the umbo (as described above).
Registration of TM Motion Maps
Due to variations in the anatomy of the temporal bones, changing the aEC radial orientation also produces small changes in the relative position of the tympanic ring plane relative to the holography camera. These positional changes complicated the comparisons of TM surface motions quantified from different aEC orientations.
We registered the different measurements in a common coordinate system to facilitate point-by-point comparison of the TM motion maps from different aEC orientations (Guignard et al.2014). The registra-tion process assumed an idealized situaregistra-tion with a planar object relatively close to a pinhole camera. In this case, the geometrical transformations between the motion maps can be approximated by projective transformations (Haralick and Shapiro 1992).
In order to perform registration of TM motion maps, we first defined the contours of the TM borders and the manubrium, a process called segmentation. The TM borders were defined from the measure-ments at low frequencies (200 or 500 Hz), where the entire TM moved in-phase and its borders were clearly distinguishable from a sharp edge on the displace-ment phase map (see Cheng et al.2013, Figs.1and2, TM displacement phase maps at 200 Hz). The manubrium and the umbo were defined from a TM
displacement phase map at high frequencies (above 15 kHz), as the manubrium and the umbo move out of phase from the rest of the TM at these high frequencies (see Cheng et al.2013, Figs.1and2, TM displacement phase maps at 18 kHz). The segmenta-tion of the TM and manubrium was done with manually drawn outlines that were deformed to match the edge with an algorithm called Bactive contour^ (Chan and Vese 2001). Such contours were defined from the displacement measurements made in each aEC orientation.
The correction of the in-plane rotation of TM motion maps at different aEC orientations was done using a technique adapted from Wolberg and Zokai (2000) involving log-polar coordinates transformation of the motion maps. Subsequently, five landmarks were defined: the center of the umbo and the intersections of two perpendicular lines centered at the umbo (one line is along the center of the manubrium) with the boundary of the moving part of the TM as described above. The least squares solution of the projective transform that best warped landmarks from different aEC orientations to the landmarks of a reference orientation was calculated. The motion maps were registered with the resulting transforms (Guignard et al.2014).
Umbo Displacement Per Stimulus Sound Pressure
The ratio of the displacement of the TM at the umbo and the stimulus sound pressure has been widely used to describe sound reception at the entrance to the middle ear. In this study, we quantified the umbo displacement as the averaged motion of a 10×10 pixel area at the center of the umbo (defined from high-frequency motion measurements and live images of the intact non-stimulated TM, Cheng et al.2013) from TM motion maps measured by holography. A complication in our estimates is that the small motion of the umbo (relative to other TM regions) may fall below the measurable displacement resolution (10–30 nm) of our holographic system (Cheng et al.2013). To ensure that the umbo displacement magnitudes presented here are well above the holographic noise floor, we computed the standard deviation (SD) of the displacement in the 10×10 pixel area used to define the average, and only those results with a ratio of the SD to the average of less than 0.2 were used in this study.
In order to compare averaged umbo displacements from different specimens in this study and other published results, we assumed that the stimulus sound pressure was uniform over the entire TM surface (as we have previously demonstrated at frequencies of 10 kHz and below), and we computed the ratio of the umbo displacement and the sound pressure measured near the edge of the TM at each frequency of the holographic measurement and compared them with
previously published measurements. As we discussed earlier, the phase of the holography determined TM displacement was not well phase-locked to the stimu-lus signal, and it was impossible to calculate the phase between displacement and sound pressure. There-fore, we only compute the magnitude of umbo displacement normalized by sound pressure.
Normalization of TM Motion by Umbo Displacement Our measurements (see BRESULTS^ below) and
others (Stinson 1985; Ravicz et al.2014) have shown substantial sound pressure variations across the tym-panic ring plane at stimulus frequencies greater than 10 kHz. Therefore, normalization of the high-frequency TM motion over its entire surface by a single sound pressure value measured near the edge of the TM will introduce systematic inaccuracies in our estimates of the magnitude of TM surface motions produced by different aEC orientations at higher sound frequencies. Since we are interested primarily in how aEC orientation affects the spatial patterns of TM motion, we normalized the displace-ments measured at all points across the TM surface by the displacement at the umbo (computed as de-scribed above).
RESULTS
Sound Pressure in the Tympanic Ring Plane
Sound pressure maps in the tympanic ring plane PTRfor each aEC orientation were constructed at many frequencies from the broadband sound pressure spectra measured with the probe tube microphone (Ravicz et al.2014). As an example, PTRmaps in ear
TB 4 are shown at four selected frequencies in Figure3, with the aEC in theBanatomical orientation^ (Fig. 3A–D) and then in the Bopposite orientation^ (Fig.3E–H). Both sets of maps have been registered to the TM-based coordinate system and normalized by the sound pressure over the umbo (see ). In each orientation, the top panels show sound pressure magnitudes re umbo in decibels, and the bottom panels show sound pressure phases re umbo in cycles. The values are color coded as shown in the color bar to the right.
In both aEC orientations, below 10 kHz (Fig. 3A, B, E, F), normalized PTR magnitude (|PTR|) and
phase are approximately uniform at all measurement locations: the magnitude variations are less than 2 dB, and the phase over the entire TM surface is nearly constant.
At higher frequencies (e.g., 14 kHz) in both aEC orientations (Fig.3C, G), a gradient in |PTR| is clearly
visible: |PTR| increases by about 6–8 dB along a line
perpendicular to the isobars where |PTR| is constant,
while PTR phase is approximately uniform. The
direction perpendicular to the |PTR| isobars
approxi-mates the projection of the aEC long axis onto the tympanic ring plane. Such behavior is consistent with a pattern of standing waves in the ear canal sound pressure across the TM surface, with a sound pressure maximum located at the point in the ear canal that is farthest from the sound source (near the ear canal vertex, see the insets, also see Fig.1), and a minimum present at the opposite edge of the tympanic ring, the edge closest to the sound source (Stinson1985; Ravicz et al. 2007, 2014). Note that the |PTR| gradient in
Figure 3G (Bopposite orientation^) is in the opposite
direction to the |PTR| gradient in Figure 3C
(Banatomical orientation^), consistent with the two opposite aEC orientations. As frequency increases above 14 kHz (e.g., 16 kHz; Fig. 3D, H), the sound pressure gradient from the source edge of the tympanic ring (opposite to the ear canal vertex) increases to 12 to 15 dB in magnitude toward the vertex, and PTRphase near the source edge leads the
umbo and vertex by about 0.1 period. Again, the |PTR|
gradient in Figure 3H (Bopposite orientation^) is in
the opposite direction to the |PTR| gradient in
Figure 3D (Banatomical orientation^), consistent with
the gradient reversing with the change in orientation. Figure 4 shows PTR maps in TB 7, which exhibits
larger variations in PTRthan we saw in TB 4. At 5 kHz
(Fig.4A, E) in both aEC orientations, normalized PTR
magnitude and phase are approximately uniform at all measurement locations, but the variations in PTR
seen at 14 and 16 kHz in TB 4 occur at lower frequencies in TB 7. In the aEC anatomical orienta-tion, the |PTR| gradients in TB 7 at 10.7, 14.6, and
17.1 kHz are also along the aEC axis but are larger than in TB 4 at similar frequencies; PTR phase is
approximately uniform as in TB 4 except at 17.1 kHz, where there is a half-cycle phase step near the source edge of the tympanic ring plane. The phase step is associated with a |PTR| minimum at that location, and
the two patterns are consistent with a local standing-wave node, with the nodal line perpendicular to the aEC long axis. In the aEC opposite orientation, the |PTR| gradients along the aEC axis at 10.7 kHz
(Fig. 4F) and 14.6 kHz (Fig. 4G) are much steeper (15–25 dB) than in the anatomical orientation, with standing wave nodal lines approximately along the aEC long axis. At 17.1 kHz (Fig.4H), an obvious nodal line is present near the umbo with significant pressure maxima on either side of the line. Unlike the other nodal lines, the nodal isobar in Figure 4H is not perpendicular to the aEC long axis.
TBs 4 and 7 represent the extremes in PTR
variations among the temporal bones and orienta-tions used in this study. In TBs 3 and 4, the |PTR|
range is similar between the anatomical and oppo-site ear canal orientations, increases slowly with frequency to 6–15 dB at 16 kHz, and PTR phase
varies little. In TBs 6 and 7, the |PTR| range is
substantially larger in the aEC opposite orientation than in the anatomical orientation at frequencies above 10–12 kHz and generally exceeds 25 dB at frequencies above 15 kHz. Also, standing-wave nodes are apparent in the PTRmagnitude and phase maps
above 15–17 kHz in the aEC anatomical orientation and above 11–13 kHz in the opposite aEC orienta-tion. In the following sections, we explore whether these PTRvariations with temporal bone, orientation,
and frequency are associated with TM displacement variations.
Normalized Umbo Displacement Magnitude
Compared with Previous Studies
The transfer function between the displacement of the umbo and the sound pressure in the ear canal is commonly used as a simple descriptor of the function of the TM (e.g., Goode et al.1993; Gan et al. 2004; Nakajima et al.2009). We estimate the magnitude of this transfer function in all five temporal bones in this study made with the aEC in an anatomically normal position (Fig.5) from the holographic measurements of umbo displacement together with sound pressures measured at the rim of the TM. We do not calculate the phase between umbo displacement and sound pressure due to the phase uncertainty described earlier. We exclude displacement data at 18 kHz and above because of the possible effect of propagating
5 kHz 10 kHz 14 kHz 16 kHz
A
B
C
D
re over umbo re over umbo MAGNITUDE (dB) PHASE (ccyles) 10 –10 –5 0 5 0.5 –0.5 –0.25 0 0.25 TB4: aEC in “Anatomical Orientation”E
F
G
H
re over umbo re over umbo MAGNITUDE (dB) PHASE (ccyles) 10 –10 –5 0 5 0.5 –0.5 –0.25 0 0.25 TB4: aEC in “Opposite Orientation”Vertex aEC aEC Vertex TR plane TR plane TM aEC Vertex TM Vertex aEC
FIG. 3. Sound pressure maps in the tympanic ring plane in ear TB 4 at selected frequencies, normalized by sound pressure over the umbo.A–D aEC in anatomical orientation, approximately 60 ° to manubrium, see cartoon at top-left, also see Figure2. The vertex of the ear canal is located farthest from sound source, see a second cartoon at left, and also see Figure1. E–H aEC in opposite orientation, approximately 240 ° clockwise to manubrium, see
cartoons at left. A, E 5 kHz; B, F 10 kHz; C, G 14 kHz; D, H 16 kHz. Top, magnitude in decibels; bottom, phase in cycles; color-coded in the color bars on the right. Each colored square represents a measurement location, and the size of the square is approximately equal to the receptive field of the probe microphone. The gray background shows the approximate extent of the accessible tympan-ic ring plane. The manubrium is outlined in white.
non-uniform sound modes (see BMETHODS^). We
also exclude umbo motion measurements in which the displacement was less than five times the SD-based estimate of the measurement noise. The noise exclu-sion eliminated 26 out of 303 holographic measure-ments, where the excluded data tended to be at frequencies above 16 kHz.
In general, the normalized umbo displacements from all five specimens in this study show similar trends with frequency (Fig. 5): the displacement magnitude is rather flat with frequency between 0.2 and 1 kHz and with peaks between 0.8 and 2 kHz. The magnitude generally falls from 1 kHz to around 10 kHz, with small local maxima and minima occur-ring in individual bones at different frequencies. Above 10 kHz, there tends to be a relatively sharp maxima near 14 kHz, and a decrease to a magnitude minimum at 17 kHz. The measurements in the
individual ears vary by 5–10 dB from the mean, especially at the lowest and the highest frequencies.
The mean normalized umbo displacement of our data compares well with several published studies. Below 1 kHz, our umbo displacement magnitude is close to Hato et al.’s (2003) mean umbo displacement and about 5 dB lower than Nakajima et al. (2005) data. In the range between 1 and 4 kHz, our umbo displacement magnitude is similar to both the Nakajima et al. and Hato et al. data. Between 4 and 10 kHz, both our umbo displacement magnitudes and the Hato et al. (2003) magnitudes fall with increased frequency, but our data remain generally higher than Hato et al. by 5 dB. In general, the mean umbo displacement phase from our measurements agrees well with published data across the frequency range from 0.2 to 10 kHz. Our data at frequencies above 10 kHz are new as few studies address the displace-ment of the umbo at those higher frequencies. One
5 kHz 10.7 kHz 14.6 kHz 17.1 kHz
A
B
C
D
re o v er umbo re o v er umbo MA GNITUDE (dB) PHASE (ccyles) 10 –10 –5 0 5 0.5 –0.5 –0.25 0 0.25E
F
G
H
re o v er umbo re o v er umbo MA GNITUDE (dB) PHASE (ccyles) 10 –10 –5 0 5 0.5 –0.5 –0.25 0 0.25Vertex
aEC
aEC
Vertex
TB7: aEC in “Anatomical Orientation”
TB7: aEC in “Opposite Orientation”
FIG. 4. Sound pressure maps in the tympanic ring plane in ear TB 7 at selected frequencies, normalized by sound pressure over the umbo.A–D aEC in anatomical orientation, see cartoons at left; E–H
aEC in nearly opposite orientation, see cartoons at left.A, E 5 kHz; B, F 10.7 kHz; C, G 14.6 kHz; D, H 17.1 kHz. Top magnitude in decibels; bottom, phase in cycles. Figure details as for Figure3.
point of caution in this high-frequency range is that we have normalized all of our data in Figure5by the sound pressure measured at the rim of the TM, and the data of Figures 3and 4 (also Ravicz et al. 2014) suggest that there are variations in the sound pressure across the TM surface at frequencies above 10– 12 kHz. More accurate estimates of the umbo transfer function at frequencies above 10–12 kHz will depend on better descriptions of the stimulus sound pressure to the TM in that frequency range.
Normalized TM Surface Motion with Different
aEC Orientations
TM surface motions in TB 1 measured with six different aEC orientations, normalized by the dis-placement of the umbo, are illustrated at three frequencies (1, 7, and 14 kHz) in Figure 6. The displacement patterns evoked at these three stimula-tion frequencies are of varying complexity (Rosowski et al. 2009): simple motion patterns occur at low frequencies (Fig. 6A), with one or two displacement maxima; complex patterns at middle frequencies (Fig. 6B), with multiple maxima and little apparent spatial order; and at high frequencies (Fig.6C), many displacement maxima are arranged in highly ordered patterns. The six aEC radial orientations used in TB 1 (see Fig. 2) are shown in the cartoons to the left of Figure6A. In each panel, the leftmost column shows the TM displacement magnitude re umbo in dB, and the right column shows the TM displacement phase re umbo in cycles. The values are coded by different
colors as shown in the color bar in the top row of Figure6A. The border of the TM and the manubrium of the spatially registered TM images (see BMETHODS^) are outlined in white at each plot.
The TM displacement patterns evoked by 1 kHz stimulation (Fig. 6A) are quite similar among the different aEC orientations. The motion pattern is relatively simple for all orientations, with a region of larger displacement magnitude in the superior–pos-terior quadrant of the TM (the red circular area) that moves about 25–30 dB (a factor of 20–30) more than the umbo, and a smaller local magnitude maximum (+10–15 dB re the umbo) located more superiorly. The entire TM surface moves almost in phase, with a small phase lead of 0.3 cycles generally posterior and superior to the manubrium. These data suggest the aEC orientation has small effects on TM motion at low frequencies, where the ear canal sound field is approximately uniform and the wavelength of sound is much longer than the dimensions of the TM. A more quantitative analysis of TM motion at different aEC orientations will be presented below. The possi-bility of orientation-related changes in umbo motion will be addressed in theBDISCUSSION^.
At 7 kHz (Fig. 6B), TM motion becomes more complex, with multiple local motion regions appar-ent in the magnitude plots at all six aEC oriappar-enta- orienta-tions. These local displacement maxima and minima occur over the entire TM surface and surround the manubrium. In general, we see larger motion in the inferior half of the TM and smaller displacement of the TM along the manubrium. There is also a tendency for larger displacements in the anterior half of the TM. Neither of these tendencies are simply related to the aEC orientation, as they occur with all aEC orientations, including those that are opposite from each other. The phase plots at all six aEC orientations are similar: the anterior and inferior regions of the TM tend to move out of phase with the umbo and manubrium (with a relative phase of 0.5±0.1 cycles; sharp boundaries between red and blue regions are artifacts of phase wrapping). Regions in the posterior-superior quad-rant generally move in-phase (±0.1 cycles) with the umbo and manubrium. Again, these tendencies are not affected by aEC orientation.
At 14 kHz (Fig.6C), TM motion is ordered, with a ring-like organization in the displacement magni-tude and phase arranged around the manubrium, and the manubrium motion is generally 10∼20 dB lower in magnitude than the regions of maximal displacement on the TM, similar to our previous results (Cheng et al. 2013). The phase maps show that the umbo and manubrium generally move out of phase with the rest of the TM, which suggests a nodal boundary around the manubrium. The small
0.001 0.01 0.1
Umbo Displacement Magnitude
100 1000 10000 TB1 TB3 TB4 TB6 TB7 Mean +/- STDEV Nakajima et al. 2005, N=13 Hato et al. 2003, N= 10 Frequency (Hz)
per Sound Pressure (micrometer/Pa)
FIG. 5. Umbo displacement magnitude normalized by sound pressure measured with the aEC orientation similar to anatomical ear canal direction in five ears, along with the mean and standard deviation (SD). We also plot the mean results of two other studies (Hato et al.2003; Nakajima et al.2005) for comparison.
variations in phase on the TM surface are suggestive of a small traveling-wave-like component (Cheng et al. 2013). While there are observable differences in the distribution of the magnitude of motion with different orientations at this high frequency, for example, the overall TM displacement magnitude relative to the umbo in the aEC orientation 180 ° to the manubrium (3rd row) seems to be higher (by at least 5 dB) than the other five aEC orientations, there is a great similarity in their phase patterns (Note that deep blue at −0.5 cycle is the same as dark red at +0.5 cycle). The phase similarity suggests that with stimulus frequencies above 14 kHz, there is no substantial effect of aEC orientation on the pattern of TM motion, even though there are significant sound pressure variations (10–25 dB) across the tympanic ring plane at higher frequen-cies (Figs. 3 and 4). We will further investigate the relationship between the aEC orientation and the variations within the sound field and the TM surface displacements in the BDISCUSSION^.
Comparison of Sound Pressure Distribution and
TM Motion with Different aEC Orientations
One-Dimensional Characterizations of Two-Dimensional PTRand TM Motion MapsWhile the color-coded two-dimensional PTR and TM
motion maps in Figures3,4, and6, respectively, allow rapid qualitative assessment of response patterns, fine quantitative comparisons in the two-dimensional do-main are more difficult. To aid such comparisons, we also plot PTR and TM motion in one-dimensional
domains: i.e., along TM diameters (similar to the TM radii we used in Cheng et al.2013). Such analyses test the correlation between sound pressure and TM displacement at the same location and aid the detection of the effects of aEC orientation on both quantities.
Two orthogonal diameters based on TM landmarks were selected for this analysis: (1) approximately along the manubrium and the umbo (Fig. 7A); and (2) through the umbo approximately perpendicular
-10 0 10 20 -0.5 -0.25 0 0.25 0.5 Magnitude (dB) Phase (Cycles) aEC 60 (~Anatomical) aEC 90 aEC 180 aEC 225 aEC 270 aEC 360 aEC Orientations 30 Posterior Super ior (A) 1 kHz: Magnitude Phase Posterior Super ior (B) 7 kHz: Magnitude Phase Posterior Super ior (C) 14kHz:
Fig. 6. TM surface motion maps quantified by stroboscopic holography in ear TBs 1 with 6 different aEC orientations (see cartoons to the left ofA; the angle between the aEC long axis and the manubrium 0 ° increases clockwise from top to bottom). The
displacement magnitude and phase (normalized to the umbo) are plotted in the left and right columns, respectively, and values coded in colors by color bar in each column inA. The TM annulus and the manubrium are outlined in each plot. A 1, B 7, and C 14 kHz.
to the manubrium (Fig. 7B; see inset cartoons). Displacement and PTRmagnitude and phase relative
to the umbo measurements were plotted as a function of distance from the umbo (origin). Because the diameters did not necessarily coincide with the grid of sound pressure measurement locations, the magni-tude and phase angle of the sound pressure were interpolated logarithmically (dB) at intermediate points along these diameters from the two nearest measurements.
Data from two nearly opposite aEC orientations are compared for TBs 4 and 7 in Figure 7 at selected frequencies covering low- to high-frequency ranges (low, 0.8 kHz; medium, 5 kHz; high, 10 and 15 kHz (10.5 and 15.5 kHz for TB 7)). At each frequency, the top panel shows the magnitude relative to the umbo in decibels, and the bottom panel shows the relative phase in cycles. The horizontal axis represents the distance from the umbo (origin) in millimeters, with the positive axis going inferior (Fig. 7A) or posterior (Fig. 7B). The TM
TB4: TB7: Mag. re Umbo (dB) -40 0 30 Phase (Cycles) -1 0 1 Mag. re Umbo (dB) Phase (Cycles) Mag. re Umbo (dB) Phase (Cycles) Mag. re Umbo (dB) Phase (Cycles) 800 Hz 5000 Hz 10000 Hz 10500 Hz 15000 Hz
Distance from Umbo (mm) Distance from Umbo (mm)
0 1 2 3 4
-1 -2 -3
-4 -4 -3 -2 -1 0 1 2 3 4
Disp. aEC Anatomical Disp. aEC Opposite Pres. aEC Anatomical Pres. aEC Opposite
Inferior Umbo 15500 Hz -40 0 30 -1 0 1 -40 0 30 -1 0 1 -40 0 30 -1 0 1
(A)
TB4: TB7: Mag. re Umbo (dB) -40 0 30 Phase (Cycles) -1 0 1 Mag. re Umbo (dB) Phase (Cycles) Mag. re Umbo (dB) Phase (Cycles) Mag. re Umbo (dB) Phase (Cycles) 800 Hz 5000 Hz 10000 Hz 10500 Hz 15000 HzDistance from Umbo (mm) Distance from Umbo (mm)
0 1 2 3 4 -1 -2 -3 -4 -4 -3 -2 -1 0 1 2 3 4 Posterior Umbo 15500 Hz -40 0 30 -1 0 1 -40 0 30 -1 0 1 -40 0 30 -1 0 1
(B)
FIG. 7. A Sound pressure in the tympanic ring plane and TM displacement (both normalized by umbo) along the diameter running approximately along the manubrium superiorly inferiorly (dotted line in cartoon), in ears TB 4 (left column), and TB 7 (right column), at 0.8 kHz, 5 kHz, 10 kHz (10.5 for TB 7), and 15 kHz (15.5 for TB 7) (from top to bottom). Solid and dotted lines, displacement along the diameter with aEC in anatomical orienta-tion and opposite to anatomical orientaorienta-tion, respectively (illustrat-ed by arrows in cartoon for TB 4); triangles and circles, sound
pressure along the diameter with anatomical aEC orientation and opposite to it, respectively. At each frequency: top panel, magnitude re umbo in decibels; bottom panel, phase re umbo in cycles. The horizontal axis is the distance from the umbo along the diameter (positive for inferior).B Sound pressure in the tympanic ring plane and TM displacement along the diameter approximately perpendicular to the manubrium running across the umbo anteriorly posteriorly (see dotted lines in cartoons, posterior for positive), in the same ears as shown in (A).
displacements are plotted as solid (aEC anatomical) and dotted (aEC opposite to anatomical) lines, and sound pressures are shown as triangles (aEC anatomical) and circles (aEC opposite). Note that the sound pressure was measured with a spatial resolution of about 1 mm, thus only 7–8 sound pressure measurement points appear along each diameter. The phase at the umbo is defined as zero and unwrapped along the distance from the umbo in either direction.
PTRDistribution Along Diameters
In general, the PTR distributions along the two
diameters in Figure7A, B are very similar in the two nearly opposite aEC orientations, except at the highest frequency where they deviate at locations furthest from the umbo. Such high-frequency |PTR|
deviations are most prominent along the diameter perpendicular to the manubrium (Fig.7B), where the |PTR| in the two orientations differs by 5 dB at the
locations farthest from the umbo. This result is consistent with the PTR maps in Figures 3 and 4,
where a pressure gradient is observed along the aEC long axis at high frequencies. The diameters perpen-dicular to the manubrium are nearly aligned with the aEC long axis in both orientations, thus |PTR|
devia-tions are larger in Figure 7B than in Figure 7A. At frequencies below 10 kHz, the sound pressure magni-tude and phase shows little variation along either diameter with either aEC orientation, consistent with the relatively uniform low-frequency PTR distribution
shown in Figures3and4. TM Motion Along Diameters
The TM displacements along two diameters with two nearly opposite aEC orientations show many similar-ities, consistent with our qualitative comparisons of TM motion maps at different aEC orientations (Fig.6). However, there are also clear differences.
The similarities are seen in both magnitude and phase plots. For instance, at all measurement fre-quencies, in many places along the two diameters, the displacement magnitude and phase from two nearly opposite aEC orientations are almost identical, such as in (i) TBs 4 and 7 TM diameter either along or perpendicular to the manubrium at 0.8 kHz (Fig.7A, B, top panels), (ii) TBs 4 and 7 TM diameter along the manubrium at 5 kHz between −4 and 1.5 mm (Fig.7A), and (iii) TB 4 TM diameter perpendicular to the manubrium at 5 kHz between −4 and 1 mm (Fig.7B). In some places, TM displacement phases are similar between the two aEC orientations though their magnitudes are different, or vice versa. For example, in TB 4 TM displacement magnitudes along the diameter along the manubrium at 15 kHz (Fig. 7A
bottom-left panel) show differences in magnitude at
locations between 2 and 4 mm with two aEC orientations, but their phases are very similar. There are also clear differences in TM displacement along the diameters shown in Figure 7. At frequencies of 5 kHz and higher, displacements of the TM along the two diameters in both aEC orientations show multiple peaks in magnitude, but the locations and the absolute values of these magnitude peaks vary with aEC orientations, such as in TBs 4 and 7 along the manubrium or perpendicular to the manubrium in most of horizontal axis at 10 and 15 kHz (Fig.7A, B, bottom two panels). Ear canal orientation-related TM displacement differences occur more frequently at higher frequencies.
Different displacement phases suggest different TM wave motions along the surface: For example, in TB 4 along the manubrium at 10 kHz (Fig. 7A), the displacement phases in the aEC orientation opposite to the anatomical (dotted line) show clear half-cycle phase variations along the positive horizontal axis, consistent with standing-wave-like motion components on the TM surface, while at the same locations, the graded displacement phases in aEC anatomical orien-tation (solid line) are consistent with traveling-wave-like motions on the TM surface.
To further quantify and compare the differences in TM displacement and sound pressure observed in Figure7, we computed the mean and SD of the ratios of the TM displacement magnitude (or |PTR|) along
each of the diameters between the two ear canal orientations, at each measurement frequency. For example, at 10 kHz in TB 4 (see Fig. 7A), the mean of the ratios of the displacement magnitude between the two ear canal orientations at about 400 TM locations on the diameter along the manubrium is 0.6 dB, with a SD of 6.6 dB. At frequencies of 15 kHz and below in TB 4, this mean ratios varied between −5.3 and 2.7 dB and the SD varied between 2.8 and 8.5 dB. At 16 and 18 kHz, the mean ratios were−9.3 and−6.5 dB, respectively, with SDs of 9.2 and 6.7 dB. While these means and SDs (especially at frequencies less than 15 kHz) are rather small, the large number of points (~ 400) in the averages leads to significant differences between some of the means and 0 dB (paired t test, pG0.05). Over the same diameters in TB 7, the mean and SD of the |PTR| ratios at all
measurement frequencies were smaller (means ranged from −0.25 to 0.22 dB, and the SDs ranged between 0.15 and 4.22 dB, with the larger SDs at 14 kHz and above) and generally did not reach statistical significance except at the highest frequen-cies measured. Similar statistics were observed in all other bones. While some of the mean ratios of the displacements measured with the two ear canal orientations are statistically significant, the signifi-cance was quite variable across the frequency range,
and the absolute mean ratios at most measurement frequencies were small (generally less than 5 dB). These data are consistent with the statement that variations in ear canal orientation has only a small effect on TM motion along the TM surface, but can cause substantial variations in the measured sound pressure at frequencies above 13–14 kHz, as seen in Figures3and4.
DISCUSSION
We now discuss: (i) how our results in this study using the aEC compare with our previous measurements made with the ear canal removed; (ii) an extended analysis of the effect of variation in aEC orientation on TM surface displacements and sound pressures at the tympanic ring; and (iii) whether variations in displace-ment and pressure over the TM surface are correlated.
Comparison of TM Motion with aEC Present (This
Study) vs. Ear Canal Absent (Previous Studies)
In our previous measurements of TM motion with holography (Cheng et al. 2010,2013; Rosowski et al.2009,2011), the ear canal was removed, such that the direction of sound stimulus was orthogonal to the plane of the tympanic ring and the sound field was fairly uniform along the tympanic ring plane at frequencies as high as 20 kHz (Rosowski et al.2009). However, in real human ears the ear canal long axis is tilted about 45 ° to the plane of the tympanic ring (Fig. 1A; also Ravicz et al. 2014), thus sound waves traveling down the ear canal first encounter the TM edge nearest to the sound source and then travel across the surface of the TM, producing sound pressure variations along the TM surface at frequen-cies above 10 kHz (this study; also Stinson 1985; Stinson and Khanna 1989; Ravicz et al. 2014). It has been suggested that this traveling acoustic wave initiates TM displacement waves that travel on the TM surface (Parent and Allen 2010). To test if the presence of the ear canal produces different TM motions from what we have quantified before, we used the anatomically realistic aEC to mimic the natural acoustic pathway for sound waves to travel across the TM. We now compare TM motions quantified in this study and previous studies in the following sections.
Qualitative Comparison of TM Motion Patterns
Qualitatively, the TM motions with aEC from this study are quite similar to those from our previous studies with widely exposed TMs, e.g., the TM
surface displacements show similar frequency-dependent patterns that progress from simple to complex to ordered as the stimulus frequency increases (Rosowski et al. 2009; Cheng et al. 2010,
2013). Also, notable TM vibration features described in our earlier reports (Cheng et al. 2010, 2013; Rosowski et al.2011) are observed in this study with the aEC, including: (i) At all stimulus frequencies the displacements over the manubrium and umbo are small compared with the maximal TM displace-ments. (ii) At low frequencies (≤1 kHz), the displacement patterns exhibit one or two large local displacement regions, most often in the posterior quadrant of the TM, and the entire TM moves in phase. (iii) With stimuli between 1 and 8 kHz, both studies show multiple local peaks of displacement magnitude associated with significant phase varia-tions that are circularly arranged around the manu-brium. The phase variations are usually less than one-half cycle but sometimes describe sudden half-cycle phase shifts (see Fig. 7A, B in this study and Figs. 9 and 10 in Cheng et al. 2013). (iv) With stimulation frequencies above 10 kHz, we see clear ring-like displacement patterns that are circularly organized around the manubrium in magnitude and phase in both studies (see Fig.6C in this study and Figs. 1 and 2 in Cheng et al. 2013). The high-frequency ring-like displacement phases exhibit smaller cyclic spatial variations, consistent with our previous suggestion that the TM is moving nearly in-phase but with the addition of small oscillating in-phase angleBripples^ (Cheng et al. 2013). (v) At frequen-cies above 14–16 kHz, the umbo and manubrium tend to move out of phase with the rest of the TM. Quantitative Comparison of TM Motions
More quantitative comparisons of both data sets suggest: (i) The displacements at the local peak regions are more than 10 dB greater in magnitude than the displacement at the umbo, with larger displacement ratios (20 dB or larger) more common at higher stimulus frequencies. (ii) The ring-like displacement patterns of the TM, with multiple local peaks in displacement magnitude circularly arranged around the manubrium in the middle- to high-frequency ranges, show similar numbers of displace-ment rings around the manubrium, with two to three rings visible in the surface maps between 5 and 10 kHz, three to four rings between 10 and 15 kHz, and four to five rings above 15 kHz. The frequency-dependent magnitude of the umbo displacements relative to the sound pressure measured at the TM rim are quite similar in this and our previous studies regardless of the presence or absence of the aEC (compare Fig. 5 of this study with Fig. 5. of Cheng
et al. 2013), though they appear a little smoother in this study.
Comparison of Traveling Wave Delay on the TM Surface The phase data of Figure7and similar data in Cheng et al. (2013) allow us to compare traveling wave delays on the TM surface between the two studies. We used a technique described in Cheng et al. (2013) to estimate wave delay due to traveling waves on the TM surface from observations of the displacement magnitude and phase along the TM radii from the umbo. When high-frequency stimuli evoke prominent cyclic patterns in the displacement magnitude and phase along the TM radius, the distance between two ripples is assumed to be a half wavelength of the traveling wave. In Figure7B, with TB 4 at 15 kHz, we see 4 magnitude and phase ripples on the TM diameter between −2.7 and −0.3 mm from the umbo (this is consistent with the number of rings seen in the displacement maps at this frequency), which suggest two wavelengths have occurred in 2.4 mm. These data predict a wave speed of 18 m/s and a traveling wave delay from TM rim to umbo (∼4 mm) of about 222 μs. This estimated wave speed and delay are comparable with similar estimates from our previous measure-ments (Fig. 13 in Cheng et al. 2013). However, the delays estimated by this method are much higher than the 40- to 90-μs human middle ear delays others have estimated based on ear canal sound pressure and motion of the stapes or sound pressure in the vestibule (O’Connor and Puria 2008; Nakajima et al.
2009), suggesting the traveling waves we observe on the TM surface are not the source of middle-ear group delay.
The Effect of aEC Orientation on the Motions of
the TM and Sound Pressures at the Plane of the
Tympanic Ring
TM Surface Motions and PTRwith Different aEC
Orientations
The holographically determined displacements on the surface of TB 1 with six aEC orientations at three frequencies are presented in Figure 6. This figure shows small variations in the displacement on the TM as the aEC orientation is varied, but the variations in displacement are not well tied to the variations in aEC orientation. For example, the regions of maximal displacement magnitude in Fig. 6B, C within the anterior and inferior TM quadrants, together with the region of lower motion in the posterior-superior quadrant do not vary regularly with orientation, and the spatial patterns in magnitude appear similar between different aEC orientations even in cases where the orientation differs by 180 °.
On the other hand, the sound pressure maps measured with different aEC orientations (Figs. 3
and 4) show clear orientation-related differences at sound frequencies above 10 kHz, where the angula-tion of the aEC relative to the TM surface produces small to large differences in |PTR| along the projection
of the aEC long axis, sometimes shown as standing waves in PTRwith nodes at different locations within
the plane of the tympanic ring (details described in theBRESULTS^). The Bdiameter^ plots at the highest
frequency of stimulation illustrated in Figure 7A, B
also describe orientation-dependent spatial variations in |PTR| of 20 dB or more.
There is a large variation of PTRvalues and patterns
among TBs (compare TB 4 in Fig. 3 with TB 7 in Fig.4) or different aEC orientations (compare Fig.4C, Dwith Fig.4G, Hin TB 7), which may be explained by differences in temporal bone anatomies that affect the coupling of the aEC to the bone. The sound pressure measured in the plane of the tympanic ring depends on both how sound waves propagate down the EC and how they interact with the EC wall and the TM. Orientation-related differences in the distance between the tympanic ring plane (where our PTRwas
measured) and the TM surface can influence our PTR
measurements. As described by Ravicz et al. (2014), sound waves propagate along the long axis of the aEC, which is angled relative to the tympanic ring by about 45 °. Because of this angulation, variations in the definition of the tympanic ring plane canBmove^ the measurement point in directions orthogonal to the wave front, causing ear canal standing-wave nodes to appear in PTRat different frequencies or locations. A
more detailed discussion on this subject can be found in Ravicz et al. (2014).
Umbo Displacement from Different aEC Orientations The analyses we use to investigate the effect of aEC orientations on patterns of TM motion begin by normalizing the motion of the TM surface by the measured umbo motion. A natural question, then, is whether we see any effect of aEC orientation on the sound-induced motion of the umbo. The answer to this question is complicated by: (i) the relatively low motion of the umbo in response to sound, which leads to an increased impact of the noise in our measurements, (ii) our normalization of the umbo displacement by sound pressure measured near the edge of the TM rather than over the TM, which adds uncertainty to our estimate of the stimulus sound pressure, especially with sound frequencies above 10 kHz where spatial gradations occur in the sound field at the TM ring and near the TM surface (Figs.3
and 4; also Ravicz et al. 2014), and (iii) orientation-induced variations in the position of the TM relative to the holographic measurement system that compli-cate the sound pressure field (e.g., Fig.4G–Hvs. C–D)
and the estimation of TM motion from our 1D measurements (TM motions along the holographic laser beam).
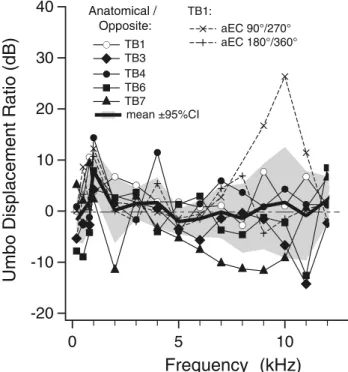
To reduce the effects of these procedural variations and maximize the effect of changes in aEC orientation, we compared the umbo motions produced by two aEC orientations that differed by 180 °. According to Figure2, we can produce seven pairs of such measurements (described in the caption and legend of Fig.8), and we plot the dB value of the ratio of the umbo displacement magnitude (normalized by sound pressure) measured with opposite aEC orientations in Figure8.
In Figure8, at frequencies below 10 kHz, the ratios measured in the seven cases generally fall within the ±10 dB range. Above 10 kHz, the range of the data increases to between −20 and nearly 30 dB. ANOVA tests on the dB differences in umbo motion related to differences in aEC orientations at 15 frequencies and 7 pairs of opposite orientations, followed by Bonferroni correction tests for orientation-induced differences between umbo displacement at each frequency, suggest none of the umbo displacement ratios plotted in Figure 8 are statistically significant
from 0 dB (p90.05, see Table 1). Student’s t tests
comparing the measured mean at each frequency to a unit value of 0 dB revealed that all but the measure-ments at 1 kHz were not statistically different than 0 (p90.05). The general lack of significance at the 5 % level is also indicated by the inclusion of the 0 dB value within the calculated 95 % confidence limits around the ratios at frequencies other than 1 kHz. The reason for the increased magnitude of this ratio at 1 kHz is not clear. The conclusion of this analysis is that while our estimates of umbo displacement vary substantially between different aEC orientations, that variation is likely not related to differences in aEC orientation.
The Effect of aEC Orientation on Spatially
Averaged Sound Pressures and Displacements
Computation of Spatially Averaged Sound Pressures and TM Displacement Magnitude Ratios with Opposite aEC OrientationsWe showed in the BRESULTS^ that the presence of
the aEC resulted in pressure gradients that were arranged transversely across the TM surface at fre-quencies higher than 10 kHz (Figs. 3, 4, and 7) but had little effect on TM motion patterns at almost all the frequencies in our measurements (Figs.6and7). Here, we further investigate this conclusion by comparingBspatially^ averaged PTRand TM
displace-ment magnitude ratios with two nearly opposite aEC orientations. The idea is similar to the comparison of umbo displacements measured with two nearly oppo-site aEC orientations (Fig. 8) to maximize the measure’s dependence on the ear canal orientation. Such metrics may help define more general relation-ships between displacement, sound pressure, and the aEC orientation.
Figure 9 describes the computation of a spatially averaged |PTR| ratio using data gathered in TB 4 at
14 kHz. The top panel (Fig.9A) shows a TM cartoon with the manubrium outlined. We define the hori-zontal axis (x-axis) along the projection of the aEC long axis (as indicated by two arrows: aEC anatomical and aEC opposite to anatomical), with the origin (0, 0) at the umbo, and we define the y-axis perpendic-ular to the x-axis (transverse to the EC)—see figure. In Figure9B, we plot the PTRmagnitudes (dB) measured
along three lines perpendicular to the x-axis (three colored double dot-dashed vertical lines of Figure9A), with triangles representing |PTR| measurements made
when the aEC was oriented anatomically and circles with the aEC oriented opposite to anatomical. Each of the three vertical lines in Figure 9B is the 0-dB reference for |PTR| measured along that line. The
ratios of |PTR| measured with the aEC in the anatom-40 30 20 10 0 -10 -20
Umbo Displacement Ratio (dB)
10 5 0
Frequency (kHz)
TB1 aEC 90°/270° TB3 aEC 180°/360° TB4 TB6 TB7 Anatomical / Opposite: mean ±95%CI TB1:FIG. 8. The ratios of seven pairs of sound-induced umbo displace-ment measuredisplace-ments, where each pair is two measuredisplace-ments made with aEC orientations that differ by∼180 °. The measurement pairs include anatomical ear canal orientation vs. opposite to anatomical ear canal orientation for all five bones and two additional pairs with aEC orientation 90 °/270 ° and 180 °/360 ° in TB 1 (see Fig.2). The ratios that include anatomical EC orientation are plotted in solid lines. The data are plotted on a linear frequency scale to better observe the high-frequency data. The shaded region shows the 95 % confidence around the mean from Student’s t tests. The inclusion of the 0-dB value in the shaded area is indicative of a lack of significance at the 5 % level (p90.05) at all frequencies other than 1 kHz.
ical vs. opposite orientation were computed along the three vertical lines, as shown in Figure9Bas solid lines with diamonds. Figure9Cshows the spatially averaged |PTR| ratios along the vertical lines (three colored
diamonds represent values along the three vertical lines in Fig.9B). The standard deviations (SD) around each average are shown by error bars, which were less than ∼1 dB. Figure 9C also includes a straight-line slope fit to all the spatially averaged |PTR| data.
Differential Effects of aEC Orientation on Spatially Averaged PTRand TM Displacement
The technique described in Figure 9 was used to compute spatially averaged PTR magnitude ratios in
TBs 4, 6, and 7 (PTR was measured in two opposite
aEC orientations in only three bones, with sufficient spatial sampling) and the spatially averaged TM displacement magnitude ratios in TBs 1, 3, 4, 6, and 7, as shown in Figure10. In each panel, the thin lines represent results from individual bones, and the thick black line represents the mean of all bones. At 10, 12, and 16 kHz, we also plot the least squares best linear fits to the mean (dotted gray lines), and note the respective slope value, k.
At frequencies below 10 kHz, the spatially averaged |PTR| ratios (Fig. 10, left column, top two panels) fall
between ±3 dB along the x-axis in each individual bone. These results are consistent with the small effect of aEC orientation on tympanic ring plane sound pressure distribution at low frequencies (see Figs. 3
and 4 below 10 kHz). At frequencies above 10 kHz, the spatially averaged |PTR| ratios (Fig.10, left column,
bottom two panels) vary between −25 and 20 dB, consistent with the range of sound pressure measured across the tympanic ring plane with the aEC during high-frequency stimulation (see Figs. 3 and 4 at frequencies above 10 kHz). The decrease in |PTR|
ratio along the positive x-axis at 10 kHz and above is also consistent with the |PTR| gradient direction as
shown in Figures 3 and 4. Note that in some bones and at some frequencies the PTRdistributions differ in
form between opposite aEC orientations (Figs.4C, D
compare with Figs. 4G and H for TB 7), which complicates the interpretation of these spatially aver-aged |PTR| ratios. Nonetheless, the spatially averaged
|PTR| ratios from each temporal bone suggest a linear
progression of the computed ratio along the x-axis, and the slope of the progression tends to decrease as frequency increases. Similar to what we showed in Figure9C, the SD of the spatially averaged |PTR| ratio
of each point along the x-axis in Figure 10 is on the order of 1 dB in each ear.
The higher density of displacement measurements and complex motions of the TM produced more complex behaviors in the averaged ratios of TM displacement magnitude along the aEC long axis (Fig. 10, right column), which makes it difficult to compare directly with the averaged |PTR| ratios. At first
glance, the averaged displacement ratios show differ-ent behaviors than the averaged ratios of |PTR|. There
are more variations in the spatially averaged displace-ment ratios in each ear along the x-axis, with the SD of the spatially averaged displacement magnitude ratio at each point along the x-axis in each ear normally about 10 dB in all measurements (compared with the 1-dB SD of the averaged |PTR| ratios noted above). We
TABLE 1
Two-way ANOVA and Bonferroni correction tests of data in Figure8
Source of variation SS df MS F value p value
aEC orientation 353.4351387 1 353.43514 1.90172 0.1696
Bonferroni correction test for differences between mean umbo displacement ratios in dB (initial aEC orientation vs. its opposite) Frequency (Hz) Difference 95 % confidence interval Test statistics p level
200 2.25009 −13.26419 17.76437 0.28588 0.77525 500 2.25009 −13.26419 17.76437 0.28588 0.77525 800 2.57086 −12.94342 18.08513 0.32663 0.74427 1000 8.54625 −6.96803 24.06053 1.08581 0.27878 2000 0.17464 −15.33964 15.68892 0.02219 0.98232 3000 1.4875 −14.02677 17.00178 0.18899 0.85028 4000 1.84336 −13.67092 17.35763 0.2342 0.81505 5000 −1.83578 −17.35006 13.6785 0.23324 0.8158 6000 −0.79348 −16.30776 14.7208 0.10081 0.91979 7000 0.01815 −15.49613 15.53242 0.00231 0.99816 8000 0.11003 −15.40424 15.62431 0.01398 0.98886 9000 1.3246 −14.18968 16.83887 0.16829 0.86651 10,000 3.1008 −12.41348 18.61508 0.39396 0.694 11,000 1.32865 −14.18562 16.84293 0.16881 0.86611 12,000 3.16574 −12.34853 18.68002 0.40221 0.68793 13,000 7.09015 −8.42412 22.60443 0.90081 0.3687 14,000 10.45974 −5.05454 25.97402 1.32892 0.18529 15,000 6.38836 −9.12592 21.90264 0.81165 0.41789