Dynamic Strategic Planning for Transportation Infrastructure Investment in Japan by
Taku Nishimura B. Eng. Civil Engineering The University of Tokyo, 1992
SUBMITTED TO THE TECHNOLOGY AND POLICY PROGRAM AND THE DEPARTMENT OF CIVIL AND ENVIRONMENT ENGINEERING IN PARTIAL
FULFILLMENT OF THE REQUIREMENTS FOR THE DEGREES OF MASTER OF SCIENCE IN TECHNOLOGY AND POLICY
AND
MASTER OF SCIENCE IN TRANSPORTATION AT THE
MASSACHUSETTS INSTITUTE OF TECHNOLOGY JUNE 1999
@1999 Massachusetts Institute of Technology All Rights Reserved
Signature of the Author
Technology and Policy Program May 14, 1999 Certified and Accepted by
i
VRichard de Neufville Professor of Civil and Environmental Engineering Chairman, MIT Technology and Policy Program
)f, I,
Accepted by.
, Thesis Supervisor
Andrew J. Whittle Chairman, Departmental Committee on Graduate Studies
Dynamic Strategic Planning for
Transportation Infrastructure Investment in Japan
by
Taku Nishimura
Submitted to the Technology and Policy Program and the Department of Civil and Environment Engineering on May 14, 1999 in Partial Fulfillment of the Requirements for
the Degrees of Master of Science in Technology and Policy and Master of Science in Transportation
ABSTRACT
This thesis applies Dynamic Strategic Planning (DSP) to transportation infrastructure investment in Japan. It focuses on the difference in project evaluations between the conventional and DSP-based cost-benefit analysis. It also analyzes policy issues in implementing DSP in Japan's Ministry of Transportation (MOT).
Today, the Japanese government faces criticism of its inefficient public works investments at both macro and project levels. To cope with this, MOT announced that it would incorporate cost-benefit analysis into its decision-making for investments in major new projects. While this movement in MOT is supposed to make its investments more efficient, conventional cost-benefit analysis does not systematically take into account future uncertainties and risks and can lead to wrong decisions.
DSP is the approach that takes into account future uncertainties and risks and insures managerial flexibility. It can maximize the expected net present value (NPV) of a project. In other words, it can minimize the loss of NPV caused by a failure to choose the best strategy.
A case study of a container terminal development in Japan introduces the problem of the conventional method and advantages of DSP. It demonstrates that project
valuation based on DSP using decision tree analysis, the Black-Scholes equation, or Monte-Carlo simulation, is more precise than the conventional method. Also, DSP has
advantages over the conventional method in terms of its ability to increase the real value of projects.
This thesis finally analyzes policy issues in implementing DSP in MOT, and recommends that MOT use DSP as a basis of its decision-making while the Ministry considers political issues.
Thesis Supervisor: Richard de Neufville
Title: Professor of Civil and Environmental Engineering, Chairman, MIT Technology and Policy Program
TABLE OF CONTENTS
LIST OF FIGURES ... 9
LIST OF TABLES ... 11
ACKNOWLEGEMENTS...15
INTRODUCTION...17
CHAPTER 1: CRITICISMS OF TRANSPORTATION INFRASTRUCTURE DEVELOPMENT SYSTEMS IN JAPAN AND EFFORTS TO MAKE THEM MORE EFFICIENT...21
Criticism of Inefficient Investments ... 21
Criticism at M acro Level... 22
Criticism at Project Level ... 22
Transportation Infrastructure Development Systems in Japan...22
Permission for Developments or Plans ... 24
Investm ent Five-year Plans ... 24
Subsidies by the National Government ... 26
Efforts Towards More Efficient Investments ... 27
C ost-Benefit A nalysis ... 27
Re-evaluation Systems for Public Works... 28
CHAPTER 2: UNCERTAINTIES AND RISKS IN TRANSPORTATION INFRASTRUCTURE INVESTMENT... 31
Forecasted Demand and Actual Demand...31
Uncertainties in Transportation Infrastructure Investment...32
M a rket U ncerta in ties... 3 7 P roject U ncertainties ... 40
CHAPTER 3: EVALUATING TRANSPORTATION INFRASTRUCTURE INVESTMENT USING DYNAMIC STRATEGIC PLANNING...45
Imaginary project... 45
NPV based on a deterministic scenario (simple NPV)... 48
Expected NPV taking into account uncertainties (Base Expected NPV)...48
D ynam ic Strategic P lanning ... 50
Option calculator...53
PD E/Black-Scholes equation ... 53
Simulation/Monte-Carlo Method ... 57
CHAPTER 4: CASE STUDY: EVALUATING A CONTAINER TERMINAL DEVELOPMENT IN JAPAN...61
Presentation of the project for case study ... 61
Case study model and NPV valuation ... 63
Step 1. Construct Cost-Benefit Mode... 63
F ram ew ork of M odel ... 63
H orizon of analysis... 63
P roject uncertainty ... 65
Step 3. Identify strategic opportunities and options... 66
P3' decision at Year 0 (for Phase 1)... 66
2"d decision at Year 10 (for Phase 2) ... 66
D ecision Tree A nalysis ... 67
Step 4. Choose Real Options value calculator... 71
Monte-Carlo simulation and Black-Scholes equation... 71
Step 5. Calculate DSP-based NPV (with Real Options value)... 74
M onte-C arlo sim ulation ... 74
NPV with Real Options value (Total NPV)... 75
B lack-Scholes equation ... 75
Implications of the case study ... 76
Simple NPV vs. Base Expected NPV ... 76
Option Value and Total NPV ... 77
D S P ... 7 7 What the Government Should Consider in Order to Effectively Use DSP...78
M aster P lans ... 78
Investment Five-year Plans ... 78
Subsidies by the National Government ... 79
Conclusion of the case study...80
CHAPTER 5: POLICY ANALYSIS FOR IMPLEMENTATION OF DYNAMIC STRATEGIC PLANNING IN JAPAN'S MINISTRY OF TRANSPORTATION...81
Problem definition: Conventional cost-benefit analysis alone cannot ensure optimal investment decision-making ... 83
Policy instrum ents: DSP ... 84
Cast of characters: Stakeholders, decision-makers, and influence brokers ... 85
Stakeholders ... 85
D ecision-makers ... 87
Influence brokers ... 87
Constituency and impedim ents... 88
Im plem entation strategy... 88
D efinition of Strategy and Tactical Plan... 88
Evaluation of Impedim ents ... 89
Negotiations ... 90
Regulation/Legislation ... 92
CON CLU SIO N ... 93
REFERENC ES ... 95
Appendix 1: Cost-Benefit M odel... 99
Appendix 2: Statistics Regarding U ncertainties...109
Appendix 3: D ecision Tree Analysis for Case Study...115
Appendix 4: Monte-Carlo Simulation for Case Study...127
LIST OF FIGURES
Figure 1-1: Portions of the national public works budget allocated to major transportation infrastructure in Japan
Figure 1-2: Procedures before developing an airport in Japan
Figure 1-3: Procedures before authorizing a seaport master plan in Japan Figure 2-1: Actual and forecasted demand for seaport cargo throughout Japan
(5-year perspective)
Figure 2-2: Actual and forecasted demand for international air passengers throughout Japan (5-year perspective)
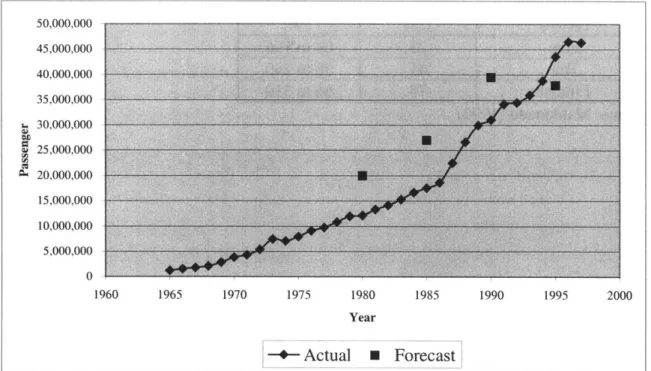
Figure 2-3: Actual and forecasted demand for international air passengers throughout Japan (10-year perspective)
Figure 3-1: Assumptions of imaginary project Figure 3-2: Schedule of imaginary project
Figure 3-3: Decision structure of imaginary project
Figure 3-4: Simple NPV based on a deterministic scenario
Figure 3-5: Expected NPV taking into account uncertainties (Base Expected NPV) Figure 3-6: NPV based on Dynamic Strategic Planning
Figure 3-7: Solution Methods and Option Calculators Figure 4-1: Simplified configuration of the project Figure 4-2: Schedule of the project (Phase 1) Figure 4-3: Framework of the Cost-Benefit Model Figure 4-4: Choice for Phase 1 (at Year 0)
Figure 4-5: Strategic decision opportunities Figure 4-6: Structure of decisions for two phases Figure 4-7: Decision tree analysis (portion of result)
Figure 5-1: Diagram of policy analysis for implementing Dynamic Strategic Planning in Japan's Ministry of Transportation
Figure Al-1: Framework of Benefit Model Figure A3-1: Decision tree for case study
LIST OF TABLES
Table 1-1: Long-term development plans and their authority in Japan Table 1-2: Major projects and cost-benefit components Japan's Ministry of
Transportation analyses
Table 2-1: Actual and forecasted demand for seaport cargo throughout Japan (5-year perspective)
Table 2-2: Actual and forecasted demand for international air passengers throughout Japan (5-year perspective)
Table 2-3: Actual and forecasted demand for international air passengers throughout Japan (10-year perspective)
Table 2-4: Actual and forecasted demand for passengers at Haneda airport Table 2-5: Actual and forecasted demand for New England Region Airports Table 2-6: Actual and planned GDP for Japan
Table 2-7: Estimate and actual cost of container terminal construction in Japan Table 3-1: Total NPV including Option Value
Table 3-2: Volatility of underlying (adding a runway on two runway airfield) Table 3-3: Option value of adding a runway on two runway airfield
Table 3-4. Volatility of underlying (adding a runway on one runway airfield) Table 3-5: Option value of adding a runway on one runway airfield
Table 3-6: Comparison of option values by two methods Table 4-1: Summary of uncertainties
Table 5-1: Stakeholders and their powers
Table 5-2: Stakeholders and their reactions to alternative measures Table A1-1: Container Terminal Operation Cost
Table A1-2: Global Variables for simple NPV calculation Table A1-3: Cost Model
Table A1-4: Benefit Model
Table A1-5: Actual Investment (Start building -10m & -14m Berths at year 1, and no additional investment.)
Table A2-1: Actual and Estimated Cost of Container Terminal Construction in Japan and its distribution
Table A2-2: Three discrete costs by the Bracket-Median method Table A2-3: National container cargo volume
Table A2-4: Three discrete market growths by the Bracket-Median method Table A2-5: Project share during the first five years of operation
Table A2-6: Three discrete shares (first 5-yr. operations) by the Bracket-Median method
Table A2-7: Project share after the first five years of operation
Table A2-8: Annual additional share after the first five years of operation
Table A2-9: Three discrete additional shares (after 5-yr. operations) by the Bracket-Median method
Table A3-1: Nine demand growth paths
Table A4-1: Generated Project demand by Monte-Carlo Simulation Table A4-2: Monte-Carlo Simulation for Choice 1
Table A5-1: Volatility of Asset Value with Choice 1 (Additional net benefit by adding a -14m berth to one -14m berth)
Table A5-2: Option value with Choice 1 (Expansion option of adding a -14m berth to one -14m berth)
Table A5-3: Volatility of Asset Value with Choice 1 (Additional net benefit by adding a -10m berth to two -14m berths)
Table A5-4: Option value with Choice 1 (Expansion option of adding a -10m berth to two -14m berths)
Table A5-5: Volatility of Asset Value with Choice 2 (Additional net benefit by adding a -14m berth to -10m & -14m berths)
Table A5-6: Option value with Choice 2 (Expansion option of adding a -14m berth to -14m & -10m berths)
ACKNOWLEGEMENTS
It was very fortunate for me that I had an opportunity to work on this project under the supervision of Professor Richard de Neufville. On the first day of his class of Dynamic Strategic Planning (DSP), I was very impressed by the concept of DSP because it seemed to be an answer to my inquiry about how to make Japan's public infrastructure development more efficient. Professor de Neufville specializes in airport developing systems, and is also very familiar with Japanese situations. Only his precise, insightful, and patient advice was able to lead me to the completion of this project.
I would like to express my gratitude to my sponsor, Japan's National Personnel Agency, and my all superior officials in Japan's Ministry of Transportation who gave me this precious opportunity of studying abroad. This experience will be my property for the rest of my life.
I appreciate my colleagues in Japan's Ministry of Transportation, particularly Mr. Shigemoto, Mr. Shiota, Mr. Inoue, Mr. Okuda, and Mr. Hirakawa, who cooperated in my collection of Japanese data. It was definitely one of the most crucial parts in this project.
Finally, I would like to thank my parents for their genial encouragement during my stay in the United States.
INTRODUCTION
Investment by the Japanese government is required to be more efficient today than it used to be. For the past half-century, the Japanese government has almost continually invested in the nation's transportation infrastructure under the assumption that demand for it will increase rapidly. This government strategy has supported the healthy growth of the country. This situation, however, has changed. The economic growth of Japan in 1999 is not as strong as it used to be. The public sector is suffering from a huge budget deficit. Under such circumstances, some public works are being criticized as inefficient [Takemura 1996, Sumita 1998]. Accordingly, it is now very important to increase the efficiency of public investments.
Literature regarding project investment policy is abundant. Public Economics, for example, is an established field of study in which efficient government investment policy is discussed [Stiglitz 1988]. Cost-benefit analysis is one of the most popular approaches to making a decision on a project [Anderson and Settle 1977, Zerbe and Dively 1994]. In some advanced Western countries, such as Germany and the United States, cost-benefit analysis has sometimes been applied to decision processes [Morisugi and Kayahara
1998]. Furthermore, the study of corporate finance has developed the theory of optimal investment policy. Discounted Cash Flow (DCF) is one of the most important
approaches to an investment decision in many private companies [Brealey and Myers 1996]. Recently, the value of "Real Options," i.e., the option value with investment opportunities in real assets, which is analogous to financial options, has been
incorporated into DCF [Trigeorgis 1996, Amram and Kulitilaka 1999]. One of the most crucial issues in these approaches to making the optimal investment plans is how to deal with future uncertainties and risks. Dynamic Strategic Planning (DSP) is the approach that takes into account future uncertainties and risks and insures managerial flexibility. It maximizes the expected net present value (NPV) of a project. In other words, it
minimizes the loss of NPV caused by a failure to choose the best strategy.
The Japanese government, however, has not systematically incorporated these project evaluation approaches into its decision-making process in public transportation
infrastructure development. In Japan, the public sector (either the national government or local governments) usually assumes the authority to develop and operate major
transportation infrastructures, such as roads, seaports, and airports, and there is no statute that requires the public sector to carry out an analysis of project efficiency, such as cost-benefit analysis. As a result, although private companies seriously examine project efficiency as a matter of course, this has not been the case with government projects. In
addition, Japanese government investment has been usually based on a single best forecast, and, consequently, has been vulnerable with respect to future uncertainties. Japan's Ministry of Transportation (MOT) has started to undertake cost-benefit analysis when investing in major transportation projects. It has also instituted re-evaluation
systems for ongoing projects. With this setup, MOT now hopes to ensure the efficiency of its investments. Although this arrangement seems to be the correct way to carry out efficient investment, MOT might fail in choosing the best strategy since it does not
This thesis analyzes both the current MOT system and DSP in investing in the transportation infrastructure in Japan. There are two major questions to be examined:
e Does DSP work better than the current system in terms of the efficiency of the
transportation infrastructure investment in Japan?
e Should the Japanese government incorporate DSP into the transportation
infrastructure investment?
This thesis contains five chapters and a conclusion. Chapter 1 introduces
criticisms of the government's inefficient investments in Japan and efforts to make them more efficient. Chapter 2 examines the uncertainties and risks in transportation
infrastructure investment, mainly using examples of Japanese transportation projects. Chapter 3 explains the concept and advantages of DSP and its project valuation methods, such as Decision Analysis, and Real Options. Chapter 4 is dedicated to a case study in which a container terminal development in Japan is evaluated by the DSP approach based on the cost-benefit analysis framework. After the analyses of the case study, Chapter 5 discusses issues in implementing DSP in Japan. The conclusion summarizes the findings of this thesis.
CHAPTER 1
CRITICISMS OF TRANSPORTATION INFRASTRUCTURE DEVELOPMENT SYSTEMS IN JAPAN AND EFFORTS TO MAKE THEM MORE EFFICIENT
The national government, mainly through either the Ministry of Transportation (MOT) or the Ministry of Construction (MOC), strongly controls transportation
infrastructure developments in Japan. Accordingly, the methods used by MOT or MOC to implement policy aimed at making its investments more efficient are crucial for the overall efficiency of transportation infrastructure investments in Japan. This chapter first introduces criticisms of inefficient infrastructure investments in Japan, and then
overviews Japanese transportation infrastructure development systems that might affect investment efficiency. Finally, this chapter examines efforts towards more efficient investments.
Criticism of Inefficient Investments
Today, the Japanese government faces criticism of its inefficient public works investments at both macro and project levels. When the national economy was growing rapidly, it was relatively easy to justify an investment because demand for the
infrastructure was expected to be sufficient soon, if not immediately. The growth of Japan's economy, however, has stagnated recently, and the national budget has been suffering from a huge deficit. Under such circumstances, inefficient investments in
Criticism at Macro Level
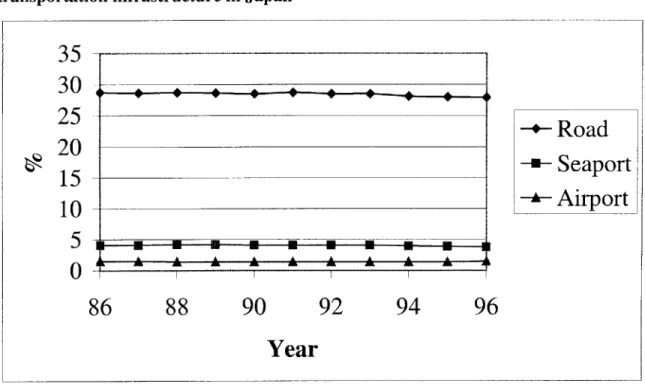
During the past decade, the portions of the national budget allocated to each public works sector in Japan have remained almost the same (Figure 1-1). On the basis of this rigid budget allocation alone, some opinion leaders doubt that the overall
efficiency of the government's investments is very high [Takemura 1996]. Such doubts have not remained purely a domestic matter. The U. S. journal Business Week, for example, has stated that years of wasteful public works spending have driven up Japan's gross debt level to 110 percent of the gross national product [Bremner 1999].
Criticism at Project Level
Some individual projects funded by the national government have been criticized as being oversized. Among these, the criticism of the Fukui Seaport Project is
particularly hard on MOT. Sumita reports that the local people are calling this "a fishing pond costing ten billion Yen" because the level of berth usage is only around ten percent of the projection [Sumita 1998].
Transportation Infrastructure Development Systems in Japan
While the private sector is very sensitive to the cost-revenue soundness of its investments, the public sector is conscious about the equity of distribution as well as maximizing social benefits. In addition to this inherent nature of the government investment that might reduce the investment efficiency in terms of cost-benefit, the
Figure 1-1: Portions of the national public works budget allocated to major transportation infrastructure in Japan
35
30
25
--Road
-=20
Seaport
~15 -U105--
Airport
5
10
86
88
90
92
94
96
Year
Source: Takemura (1996)established transportation infrastructure development systems in Japan might be "double-edged." That is to say, while the robust Japanese systems, such as the national
government permission for master plans and the determination of investment five-year plans, are useful for stable realization of projects, they might create undesirable
inflexibility in terms of investment efficiency.
Permission for Developments or Plans
Major transportation infrastructure developments usually must be authorized by the national government in the national economic plan, the national development master plan, and regional development master plans. Furthermore, in the case of airport
developments, for example, a developer must adhere to the procedures shown in Figure 1-2 in carrying out its development plan. In the case of seaport developments, a
developer must follow the procedures shown in Figure 1-3 in determining a seaport master plan. Usually, these procedures are rather time-consuming and burdensome, which might not only cause failure to develop facilities in a timely manner, but might also create a tendency to stick to the authorized plan regardless of changes in
circumstances.
Investment Five-year Plans
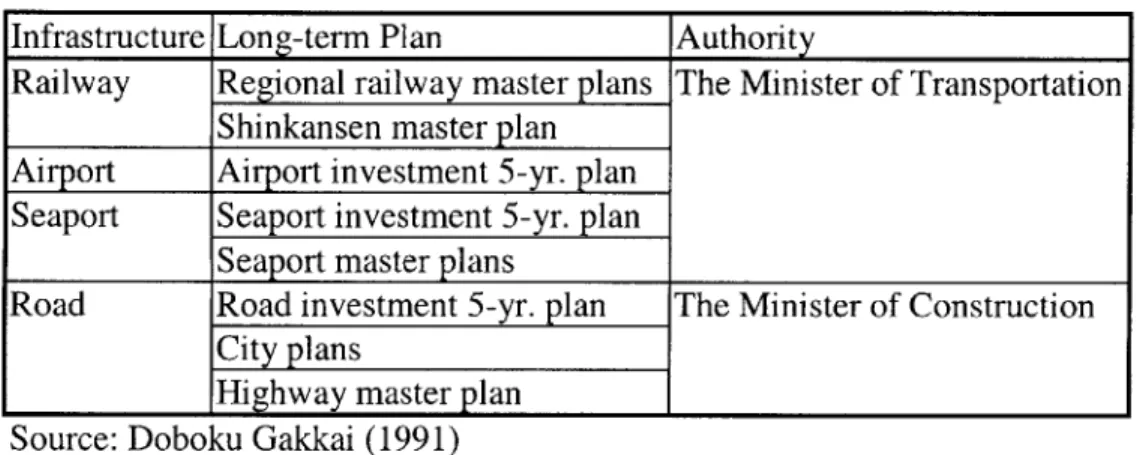
The national government determines long-term development plans for most transportation facilities (Table 1-1). For example, MOT creates the Seaport Investment
Figure 1-2: Procedures before developing an airport in Japan 1. Submission of application to develop an airport to the Minister
of Transportation
2. Notification of the public about the application by the Minister 3. Public hearing held by the Minister
4. Examination of the application by the Minister 5. Approval of the development by the Minister
6. Notification of the public about development by the Minister Source: Hirai (1984)
Figure 1-3: Procedures before authorizing a seaport master plan in Japan
1. Consultation on a plan by a Local Advisory Committee 2. Submission of the plan to the Minister of Transportation
3. Consultation on the plan by the Minister's Advisory Committee/ Examination of the plan by the Minister
4. Approval of the plan by the Minister
5. Notification of the public about the plan by the developer Source: Fujino and Kawasaki (1981)
for the projected five year period. Sometimes making a five-year plan is a statutory mandate as is the case with the Seaport Investment Five-year Plan (required by the Seaport Development Urgent Measure Law), and sometimes it is not. Although most of the current five-year investment plans are not completely inflexible, it is difficult to initiate projects that are not incorporated into the plan during the five year period. This is particularly true in cases of seaports and airports because five-year plans related to these facilities designate individual seaports and airports to be funded during the five year period. This might also create a tendency to stick to the plan, making it difficult to expand and/or abandon planned projects.
Subsidies by the National Government
Whether the national government is the developer or not, it usually gives a significant amount of subsidies and/or loans to developers. This gives the national government strong control over developers. Furthermore, once developers get the
subsidy, Article 18 of the Law Regarding Appropriate Enforcement of Subsidies, enacted in 1955, basically requires them to return all of this money if they abandon the project [Tokyo Horei 1997]. This might be one of the major reasons why it is very difficult for local governments to abandon projects even when the investment appears to be unwise. Consequently, local governments may have to stick to their original plans.
Efforts Towards More Efficient Investments
For roughly the past half-century, the investment in the transportation
infrastructure in Japan has been intended to accommodate rapidly increasing demand in this sector. During the periods when the national economy was growing along with demand for all types of transportation, the cost-benefit efficiency of projects was not systematically analyzed in initiating the investment, although the economic multiplier effect of the project had sometimes been studied. The investment decision was supposed to be made so as to accommodate future demand based on a deterministic scenario created by the government [Sumita 1998]. Today, criticisms, such as those mentioned above, have driven the national government to increase the efficiency of its investments.
Cost-Benefit Analysis
Because the press, politicians, opinion leaders, and others are criticizing the inefficiencies of public investments, each ministry in the national government has launched its own efforts to cope with this issue. In March 1997 MOT announced that it would start cost-benefit analysis for its major new investments. MOT checks whether the Cost-Benefit Ratio of major new project exceeds one and also evaluates the Net Present Value of the project. Table 1-2 introduces major projects, benefit components, cost components, benefit evaluation periods, and the discount rate MOT applies to the analysis. Although the Ministry has not made public its detailed analytical methods, a former MOT director-general H. Kayahara has said, "The concept of probabilities, such as the probability that the volume of cargo will double in ten years, has not been
incorporated into the analysis at all until now," implying that now MOT relies highly on a deterministic scenario in its analyses [Morisugi and Kayahara 1998].
Re-evaluation Systems for Public Works
In March 1998 MOT announced that it would start re-evaluation systems for its ongoing projects [1998b]. The Ministry will re-evaluate the effectiveness of a project five years after the budget appropriation is first authorized and apply cost-benefit analysis if necessary. As a result of the re-evaluation, MOT can change or abandon a project if warranted.
Table 1-1: Long-term development plans and their authority in Japan Infrastructure Long-term Plan Authority
Railway Regional railway master plans The Minister of Transportation Shinkansen master plan
Airport Airport investment 5-yr. plan Seaport Seaport investment 5-yr. plan
Seaport master plans
Road Road investment 5-yr. plan The Minister of Construction City plans
Highway master
plan
Source: Doboku Gakkai (1991)Table 1-2: Major projects and cost-benefit components Japan's Ministry of Transportation analyses
Project Railway New railway in recent developed town/
New underground rapid transit/ etc.
Airport New airport/
New runway (including expansion) Seaport New deep-water berth
Benefit quantified Reduced transportation cost/ Timesaving/ etc.
Cost quantified Construction cost/ Operation cost/ etc. Discount rate 4% per year
Benefit valuation period 30 - 50 years
CHAPTER 2
UNCERTAINTIES AND RISKS
IN TRANSPORTATION INFRASTRUCTURE INVESTMENT
The project evaluations made by Japan's Ministry of Transportation are based on a simple deterministic scenario. In the real world, however, transportation infrastructure investments face diverse uncertainties and risks. This chapter first presents cases in which there is the difference between forecasted demand and actual demand and then introduces those uncertainties and risks faced by the transportation infrastructure using a dichotomy: market uncertainties and project uncertainties.
Forecasted Demand and Actual Demand
It is very difficult to forecast future transportation demand accurately. In forecasting future transportation demand, usually many model specifications are
constructed and compared with each other in order to obtain the specification that has the most rational explanatory powers. Even a model that fits past data very well, however, does not guarantee the accurate prediction of actual demand in the future.
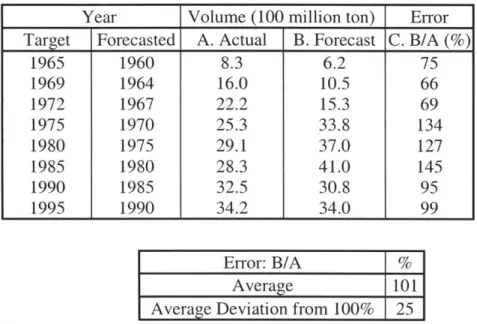
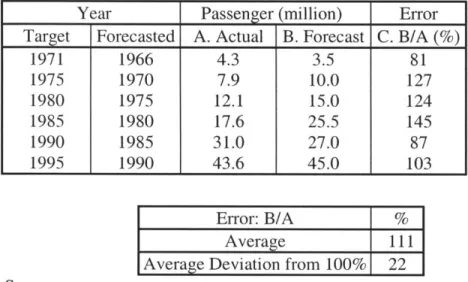
Table 2-1 shows the difference between the forecasted demand for seaport cargo throughout Japan and actual demand. Each forecast, except for the last two, contains an error that is not negligible. Table 2-2 compares the forecasts for international air
2-3 shows a similar comparison predicted ten years before the fact. As is the case with
seaport cargo, most forecasts contain errors that cannot be ignored. In addition, the longer the forecasting perspective becomes, the larger the error tends to be.
The difficulty of forecasting also exists for individual projects. For example, although the forecast predicted that Kansai International Airport would accommodate
157,000 aircraft in 1995 [Japan, Ministry of Transportation 1981c], the actual figure was 107,000, or about two-thirds of the forecast [Kansai International Airport Company 1999]. Table 2-4, showing the case of annual passengers at the Tokyo International Airport (so-called Haneda Airport), indicates a similar discrepancy between the predicted
and actual figures, an error that increases over a ten year span. The difficulty of
forecasting is a universal problem, i.e., not peculiar to Japan. Table 2-5 shows a case in the United States. All of this implies that developers must recognize the risks when they rely totally on a simple deterministic forecast.
Uncertainties in Transportation Infrastructure Investment
Many factors can create a disparity between actual demand and forecasted demand. In addition to risks relating to demand, an investment in transportation
infrastructure faces other types of risks, such as the increase of construction costs. Here,
the dichotomy of market uncertainties and project uncertainties is applied to transportation projects.
Table 2-1: Actual and forecasted demand for seaport cargo throughout Japan (5-year perspective)
Year Volume (100 million ton) Error Target Forecasted A. Actual B. Forecast C. B/A (%)
1965 1960 8.3 6.2 75 1969 1964 16.0 10.5 66 1972 1967 22.2 15.3 69 1975 1970 25.3 33.8 134 1980 1975 29.1 37.0 127 1985 1980 28.3 41.0 145 1990 1985 32.5 30.8 95 1995 1990 34.2 34.0 99 Sources: 1. Actual Data: Error: B/A % Average 101
Average Deviation from 100% 25 Japan, Ministry of Transportation (1998c)
2. Forecast: Japan, Ministry of Transportation (1991a, 1986a, 1981a, 1976a, 1971a, 1968, 1965, and 1961)
Note: Actual data use calendar year while forecasts use fiscal year.
Figure 2-1: Actual and forecasted demand for seaport cargo throughout Japan (5-year perspective) 450,000 - -400,000 350,000 300,000 250,000 200,000 150,000 100,000 50,000 0 1955 1960 1965 1970 1975 1980 1985 1990 1995 2000 Year -+- Actual U Forecast
Table 2-2: Actual and forecasted demand for international air passengers throughout Japan (5-year perspective)
Year Passenger (million) Error
Target Forecasted A. Actual B. Forecast C. B/A (%)
1971 1966 4.3 3.5 81 1975 1970 7.9 10.0 127 1980 1975 12.1 15.0 124 1985 1980 17.6 25.5 145 1990 1985 31.0 27.0 87 1995 1990 43.6 45.0 103 Error: B/A % Average 111
Average Deviation from 100% 22 Sources:
1. Actual Data: Japan, Ministry of Justice (1998)
2. Forecast: Japan, Ministry of Transportation (1991b, 1986b, 1967)
1981b, 1976b, 1971b, and
Figure 2-2: Actual and forecasted demand for international air passengers throughout Japan (5-year perspective)
Table 2-3: Actual and forecasted demand for international air passengers throughout Japan (10-year perspective)
Year Passenger (million) Error
Target Forecasted A. Actual B. Forecast C. B/A (%)
1980 1970 12.1 20.0 165 1985 1975 17.6 27.0 153 1990 1980 31.0 39.5 127 1995 1985 43.6 37.9 87 Error: B/A % Average 133
Average Deviation from 100% 40 Sources:
1. Actual Data: Japan, Ministry of Justice (1998)
2. Forecast: Japan, Ministry of Transportation (1986b, 1981b, 1976b, and 1971b)
Figure 2-3: Actual and forecasted demand for international air passengers throughout Japan (10-year perspective)
50,000,000 45,000,000 40,000,000 35,000,000 30,000,000 25,000,000 20,000,000 15,000,000 -10,000,000 5,000,000 0 1960 1965 1970 1975 1980 1985 1990 1995 2000 Year -+- Actual 0 Forecast
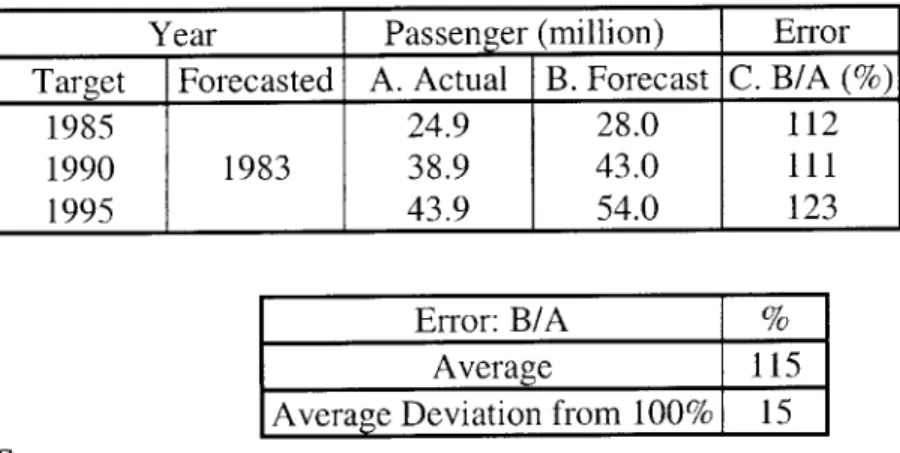
Table 2-4: Actual and forecasted demand for passengers at Haneda airport
Year Passenger (million) Error Target Forecasted A. Actual B. Forecast C. B/A (%)
1985 24.9 28.0 112
1990 1983 38.9 43.0 111
1995 43.9 54.0 123
Error: B/A %
Average 115
Average Deviation from 100% 15 Sources:
1. Actual Data: Japan, Ministry of Transportation (1998d) 2. Forecast: Japan, Ministry of Transportation (1983)
Table 2-5: Actual and forecasted demand for New England Region Airports
Planning Horizon Average Error Range of Errors
(years) (%) (%)
Five 23 64 to 196
Ten 41 58 to240
Fifteen 78 66 to 310
Market Uncertainties
Market uncertainties are those that affect overall market conditions with respect to a transportation development plan. Risks resulting from these uncertainties cannot be avoided.
In terms of cost and benefit, the success or failure of a transportation
infrastructure development depends mainly on the growth of demand. The growth of the corresponding market throughout Japan is supposed to significantly affect the demand growth for an individual project. The growth in the number of passengers throughout Japan, for example, may significantly affect the demand growth for an individual airport development project, and the growth in the volume of cargo throughout Japan may significantly affect the growth in demand for an individual seaport development project.
Apparently, there are many factors that affect overall national market growths. Below, four such factors are identified: GDP growth, technological innovations, contingent events, and currency markets.
* GDP growth
The national economic situation has a great impact on transportation demand. Usually, there is a strong correlation between GDP and transportation demand. Accordingly, in forecasting future transportation demand, GDP is often used as an explanatory variable. If GDP does not grow as expected, forecasts will tend to
overestimate actual demand. In periods during which GDP grew more than expected, the number of both national airport passengers and national seaport cargoes generally grew
more than forecasted. In contrast, during those periods in which GDP grew less than expected, the opposite was true (Table 2-6, and Figures 2-1, 2-2, and 2-3).
e Technological innovations
Apart from the economic situation, technological innovations sometimes drastically change the structure of transportation demand. The advent of air travel, for example, drastically decreased the need for international passengers to travel by sea. The emergence of container transportation systems also drastically decreased the volume of general bulk cargo.
* Contingent events
Contingent events sometimes significantly affect transportation demand. Two examples are illustrative: two oil crises, and the Gulf War. Oil crises of 1973 and 1979 seemed to have negative impacts on seaport cargo in Japan (Figure 2-1). In addition, the Gulf War of 1991 seemed to have a negative impact on international air travel.
* Currency markets
While a strong yen is supposed to increase imports and travelers going abroad, a weak yen is supposed to increase exports and travelers coming to Japan.
Table 2-6: Actual and planned GDP for Japan
Year GDP growth rate (%) Error Period Planned A. Actual B. Planned C. B/A (%)
1961-70 1961 10.1 7.2 71 1964-68 1964 10 8.1 81 1967-71 1967 9.9 8.2 83 1970-75 1970 5.5 10.6 193 1973-77 1973 3.6 9.4 261 1976-80 1976 4.4 6 136 1979-85 1979 3.7 5.7 154 1983-90 1979 4.3 4 93 1988-92 1988 4.2 3.75 89 Error: B/A % Average 129
Average Deviation from 100% 47 Sources:
1. Actual: Japan, Economic Planning Agency (1996) 2. Plan: Japan, Chiiki Seibi Kodan (1995)
Project Uncertainties
Project uncertainties are those that affect an individual project only. Investing in various projects can diversify the risks resulting from these uncertainties.
Apart from market uncertainties, each individual project faces various uncertainties both at its construction stage and at its operation stage.
1) Construction stage e Construction costs
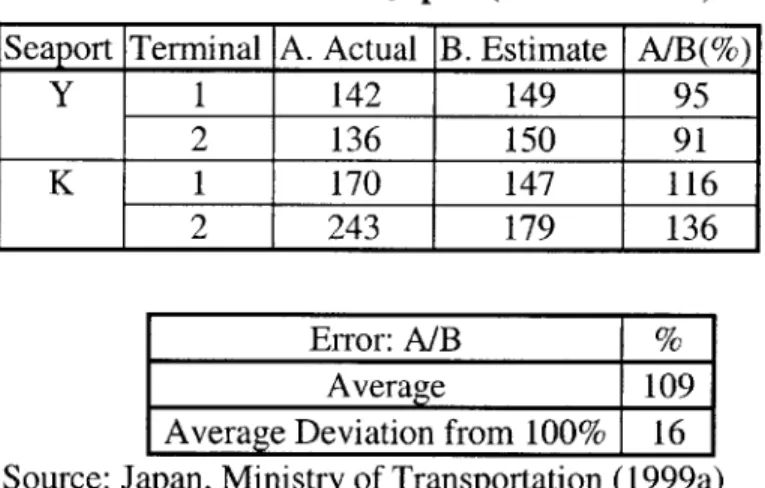
The most typical project risk in transportation infrastructure development may be the increase of construction costs. In the case of the Kansai International Airport, the estimated cost before the construction was around 1 trillion Yen, while the actual cost turned out to be about one and a half time this much [Gekkan Doyu Sha 1994]. Table 2-7
shows four examples of construction cost uncertainties in recent major container terminal developments in Japan.
0 Construction schedule
In addition to construction costs, a construction schedule also contains
uncertainty. For example, the inauguration of Kansai International Airport was delayed more than a year because of ground subsidence. In the case of Narita airport, the second runway construction has not been developed yet because of the difficulty in purchasing
Table 2-7: Estimate and actual cost of container terminal construction in Japan (unit: 108 Yen) Seaport Terminal A. Actual B. Estimate A/B(%)
Y 1 142 149 95 2 136 150 91 K 1 170 147 116 2 243 179 136 Error: A/B % Average 109
Average Deviation from 100% 16 Source: Japan, Ministry of Transportation (1999a)
the runway site, although the Japanese government has desired to do so for almost three decades [Koku Shinko Zaidan 1997].
2) Operation stage
As it has been mentioned in the section on market uncertainties, the success or failure of a transportation infrastructure development mainly depends on the growth in demand. Apart from the growth of demand in the national market as a whole, each individual project faces demand growth uncertainties specific to itself. In some projects, rates of demand growth might be greater than the rate of demand growth for the entire national market, and in some projects, they might be smaller.
There appear to be many factors that affect the growth in demand for an
individual project. Below, two factors are identified: regional socioeconomic conditions and the level of service accomplished by the transportation infrastructure. These two factors are somewhat interrelated.
Regional socioeconomic conditions
Hinterland conditions for transportation infrastructure to be developed are not homogeneous throughout Japan. In some regions, the rates of gross regional product (GRP) growth might be greater than the rate of GDP growth for the entire country. This might also be true for rates of population growth. These factors may create a deviation in
in a region may significantly affect the demand growth for a container terminal to be developed.
e The level of service
The level of service accomplished by an individual project, such as the frequency of services, is one of the key factors that determine the attractiveness of the transportation infrastructure developed. Even though a newly developed transportation infrastructure may have advantages over existing infrastructures in terms of access cost and access time for users in its potential hinterland, demand would not be realized if the level of service were low. Airports that have more frequent flights and more diverse destinations, for example, are likely to attract more passengers than those that do not. Seaports that have more frequent liner services and more diverse destinations attract more cargo than those that do not.
Although the level of service accomplished by a transportation infrastructure is not totally independent of the factors introduced in the section on regional socioeconomic conditions, the success of an airport or a seaport authority in port sales sometimes affects the result. For example, if the port authority succeeds well in port sales, it can capture a large portion of its potential hinterland passengers or cargoes, and vice versa.
CHAPTER 3
EVALUATING TRANSPORTATION INFRASTRUCTURE INVESTMENT USING DYNAMIC STRATEGIC PLANNING
This chapter presents the concept and advantages of Dynamic Strategic Planning (DSP) using the example of an airport investment. This simple example was arbitrarily created in order to explain the concept and advantages of DSP as well as the defects of Net Present Value (NPV) based on a deterministic scenario. This chapter also introduces two major Real Options valuation methods: the Black-Scholes equation and Monte-Carlo
simulation.
Imaginary project (Figures 3-1, 3-2, and 3-3)
e An airport authority (AA) is deciding on an investment strategy for an airport (AP).
" The AP master plan contains three identical runways.
e The construction cost of each runway is $500 million. The construction of a runway
takes AA only one year.
* If the demand for AP is high, medium, or low, respectively, AP provides the net benefit of $100 million, $50 million, or $25 million, respectively, for the first operation year. The three outcomes are equally plausible. The annual net benefit is supposed to increase 20%/year regardless of the net benefit of the first year.
* Because of the capacity, each runway can provide the net benefit of $100 million per year at most.
Figure 3-1: Assumptions of imaginary project
Discount rate 4%
Construction cost $500 million/RW Net Benefit
Growth rate 20% /year
High $100 million Initial net benefit Medium $50 million
Low $25 million
Maximum Benefit $100 million/year/RW
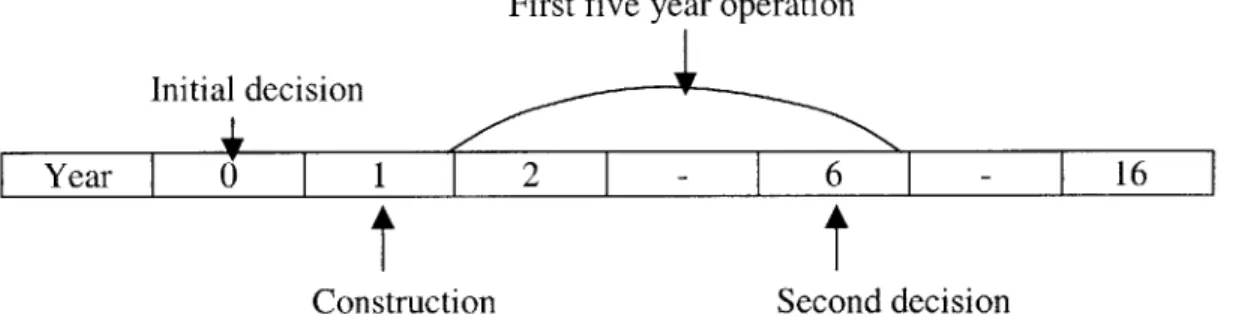
Figure 3-2: Schedule of imaginary project
First five year operation Initial decision
Year 0 1 2 - 6 - 16
ti t
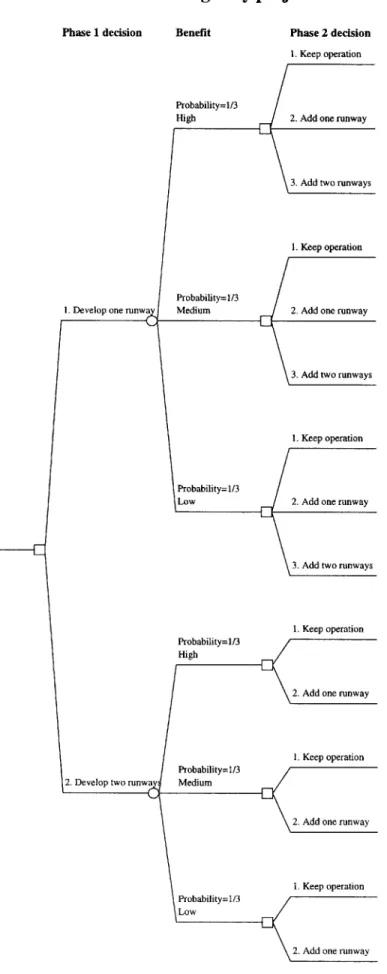
Figure 3-3: Decision structure of imaginary project
Phase 1 decision Benefit Phase 2 decision 1. Keep operation
" If AA first develops two runways, it will have the opportunity to add one runway after five years of operation. If AA first develops one runway, it will have the opportunity to add one runway or two runways after five years of operation.
" AA evaluates the project for 16 years (one year construction and 15 year operation) using a 4% discount rate.
NPV based on a deterministic scenario (simple NPV) The simple NPV is calculated as follows:
16 Benefitt - Costt
NPV = I
,=1 (1+0.04)t
Suppose AA totally relies on the medium scenario (deterministic scenario). The simple NPV of the development of two runways, $525 million, is greater than that of one runway, $471 million. Based on this deterministic scenario, AA would decide to start developing two runways (Figure 3-4).
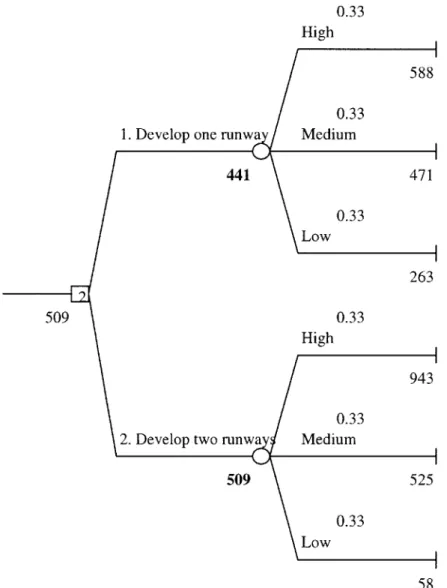
Expected NPV taking into account uncertainties (Base Expected NPV)
Even if AA's decision were based on the expected NPV taking into account uncertainties in the net benefit, AA still would decide to start developing two runways because the expected NPV of the two runway development, $509 million, is greater than that of the one runway development, $441 million (Figure 3-5). (In this thesis, Base
Expected NPV is defined as the expected NPV of an initial investment without
Figure 3-4: Simple NPV based on a deterministic scenario (unit: $million)
1. Develop one runway
471
525
2Develop two runways 525
Figure 3-5: Expected NPV taking into account uncertainties (Base Expected NPV, unit: $million)
Benefit
0.33
High
Here, the expected NPV of the initial investment (Base Expected NPV) is smaller than that of the deterministic scenario. This is not a universal property. This happens because of asymmetric outcomes around the medium outcome.
Dynanic Strategic Planning
DSP is the approach that takes into account future uncertainties and risks and insures managerial flexibility. Applying DSP to the project evaluation, neither of the two NPV valuations is correct. AA should recognize the Real Options value of adding one or two runways. If AA first develops two runways and the benefit is high, for example, it
should add one runway after the five years of operation because the resulting NPV, $1,127 million, is greater than the NPV without adding it, $943 million; if the benefit is medium or low, however, it should not add one runway (Figure 3-6). Assuming each outcome occurs equally, the option value of having the other runway development project is $61 million (Table 3-1: Initial decision 2).
The essence of DSP is evaluating multiple stage decisions. Here, there are decision opportunities at two stages: the initial decision and the decision at the end of the five years of operation. Taking into account the option value, the Total NPV of initially developing one runway, $608 million, is greater than that of initially developing two runways, $570 million. This implies that, if the objective function of AA is to maximize the NPV, DSP increases the value of the project by $38 million.
Figure 3-6: NPV based on Dynamic Strategic Planning (unit: $million)
Phase 1 decision Benefit Phase 2 decision 1. Keep operation
588 0.33
High 2. Add one runway
957 773
3. Add two runways 957
1. Keep operation 471
0.33
1. Develop one runwa Medium 1 2. Add one runway
608 605 605
3. Add two runways 562
1. Keep operation 263 0.33
Low 2. Add one runway
263 159
608 3. Add two runways
-117
1. Keep operation 0.33
High 943
1,127
2. Add one runway 1,127
1. Keep operation 0.33
2. Develop two runwa Medium 525
570 25
2.Add one runway 482
1. Keep operation 0.33
Low 58
58
Table 3-1: Total NPV Including Option Value (unit: $million) Decision taken in second period
Initial decision: 1. Develop one runway
Benefit Outcome Second decision Option value
Keep Operation Add one runway Add two runways
High 588 773 957 369
Medium 471 605 562 133
Low 263 159 -117 0
Total NPV, $608 million = Base Expected NPV*, $441 million (=(588+471+263)/3)
+ Option Value, $167 million (=(369+133+0)/3) *Base Expected NPV: Expected NPV of Phase 1 investment without Phase 2
investment
Initial decision: 2. Develop two runways
Benefit Outcome Second decision Option value Keep Operation Add one runway
High 943 1127 184
Medium 525 482 0
Low 58 -218 0
Total NPV, $570 million = Base Expected NPV, $509 million (=(943+525+58)/3)
Option calculator
In this example, the option value is calculated based on three discrete outcomes
that are equally plausible regardless of whether AA invests in one runway or two
runways using decision tree analysis. In the real evaluation, however, the situation might be more complicated. Amram and Kulatilaka introduce the following three general solution methods of Real Options: PDE (Partial Difference Equation), Dynamic
Programming, and Simulations (Figure 3-7) [Amram and Kulatilaka 1999]. This chapter introduces the Black-Scholes equation (PDE) and Monte-Carlo simulation that become useful tools for the case study in the next chapter.
PDE/Black-Scholes equation e Black-Scholes equation
The PDE approach solves a partial differential equation that equates the change in option value with the change in the value of the tracking portfolio [Amram and
Kulatilaka 1999]. Among PDE approaches the Black-Scholes equation is popular
because it provides a simple solution and a quick answer when appropriate. The equation
is:
V = N(dl)*A - N(d2)*X*exp(-rf*T) Here,
V = Current value of call option A = Current value of underlying asset X = Cost of investment
T = Time to expiration
N(dl) and N(d2) are the values of the normal distribution at dl and d2 dl = [ln(A/X) + (r + 0.5*&2)*T]/(a*T 5)
d2 = d1 - *T0 5
G = Volatility of the underlying asset
The Black-Scholes equation is applicable to this airport development example because this project can be seen as a project having a European call option that can be exercised at the end of year six (expansion option). Applying the Black-Scholes equation to the example, each variable is defined as follows:
A = Expected value of additional net benefit flow by adding one or two runways in the year of second decision, the year six (Current value of underlying asset). Precisely,
A 16 16t- A enefitt
t=8 (1+ 0.04)t6
Here,
ABenefit Net benefit with runway addition -Net benefit without runway addition X = Construction cost of one or two runways
rf = 4% (assumption)
T = 6 years (one year for construction of the initially invested runway and five years of operation)
Figure 3-7: Solution Methods and Option Calculators Identify and Define Real Options
Establish the Mathematical Representation
Choose Solution Method/Option Calculator
PDE Dynamic Programming
(e.g. Black-Scholes) (Binomial Model)
Simulations
(Monte Carlo Method) Source: Amram and Kulatilaka (1999)
e Option value in decision 2
Because of the ease of explanation, the option value in decision 2 is calculated first. Here, three cases defined above (high, medium, and low net benefit) are used in valuing the underlying asset (additional net benefit by adding a runway on two runway airfield) and determining its volatility. When AA initially invests in two runways, the expected value of three cases can be seen as the current value of the underlying asset (Table 3-2). The value of each case (high, medium, or low) can be seen as a value that the underlying asset can have at the year six. Then the ratio of each value to the expected value is calculated. Standard deviation of the distribution of natural log of these ratios is assumed as six-year volatility. Annual volatility is obtained by dividing it by six.
Then, using necessary information as input of the Black-Scholes equation, the option value of adding a runway on two runway airfield is obtained (Table 3-3).
* Option value in decision 1
The option value of two additional runways when one runway is initially
developed is the sum of the option value of adding a runway on one runway airfield and the option value of adding a runway on two runway airfield (the latter value is calculated above). The former value is calculated as the same way of the latter (Table 3-4, and 3-5). It should be noted that this value is different from the option value of adding two runways on one runway airfield because AA does not have to simultaneously add two runways always. Thus, the option value of one additional runway when two runways are initially developed (decision 2) is $81 million, and that of one or two additional runways
million and $81 million as explained. Both are similar to values estimated by the decision tree analysis (Table 3-6).
Simulation/Monte-Carlo Method
The simulation approach averages the value of the optimal strategy at the decision date for thousands of possible outcomes. (A representation of a system at a particular point in time is usually referred as a Monte-Carlo simulation [Winston 1994].) In this method, the optimal investment strategy at the end of each path is determined and the payoff is calculated. The current value of the option is found by averaging the payoffs and then discounting the average back to the present. This method can handle many aspects of real world applications, including complicated decision rules and complex relationships between the option value and the underlying asset [Amram and Kulatilaka
1999]. One of difficulties with Monte-Carlo simulation is specification of the probabilities for different results for each of the variables [Zerbe and Dively 1994].
Table 3-2: Volatility of underlying (adding a runway on two runway airfield) Asset value ($million) Ratio to Expected value Ln (Ratio)
Expected 424 Low 132 0.311 -1.169 Medium 426 1.006 0.006 High 714 1.683 0.521 Volatility (6 yrs.) 86.6% Annual Volatility 14.4%
Table 3-3: Option value of adding a runway on two runway airfield
A $424M X $481M rf 0.04 T 6 yrs. o 14.4% dl N(dl) d2 N(d2) 0.486 0.687 0.133 0.553 Call Value $81M
Table 3-4: Volatility of underlying (adding a runway on one runway airfield) Case Asset value ($million) Ratio to Expected value Ln (Ratio)
Expected
508 Low 159 0.313 -1.161 Medium 650 1.279 0.246 High 715 1.408 0.342 Volatility (6 yrs.) 84.1% Annual Volatility 14.0%Table 3-5: Option value on one runway airfield
A $508M X $481M rf 0.04 T 6 yrs. a 14.0% of adding a runway dl N(dl) d2 N(d2) 1.016 0.845 0.673 0.749
Table 3-6: Comparison of option values by two methods (unit: $million)
Decision Option Value
Decision Tree Black-Scholes
1 167 226
2 61 81
CHAPTER 4
CASE STUDY: EVALUATING A CONTAINER TERMINAL DEVELOPMENT IN JAPAN
This case study analyzes an actual container terminal development project in Japan. The objective is to construct a model helpful to Japan's Ministry of
Transportation (MOT) in evaluating projects using the Dynamic Strategic Planning (DSP) approach. Recognizing uncertainties and risks in projects and insuring decision flexibility, MOT will be able systematically to find an optimal investment strategy in terms of maximizing the Net Present Value (NPV) of a project. After the valuation of case study, this chapter discusses what the government should consider in order to effectively use DSP.
Presentation of the project for case study (Figures 4-1, and 4-2)
The project is to develop container berths in seaport A located in prefecture B, which had no container berths. The seaport master plan was officially authorized in 1992 (Year 1). The plan was to develop a -10m berth and two -14m berths. In Year 1, the port authority of Port A and MOT jointly started constructing a -10m berth and one of the two -14m berths (Phase 1). (This means that major decisions, such as the details of the budget, were made in 1991 [Year 0].) After five years of construction, at the end of
1996, the two berths were put into year around operation. There is no plan to start constructing the other -14m berth (Phase 2) now.
Figure 4-1: Simplified configuration of the project Berth 1 Depth -14m Length Berth 2 Depth -14m 280m Length Berth 3 Depth -10m 280m Length 170m
Container Terminal in Port A
Phase 1 (actual case)
Figure 4-2: Schedule of the project (Phase 1)
Decision made Inauguration
Year
0
- 6-First development started. Full operation started. Phase 2
Case study model and NPV valuation
Step 1. Construct Cost-Benefit Model Framework of Model
Figure 4-3 illustrates the basic structure of the cost-benefit analysis. This model is the basis for calculating the Net Present Value (NPV) for both the current MOT valuation (conventional cost-benefit analysis) and the proposed DSP valuation. Appendix 1 gives detailed explanations of the model.
Horizon of analysis
The benefit valuation period is set as 30 years because MOT uses this for container terminal development projects. Thus the total analysis period, including the construction stage, is 35 years.
Simple NPV based on a deterministic scenario (Current MOT's approach)
The NPV only for Phase 1 (without Phase 2 investment) is calculated based on a deterministic scenario. (Here, medium cases are used as the deterministic scenario for all uncertainties.) This is the conventional cost-benefit analysis that MOT now basically uses in evaluating projects. The resulting NPV for this phase 1 is positive, 10,185 million Yen, so this investment is justifiable by the current MOT criterion (Appendix1: Table Al-5).
Actually, under current circumstance, MOT decides what scenario to use for the deterministic case. While MOT carries out sensitivity analyses to deal with future uncertainties and risks, there is no guarantee that these systematically lead MOT to optimal investment strategies.
Figure 4-3: Framework of the Cost-Benefit Model Cost Model Construction cost O eration cost Demand Growth Benefit Model
Transportation cost savings Transportation time savings Salvage value of facilities
Net benefit in each year Discount rate Sum over periods IeN present value of project I
Step 2. Identify uncertainties and risks Market uncertainty
The growth in demand for container cargo throughout Japan was chosen here to represent a market uncertainty. It is assumed that Port A's potential hinterland demand growth will be the same as the national demand growth. Using the latest ten year data throughout Japan, the average growth rate of the container cargo market is 5.9%/year (the medium case), with the standard deviation of 2.4%/year growth rate (Table 4-1 and Appendix 2-2).
Project uncertainty
* Construction stage
Construction cost is one of the major sources of project uncertainties. Here, using the data in Table 2-7 and assuming that the ratio of actual to estimated cost is
lognormally distributed, the Bracket-Median Method gives three discrete percentages of actual to estimated cost (high case: 129%; medium case: 108%; low case: 90%) [Neely
1998]. Each case has equal probability (Appendix 2-1). The original data obtained are assumed as being for a medium-cost case.
* Operation stage
The port's market share in the potential hinterland (the ratio of the container volume handled at the terminal to the total in the hinterland) was chosen to represent a project uncertainty at the operation stage. Whether the port authority succeeds in port sales or not may affect the share the port acquires. Observations of two similar seaport