Dynamics of the Human Head and Torso during Activities that Require
Stable Vision
by Edgar Torres
SUBMITTED TO THE DEPARTMENT OF MECHANICAL ENGINEERING IN PARTIAL FULFILLMENT OF THE REQUIREMENTS FOR THE DEGREE OF
BACHELOR OF SCIENCE AT THE
MASSACHUSETTS INSTITUTE OF TECHNOLOGY
JUNE 2007
@2007 Edgar Torres. All rights reserved.
The author hereby grants to MIT permission to reproduce and to distribute publicly paper and electronic copies of this thesis document in whole or in part
in any medium now known or hereafter created. '" 7
Signature of Author: ....
I A
/
, /-
-b~lpartment-of Mechanical Engineering May 11, 2007
Certified by: ." / Lynette Jones
Principal Research Scientist, MIT Bioinstrumentation Lab Thesis Co-Supervisor •€~ -. Certified by:
1'
Accepted by:/
James Tangorra
....octoralAssociate,MIT Bioinstrumentation Lab -ThesisCo-Supervisor
N~J
John H. Lienhard VProfessor of Mechanical Engineering Chairman, Undergraduate Thesis Committee
ARGHrES
Y
iMASSACHUSE I NS
T
E
OFTECHNOLOGYJUN 21 2007
ILIBRARIES
.go-Si•:nature of Author: C-1 Ill,/-Dynamics of the Human Head and Torso during Activities that Require
Stable Vision
by Edgar Torres
Submitted to the Department of Mechanical Engineering on May 11, 2007 in Partial Fulfillment of the Requirements for the Degree of Bachelor of Science in
Mechanical Engineering ABSTRACT
The dynamics of the head and torso during activities that require clear vision is a topic that has previously been studied. These studies have examined the relationships between the angular velocities of the head in pitch and yaw in activities that either require clear vision or do not. However, many of these studies have been performed in artificial settings and so have required the subject to perform uncommon activities. The present study attempts to overcome the limitations of studying head and torso dynamics in artificial settings and determine whether the relationships found in previous studies apply during more natural activities where subjects move freely and track moving targets. Equipment was developed to measure the movements of the head and torso. This equipment used several different sensors to measure both the rotational velocities and linear accelerations of all degrees of freedom for both the head and torso. Several experiments were conducted using this equipment with subjects who were required to catch a ball. The subjects in this experiment walked with no visual task portion, ran with no visual task, and also ran while trying to catch a ball. It was found that during these activities, the yaw of the head was stabilized when clear vision was required. The pitch of the head however, became less stable when completing activities that required clear vision. These findings are consistent with previous studies in the field of head and torso dynamics.
Thesis Supervisor: Dr. James Tangorra Title: Post-Doctoral Associate
Table of Contents
1 Introduction ... 4
2 Apparatus, Procedures, and Discussion...8
2.1 Two-Axis sensors... ... ... 8
2.1.1 Equipment...8
2.1.2 Procedure... 13
2.1.3 Improvem ents to Equipm ent and Protocol...14
2.2 Six-Axis sensors... ... 17
2.2.1 Equipment...18
2.2.2 The Next Step...22
2.3 The All-Axis Sensor System ... 23
2.3.1 Equipment...23
2.3.2 Com m unicating with the Sensors ... 27
2.3.3 Procedure...28
3 Results ... 32
3.1 Two Axis Sensor Experiments...32
3.2 All-Axis Sensor Experiments...38
4 Discussion ... 42
4.1 Hardware... ... 42
4.2 Testing Protocol...42
4.3 Data... ... 43
1. Introduction
There are several reasons why human head and torso dynamics are a topic of interest for research. One very important reason for studying human head and torso dynamics is that this research will aid in understanding the human vestibular system. The human vestibular system, also known as the balance system, is a sensory system that is used to determine the position and movement of the head. It consists of several small organs in the inner ear that are stimulated when the head moves. Because the vestibular system is able to sense the position and movement of the head, the vestibular system is used in correcting for head and eye movements in order to maintain clear vision. By studying the dynamics of the head and torso, the burdens placed on the human vestibular system can be better understood. More specifically, studying head and torso dynamics can help show what kind of velocities and accelerations the head experiences in correcting for the displacement effects of locomotion.
Millions of people throughout the world suffer from vestibular system
dysfunction which is manifested in some sort of balance disorder. According to some estimates, over 90 million Americans, aged 17 or older, experience a dizziness or balance disorder (Task Force on the National Strategic Research Plan, 1989). One survey
concluded that "in a sample of persons age 65-75, one-third reported that dizziness and
imbalance degraded the quality of their lives" (Task Force on the National Strategic Research Plan, 1989). With one third of all older Americans' lives being affected by balance disorders, it is important to better understand human head and neck dynamics.
Another motivation for studying human head and neck motion is to try to get a fuller understanding of the dynamics in natural settings where subjects are free to move and track a moving target. Previous studies of human head and neck dynamics have been conducted in laboratory settings. One study looked at the effect of different walking speeds on head and body movements (Hiraski, 1999). In this study, subjects walked at different velocities ranging from 0.6 to 2.2 m/s. The findings indicated that the rotational velocities of the head and the trunk and the rotational velocity of the head relative to the trunk all increased as the walking velocities increased. Other studies have measured the head and trunk dynamics during different visual tasks. They included such tasks as
walking naturally, walking while focusing on earth fixed targets, walking while focusing on head-fixed targets, walking in darkness, hopping, etc. (Cromwell, 2004; Pozzo, 1990). These studies indicate that the head tends to be stabilized more when focusing on earth-fixed targets and that subjects tend to reduce velocity and cadence when completing more challenging visual tasks.
These studies have advanced our knowledge of human head and trunk dynamics. However, the findings are somewhat limited due to the conditions under which these experiments were conducted. The first limiting factor is that these studies focused on only a few of the degrees of freedom of the head and trunk, whereas the head and trunk each have six degrees of freedom. There are three rotational and three linear degrees of freedom. Figure 1 shows the 6 degrees of freedom and helps illustrate the naming conventions used in this study.
7-Ax°. .sii Yon
offreedom. (b) Rotational degrees offreedom.
The forward and backward y-axis movements are anterior and posterior movements in
the sagittal plane, respectively. The up and down z-axis movements are superior and
inferior movements in the sagittal plane, respectively. The left and right x-axismovements are lateral movements in the transverse plane. Pitch is rotation in the sagittal
(a) (b)
planFigure 1: This illustrotation inshows of freedom. (b) Rotational degrees of freedom.the transverse plane and roll is rotation inof 6 degrees ofcfreedom. (a) Linear degreesthe
The forward and backward y-axis movements are anterior and posterior movements in the sagittal plane, respectively. The up and down z-axis movements are superior and inferior movements in the sagittal plane, respectively. The left and right x-axis
movements are lateral movements in the transverse plane. Pitch is rotation in the sagittal plane, yaw is rotation in the transverse plane and roll is rotation in the coronal plane.
Most studies of head and trunk dynamics have focused on movement in only the y-axis and in pitch and subjects were limited to movements in only these two axes. This constraint on movement is related to another limiting factor; many previous studies have required that the subjects perform activities that are unusual. For example, some of the
locomotive activities include hopping or walking in place, walking on a treadmill, walking with eyes closed, walking in the darkness, and standing on rocking platforms (Bullock. 2004; Cromwell, 2001; Pozzo, 1995). Also, the subjects were asked to perform unusual visual tasks such as focusing on a cup of water they were holding in one hand while balancing on one leg, focusing on targets placed on a wall, and focusing on targets attached to their heads (Pozzo, 1995; Cromwell, 2004). These conditions are not
encountered frequently during everyday activities. Although some important conclusions have been drawn from these studies, it is difficult to apply the findings from these studies to more natural everyday movements.
One of the factors that has limited previous experiments on human head and torso dynamics is the equipment used to collect the data. In most of the experiments, video-based motion analysis was used. In this method of analysis, subjects are fitted with reflective markers and they are then filmed throughout the experiment. After the experiment, the videos are analyzed and the position of the markers is determined. The marker positions can then be used to find the position of any part of the body at any given time which can be used to determine the dynamics of the head and the torso. Although this method of data collection does provide accurate measurements, it does not
necessarily give the subject much freedom of movement as the subject is confined to a small range of travel. In order to collect data accurately, the target must stay within the range of the camera. This restricted range means that the experiments are often limited in
terms of locomotion. The subjects must walk on a treadmill, walk in place, or walk within a small space. During natural movements, people can move without these constrictions and so it is important to devise a method of collecting data that does not entail these constraints.
The research conducted for this thesis, which built on the work done in a previous thesis (Bates, 2006), focused on the head and torso dynamics during tasks that require
stable vision. The experiments conducted attempted to overcome many of the limitations that were encountered in previous research. In order to do this a new data collection system was developed and implemented. Instead of using the video-based motion detectors that have been used in previous research on head and neck dynamics, accelerometers and gyroscopes were used to measure the accelerations and rotational
velocities, respectively, of the head and torso. By using these types of sensors, several limitations that result from using video recordings were eliminated. Unlike the video based system, the subject is not limited to travel within the view of the camera. Because of this, the problem of atypical forms of locomotion was eliminated. Instead of having test subjects walk in place, walk on a treadmill or walk within a short space, subjects were now free to move as they pleased. The subjects could choose their pace and the path they took. In addition, the distance the subjects could travel was not limited to the area in front of the camera. The subject could potentially go anywhere with this
equipment.
Because the sensor system does not place limitations on the movement of the subject, the experiments conducted for this thesis were not restricted to using artificial protocols such as walking on a treadmill or walking in place. Instead, more natural methods of locomotion could be used. By using these more natural movements, it was anticipated that the true dynamics of the head and torso during actions that require clear vision could be determined.
2. Apparatus, Procedures, and Discussion
In order to measure the dynamics of the head and torso, equipment had to be built and a testing protocol developed. A sensor system was developed to measure the
dynamics of the head and torso, and a testing protocol was formulated for subjects. For these experiments, the action chosen to represent more natural movements was running to catch a softball and throwing a softball and returning to the home position. The
equipment required several iterations and a couple of testing protocols were developed.
2.1 Two-Axis Sensors
The first iteration of equipment, known as the two-axis sensors, was designed to measure the pitch and yaw of both the head and torso. The two-axis sensors did not measure the motion of four of the six axes of motion for both the head and torso. Neither the linear axes of motion nor the roll of the head and torso were measured. Despite this lack of data on the other axes, the two-axis equipment did provide a good first
approximation of the dynamics of both the head and trunk during actions that required clear vision.
2.1.1 Equipment
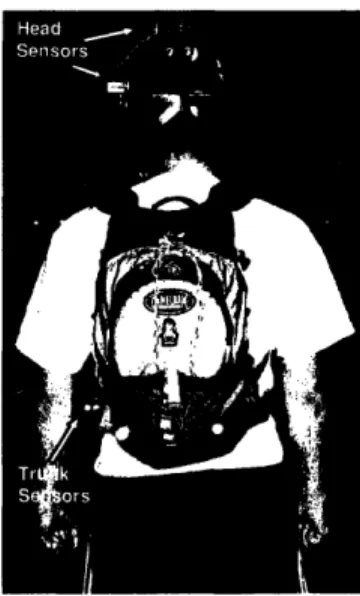
The first iteration of equipment was developed and built by Warren Bates (2006) and consisted of three elements. This included sensors that measured the pitch and yaw for the head and were mounted on a helmet. The second element was a torso box that contained sensors measuring pitch and yaw which was strapped onto the subject's chest. The final element was a backpack which contained the data acquisition system. These three elements are shown in Figure 2.
Figure 2: The configuration of all of the equipment for the first iteration. For the testing, the torso box was moved to the user's chest. (Bates, 2006)
The sensors used in this iteration were Analog Devices iMEMS® gyroscopes (ADXRS300, Norwood, MA). These gyroscopes were chosen because they best met the requirements for conducting the experiments. The first consideration for choosing the correct sensor was size. The iMEMS® gyroscopes have dimensions of 22.86 mm by 7.62 mm. The second consideration was the range of angular velocity that needed to be measured. According to previous research on head dynamics, the maximum angular velocity of the head is less than 1400/s (Pozzo, 1990). The iMEMs® gyroscopes can measure angular velocities from -300o/s to 300'/s, which is approximately double the required range. In addition, all of the filtering required was done on the chip itself which made this chip a good choice for this first iteration. This sensor is shown in Figure 3.
Figure 3: This is the ADXRS300 sensor from Analog devices. It is pictured here on an evaluation board
with a 5 V voltage regulator. (Bates, 2006)
The helmet used was a Petzl rock climbing helmet (Ecrin Roc, Clearfield, UT). This helmet was chosen because it can be adjusted to fit a wide range of adults, it is possible to mount objects on it because of the hard shell and it is light, with a mass of
0.475 kg. Attached to the helmet were three 3 mm thick acrylic boxes. Two of acrylic
boxes were sensor boxes and the third one was a junction box. The two sensor boxes each contained a gyroscope and a voltage regulator which gave the sensors the required 5V needed for proper operation. These acrylic boxes were mounted on the top and left side (from the subject's perspective) of the helmet. The sensor boxes were placed in those locations in order to measure the pitch and yaw of the head. Special care was needed to ensure that these sensors were indeed mounted perpendicularly to the axis which they measured. The junction box was mounted to the back of the helmet. The junction box was connected to both of the boxes containing gyroscopes. The junction box also had two BNC cable connections that were used to send the signals from the
gyroscopes to the data acquisition system in the backpack. There were also plug connectors that connected to the battery pack in the backpack (Figure 4).
Figure 4: The helmet with all three acrylic boxes qttached to it. On the right side of the picture is the junction box. The sensor boxes are in ite foreground and on top of the helmet.
The torso box is an acrylic box which contains two gyroscopes that can be used to measure the pitch and yaw of the torso. In addition, the torso box also contains a voltage
regulator which gives each gyroscope the required 5 V needed for proper operation. Like
the junction box, the torso box also has two BNC cable connections and plug connectors which were used to transmit the signals from the sensors to the data acquisition system and battery pack, respectively. The torso box was attached to the torso by strapping it to
the subject using a nylon strap (Figure 5).
The backpack contained all of the items necessary for supplying power to the sensors, and for running the data acquisition system. It was decided that it would be better to have subjects carry all of the data acquisition equipment on them so that they would not be tethered. One of the items contained in the backpack was four AA
batteries which provided the power source for all of the iMEMS® gyroscopes. The other item in the backpack was a shielded I/O connector block (National Instruments, SCB-68, Austin, TX) (Figure 6) All of the signals from the sensors were sent to this system.
(a) (b)
Figure 6: (a) The internal wiring of the connector block. The BNC cables coming from the junction box and the torso box are converted into regular wire in order to connect to the channels. (b) The
connector block when it is closed. Also pictured is the NI DAQCard-6063 (Bates, 2006)
The BNC cables from the junction box and the torso box were all connected to the connector block. The final item in the backpack was a tablet PC from Motion Computing (M 1200, Austin, TX). A tablet PC was chosen because unlike a laptop computer which would stop running if closed, a tablet PC can function when left in a backpack. The connector block was connected to the PC through a NI DAQCard-6063 (Austin, TX) which was placed in the computer's PCMI slot. The PC collected the data from the connector block using LabView software from National Instruments. This program ran a virtual instrument (VI) that takes the voltages from the sensors and converts them into angular velocities.
2.1.2 Procedure
Experiments were conducted on ten subjects. The subjects were all healthy, reported no previous occurrences of balance disorders, and were between the ages of 19 and 23. The subjects all signed consent forms prior to testing.
All of the subjects followed the same testing protocol. First, the experiment was explained to the subject. After confirming that the subject knew what was expected of him or her, the subject was outfitted with the equipment. The helmet, the nylon strap around the torso, and the backpack were all adjusted to ensure that they fit snugly on the subject. Next, the torso box and the junction box on the helmet were connected to the connector board using the BNC cable connectors. The computer was then placed in the backpack and the compartment was zippered up. The subject was then instructed to stand in a designated home spot. The experimenter also went to a designated thrower spot. The home spot and the throwing spot were approximately 6 m apart. The experiment began as soon as the delay on the VI ended. At that time the subject and experimenter were each at their respective spots facing each other. Subjects were instructed not to move while in the home position until they received the appropriate signal.
In this experiment, the subjects were thrown a softball, they ran over and
attempted to catch the softball, and then threw the softball back to the experimenter. This was defined as a throw cycle. Each throw cycle lasted 20 seconds. The cycle started when the experimenter called out the throw he was about to make. There were a total of four possible throws he could make. The experimenter would either call out "roll right (or left)" to indicate that the ball was being rolled on the ground to the subject's right (or left) or he would call out "throw right (or left)" to indicate that the ball was thrown as a "pop up" the subject's right (or left). The throws were all within 10 meters to the left or right from the home position. As soon as the experimenter threw the ball, the subject ran to try to catch the ball. The subject was instructed to stay in the spot where he or she had caught or dropped the ball and face the experimenter. The subject maintained this position until ten seconds had elapsed from the start of the throw cycle. If the subject caught the ball, the experimenter told the subject to throw the ball back to the
experimenter and to go back to the home position. If the subject did not catch the ball, the experimenter still told the subject to mimic throwing the ball back. The subject then
went back to the home position. The subject mimicked throwing the ball to ensure that a consistent protocol was followed for all subjects. Once the subjects returned to the home position, they stood still and faced the experimenter. This position was maintained until the next throw cycle began.
For this experiment, the control condition was running back to the home position after throwing the ball. The experimental condition was maintaining visual focus on the ball while running over to catch it.
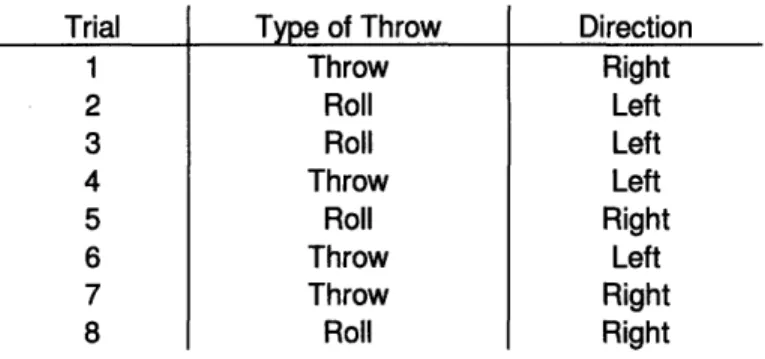
Trial 1 2 3 4 5 6 7 8 Type of Throw Throw Roll Roll Throw Roll Throw Throw Roll Direction Right Left Left Left Right Left Right Right
Table 1: The pattern that was used and repeated for the first experiment.
The eight throws shown in table 1 were repeated four times in order to reach the 32 throw cycles required for the experiment. Subjects were not told what the sequence of throws was nor were they told that it would be a repeating pattern. The subject was told that all of the throws were randomly chosen.
The subject was instructed to stay at the home position and stand still once all 32 throw cycles were performed. The experimenter then went over to the subject as quickly as possible and removed the computer from the backpack.
2.1.3 Improvements to Equipment and Protocol
The data gathered with this equipment and experimental procedure were informative, but some fundamental problems were pinpointed from this equipment and experimental protocol. There were three main areas of the experiment that needed
improvement. One issue was that subjects were not given any instructions as to what was expected of them in terms of locomotion. One of the reasons for this was to give the
subjects the ability to move in a more natural fashion. That did not mean, however, that subjects should be given the freedom to move at whatever pace and cadence they wanted when catching the balls. It was anticipated that the subjects would have picked a pace
and cadence at the beginning of the experiment and used that consistently throughout the experiment. During the experiments, subjects ran to the ball at whatever pace they
wanted. Sometimes they ran quickly, other times they jogged, and on other trials they walked over to catch the ball. Ideally, the subject should have run at the same pace every time to catch the ball so that motions would be consistent and any differences could be
attributed to the presence of a visual target. In addition, no instructions were given to the subjects as to what to do when returning to the. home position. Again, a certain pace and cadence should have been chosen at the beginning of the experiment. During the
experiments, subjects ran at whatever pace they chose to return to the home position. One noticeable trend was that the subjects tended to slow down as the experiment went on. Presumably, this was due to fatigue. Ideally, a pace and cadence should be used throughout the experiment for returning to the home position.
The second area of the procedure that needed improvement was variability in the throws. They were not all executed in the same fashion. Some of the popup throws were thrown higher than others and some of the rolls were faster than the others. In addition, the throws were not all thrown to the same spot every time. Although it was impossible for the experimenter to throw the ball in exactly the same way every time, the
experimenter should have insured that the balls were thrown to more or less the same area for every type of throw.
The final area that needed some improvement was the control condition. The control condition used in this experiment was the walk or run back to the home position after throwing the ball back to the experimenter. The problem with the control is that there was little direction given to the subject for that portion of the test. The subjects all went back to the home position with no instructions as to what kind of pace or cadence to use. As a result most subjects returned to the home position at different paces between throw cycles. Overall there was not much consistency in the control condition. In order to improve this, the run to catch the ball and the return to the home position should have been identical in all aspects except that the subject had no visual task during the return to
the home position. Despite this, conclusions can still be made about the relationship between head movements and the presence or absence of a visual task.
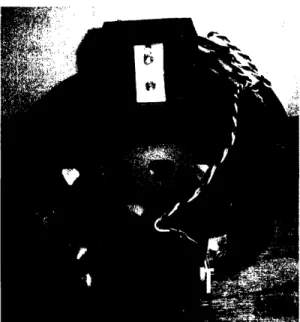
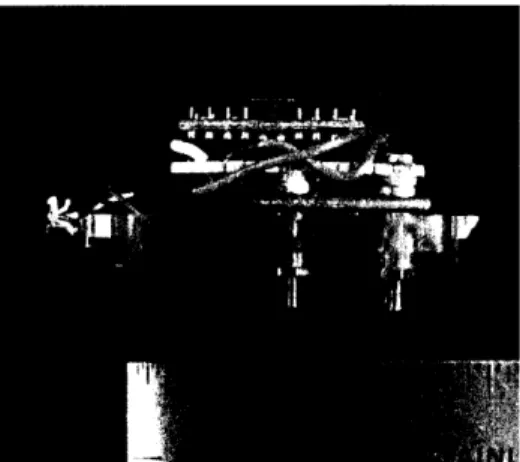
In addition to these issues with the experimental protocol, there were four areas in hardware that needed addressing. First, some of the equipment was rather fragile and could not withstand field testing. Many of the acrylic boxes used to house equipment broke. In some cases, the sides of the acrylic boxes fell off and on the torso box, the BNC cables pulled on the box and caused it to break. The broken torso box is shown in Figure 7. Another problem was that the connectors that connected the torso box and the junction box to the battery pack were faulty as the plugs occasionally fell out in the middle of testing. In addition, the torso box occasionally flipped over in the middle of an experiment thereby making the data from the torso box useless for the rest of that experiment.
Figure 7: The broken torso box.
Another area that needed to be addressed was the weight of the equipment. For this experiment, the subject wore a helmet, a torso box and a backpack which contained a computer and a connector block. Individually, each of these items is relatively light, but put together, these items can be heavy. The main concern with such equipment was that it could potentially slow the subject down or alter the motions because of the added moment of inertia. The combination of these factors had the potential of altering the subject's natural movements. In order to reduce the effects the equipment had on the subject's movements, the overall weight of the equipment needed to decrease.
The third area that needed to be focused on was the axes of motion that were measured. Although a lot of information was gathered by measuring only the pitch and yaw of the head and torso, measuring the other axes of motion would have assisted in characterizing the dynamics of the head and torso. For example, there was no
measurement of the x-axis of motion. Without that measurement, the linear velocity of the subject could not be determined. If that information had been obtained, it would have been possible to determine the relationship between the velocity of the subject and the motions of the head and torso.
The final important area of concern with the equipment was that the position of the sensors inside the torso box was not adjustable. It was designed to be attached to the subject's chest, but no measurements were made to ensure that the sensors were indeed perpendicular to the axes that they were measuring. Because this feature was not included, it seemed very likely that the true angular velocities of the torso in pitch and yaw were not measured
2.2 Six-Axis Sensors
The next iteration of equipment, known as the six-axis sensors system, tried to address the issues that emerged after building and testing first iteration. The concept was simple: build upon the system that was used in the two-axis sensor system and add more functionality. The most important problem to address was making equipment that measured movement in more axes of motion. Minimizing the weight of the equipment was also important, but it was more important to collect data on the axes of motion that were not measured in the first phase of testing. Rather than developing another piece of equipment that only measured the movement of a selection of the axes of motion, it was decided that in this iteration six axes of motion for both the head and torso would be measured. In addition, the equipment was designed to address the quality issues that arose in the two-axis sensor system and to make the torso box adjustable to ensure that the sensors were measuring what they were intended to be measure. All of the elements for this sensor system were designed, but not all of the elements were built. As a result, no experiments were conducted with this equipment.
2.2.1 Equipment
The second set of equipment built upon the first set of equipment by adding more sensors. Similar to the two-axis sensor system, there was to be three major components to the six-axis sensor system. The three components were a helmet with the sensors on it, a torso box with sensors, and a backpack with all of the data acquisition hardware.
After a search to find the best sensors for this application, it was determined that the gyroscopes from the two-axis sensor system were still the best option. However, new sensors were required to measure the linear accelerations of the head and torso. The criteria for selecting these sensors were the same as those for the angular velocity sensors. They needed to be able to measure the full range of acceleration that the head and torso experience and they needed to small and lightweight. The linear
accelerometers from Analog Devices (Analog Devices, ADXL320EB, Norwood, MA) met these requirements. The sensors were small and measured 20 mm by 20 mm. They
can measure accelerations up to 49 m/s2 and as low as -49 m/s2. According to
preliminary tests, the maximum accelerations experienced by the head and neck were well below this. These sensors also measure acceleration in two axes, which was not a requirement, but is an added benefit.
The same Petzl rock climbing helmet was used for the six-axis sensor system. The helmet is light, can be adjusted to fit any head, and objects can be mounted on it because of its hard shell. Three identical boxes were to be attached to the helmet. The sensor boxes were the only part of this equipment that was actually built. The boxes made for this equipment were designed to be light and just big enough to hold both sensors. Each of these boxes contained one accelerometer and one gyroscope. In order to make the boxes as small as possible, the sensors were placed in a stacked configuration and unlike the first set of equipment, the voltage regulator was not put in these boxes. This configuration is shown in Figure 8.
Figure 8: The gyroscope and the accelerometer in the stacked configuration screwed into the bottom half of the sensor box.
The sensor boxes for the six-axis sensor system had one wire that came out of one of the sides. The wire was six signal shielded wire from Amphenol (KA-56134,
Wallingford, CT). This wire was chosen because it was flexible, it shielded against signal loss, and it reduced the total number of wires required to just one wire per sensor box. At the location where the wires came out of the box, there was a strain relief to ensure the wire would not be disconnected from the sensor. Figure 9 shows the sensor box.
(a) (b)
Figure 9: (a) Top view of the sensor box. (b) Side view of the sensor box. (Note: (a) and (b) are not on the same scale)
In order to address the quality issues from the two-axis sensor system, the boxes were fabricated out of a new material. The boxes were all designed using 3D CAD
software (Solid Edge, UGS Corp., Plano, TX). They were then made on a
stereolithography machine. The boxes in the two-axis sensor system had six distinct walls that were all fitted together to make a box whereas the boxes in the six-axis sensor system has only two distinct parts. Because there were fewer parts and fewer fasteners required to keep the box together, the six-axis sensor system is more robust and better able to stay together.
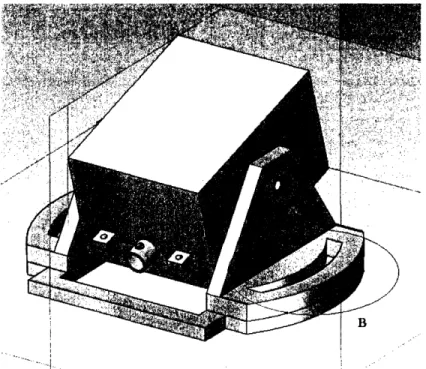
In addition to the boxes, cradle units were also designed. The cradle units were designed to attach the sensor boxes to the helmets and to allow the sensor boxes to be adjustable. Again, this was done to ensure that the sensors were aligned to measure the motion in the axes they were designed to measure. Figure 10 shows a 3D CAD model of the cradle units with the sensors attached. The cradle units and sensor boxes were to be placed on top of the helmet, the left side of the helmet and on the back of the helmet.
Figure 10: A 3D CAD model of the cradle with the sensor box. The sensor box could pivot along point A. The top half of the cradle was adjustable along the track within B. The sensor box measures
34.65x 45.54x 27.13 mm
The second item designed for the six-axis sensor system was the torso box. The torso box was designed to measure the motion in all six axes, to maintain an upright
position, and to be as small as possible. In order to prevent the torso box from rolling around during testing, special care was taken in the design process to make the base of the torso box large relative to its height. To measure the motion of the torso in six axes, the torso box was designed to have six sensors in it: three gyroscopes and three
accelerometers. In order to save space, each gyroscope was put in a stack with an accelerometer much like the sensors in the sensor box. Each of these stacks was to be placed on perpendicular walls in the torso box. Like the sensor boxes, the torso box was to be made on the stereolithography machines. This would have avoided the quality issues encountered in the previous iteration. The torso box was designed to have two six signal wires coming out of the sides of the box. The wires were to be attached directly to the sensors. A strain relief was designed for each wire in order to prevent the wires from unplugging from the sensors. The torso box was to be affixed to the subject's chest using a nylon strap. Figure 11 shows a 3D CAD model of the torso box.
Figure 11: 3D CAD model of the sensor box. The block protruding from the closest face is where the wires come out. The block serves as a strain relief The torso box measures 93 x 39 x 68 mm.
The backpack served the same function it did in the first two-axis sensor system; it contained all of the data collection hardware and the power source. There were two items in the backpack: the tablet PC and the data box. The tablet PC was the same one used for the two-axis sensor system, but there were some slight modifications that were made for the six-axis sensor system. The tablet PC was running LabView software, but the VI it was running was different. The VI had to be modified in order to gather the 12
signals coming from the sensors as opposed to the 4 signals that came from the sensors in the two-axis sensor system. The data box was a new addition to the backpack for the six-axis sensor system. The purpose of the data box system was to reduce the number of wires in the backpack and to lower the total mass of the backpack. Inside of the collector
box were three items: the battery pack, a 5 V voltage regulator, and the circuitry that was
inside the metal casing of the connector block. The data box was to be made out of acrylic which weighs less than the metal casing of the connector block. Four connectors were designed for the data box. One connector sent a wire from the connector block to the tablet PC and the other three connectors connected the torso box to the sensor boxes. Within the data box, the battery pack was to be connected to the voltage regulator to send the power to the sensors and the signals from the sensors were to be collected and sent to the connector block. The backpack configuration for the six-axis sensor system was different from the configuration for the two-axis sensor system. This configuration was less cluttered and weighed less.
2.2.2 The Next Step
Before the six-axis sensor system could be used in testing, several problems were identified with the equipment. Because of these problems, this equipment was not completed and a new set of equipment was designed and built. The first problem identified with the six-axis sensor system was the overall size of the equipment. The sensor boxes were slightly smaller than those of the first equipment, but they were heavier. These sensor boxes each contained two sensors. Also, the helmet now had an additional sensor box. Taking into account the cradle that each sensor box was going to have, the overall weight of the helmet from the second set of equipment was greater than the overall weight of the first set of equipment.
Another problem with the six-axis sensor system was that the torso box was still not adjustable. The torso box was able to measure motion in all six axes and was going to be made out of more durable materials. In addition, it was also designed to not roll over during the experiment. Because there was no adjustability built into this torso box, the sensors' axes would not be aligned correctly with the axes of the torso and the data read from these sensors would not be accurate.
There were also problems with data collection. In the original equipment, the connector block received two wires from each sensor; one was ground and the other from the sensor. The VI was written to compare the voltage from the channel that had the ground wire connected to it with the channel that had the signal wire connected to it. This required two channels for each sensor for a total of eight signals. The six-axis sensor system had twelve sensors in total. If the same VI was used for this iteration, the connector block would have needed 24 channels. The connector block used in the first iteration only had 16 available channels. 16 channels were not going to be enough to have a ground and a signal wire coming from each sensor. The solution for this was to change the data collection system. Instead of connecting two wires to the connector block from each sensor, only one wire was going to be connected to the connector box from each sensor and one of the channels was going to have a ground reference from the battery pack. This configuration only required thirteen channels, so it was feasible to do this. However, this configuration came with its own set of problems. In particular with this configuration the ground was not necessarily uniform for all the sensors. While it is true that they all had the ground from the battery, it was also the case that the ground signal branched off a few times and traveled through three feet of wire before it reached any of the sensors. The ground would be similar but not the same for all the sensors, so it would not have been appropriate to use the single ground reference. Because of all these problems, a third iteration of equipment was necessary.
2.3 The All-Axis Sensor System
The third iteration of equipment, known as the all-axis sensor system, addresses all of the issues that emerged from the first and second iterations of equipment. It measures movement in all six axes of motion and is adjustable and is lightweight. Data collection is more accurate. This equipment represents considerable improvement over the first two designs of equipment.
2.3.1 Equipment
The all-axis sensor system has the same three modules as the first two sets of equipment. There is a helmet with sensors attached to it, a torso box, and backpack with
data acquisition equipment inside of it. However, for this iteration, new sensors were chosen so all of these modules were modified.
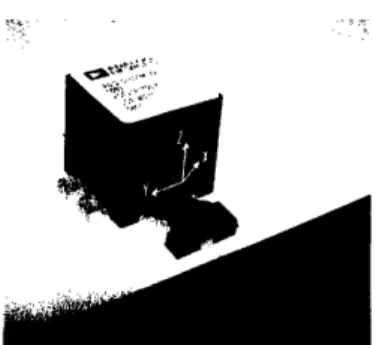
Although the sensors used in the previous sets of equipment were small, they could only measure one axis of motion at a time. Because of this, twelve sensors were required to measure all six axes of motion for both the head and torso. Placing six sensors on the helmet and in the torso box made the equipment bulky and added mass. Therefore one of the first things considered for this set of equipment was getting new sensors that could measure more than one axis of motion. After researching several different sensors, it was determined that six-axis sensors from Analog Devices (ADIS 16350, Norwood, MA), which were just recently released would be the best sensors for this iteration. The sensor is pictured in Figure 12.
Figure 12: The ADIS16350 sensor from Analog devices.
These sensors were small. With the evaluation board, they measured only 57.4 mm by 38.3 mm by 23.3 mm. They could measure all of the angular velocities of the rotational degrees of freedom and all of the accelerations of the linear degrees of
freedom. Only one of these sensors was needed for the head and one for the torso, which was a considerable improvement over the twelve sensors that were required for the previous designs.
The helmet used for the all-axis sensor system was the same as that used in the previous two sets of equipment. This time, however, there was only one sensor box attached to the helmet. Unlike the six-axis sensor system, the adjustability of the sensors was considered initially while designing this box. Therefore, no cradle was needed for this sensor box, which helped reduce the overall weight of the equipment. The design of
this sensor box was simple: a platform and a box. The sensor and the evaluation board were placed on an acrylic platform. The platform is shown in Figure 13.
Figure 13: The sensor and the evaluation board mounted to the platform.
The second part of the sensor box was the actual box. It was designed in a similar manner to the previous sensor boxes. It was designed to be as small possible and was fabricated on the stereolithography machine in order to avoid the quality issues
experienced in the two-axis sensor system. The platform was hinged to one end of the box. On the other end of the box was a circular track. The unhinged end of the platform had a screw that traveled along this track. The screw could be tightened to keep the platform in any particular position. This sensor box was placed symmetrically on top of the head so it only needed to be adjustable along the rotational y-axis of the sensor. On one side of the box was a rectangular hole with a lip on it. The hole was created to allow the six stranded wire to connect to the sensors independently of what position the
platform was in. The lip served as the strain relief. The wire was placed on this lip and a cable tie held the wire in place. The wire transmitted the signals from the sensors to the data acquisition system in the backpack. Because the sensor could measure all six degrees of freedom, only one box was needed on the helmet. This sensor box is pictured in Figure 14.
Figure 14: The assembled sensor box attached to the helmet.
The second module for this equipment was the torso box. The torso box had a very similar design to the sensor box. It consisted of a platform and a box. One
difference between them was that the torso box was designed to be a wider and longer in order to prevent it from turning over during testing. Another difference was that the platform was made to be adjustable in the rotational x-axis. A third difference was that there were two slits on top of the box. These slits-were designed to have a nylon strap threaded through them in order to attach the torso box to the subject. Other than that, the sensor box and the torso box were similar in all other design aspects. The torso box is pictured in Figure 15.
Figure 15: The assembled torso box with the strap on it.
The final module for this equipment was the backpack which held two items. The first item was the Tablet PC that has been used in all iterations of the equipment. The
second item in the backpack was the I2C/SPI interface device (National Instruments,
USB-8451, Austin, TX). The sensors used in the previous iteration had analog outputs, but the 6-axis sensors use digital signals so the connector block used in the previous
iterations could not be used. In addition, these sensors communicate using the SPI interface so the I2C/SPI interface device was an appropriate device to send and receive
signals from these sensors. An added benefit of using the I2C/SPI interface device is that
it is much lighter than the connector block used in the first and second iteration. Another
benefit of the ]2C/SPI interface device was that the device provided a constant 5 V power
source; 5 V is exactly the voltage needed to operate the six-axis sensors. This meant that
no battery pack was needed for this equipment. However, communicating with these
sensors using this I2C/SPI device was not an easy task.
2.3.2 Communicating with the Sensors
There was some difficulty in communicating with the sensors through the SPI interface. The main difficulty was that the unlike sensors used in the six-axis sensor system, the sensors used in the all-axis sensor system communicate digitally.
Specifically, they communicate using the SPI interface which is a synchronous serial data link standard that operates in full duplex mode. Because it is full duplex, it is able to send and receive signals simultaneously.
With the old gyroscopes and accelerometers used in the six-axis sensor system, the sensors were constantly sending analog data to the computer in the form of voltages. The computer could read the voltages and the voltages could be converted into rotational velocities. This operation was fairly simple.
The six-axis sensors used in the all-axis system, however do not output analog data continuously. Instead, the computer must send the sensors bytes of data that either write to the sensor registers or read from the sensors' registers. In either situation, the computer must send the sensor two bytes of data. Depending on what is sent to the sensor, the sensor responds by either changing the register or by returning the contents of the register to the computer. In order to get the data from the accelerometers and
gyroscopes, the computer had to send it two bytes of data. The first byte of data sent the important data to the sensor. The first bit communicated to the sensor that data was going to be read from the register. The second bit was unimportant, and was given a low value by convention. The final six bits gave the sensor the address of the accelerometer
or gyroscope that the computer wanted data from. The second byte was unimportant after that. It was given all low values by convention.
For these experiments, the only operation that was required was to read from the sensors' registers. In order to send data to the sensor and receive the data from the registers, a LabView VI was written. This VI was designed to repeatedly send twelve signals to the sensors telling it to send data from the registers of each of the gyroscopes and accelerometers, read the data sent back to the computer from the sensors' registers, and record all of these data to a text file.
The final difficulty in communicating with these sensors was that all of the data was in two's complement format. Two's complement is a way of expressing the sign of numbers without using a negative sign. All arithmetic using two's complement can be done without the use of any subtraction. This eliminates the need for subtraction circuitry on the sensor. However, this creates the need to convert the numbers back to standard decimal form. In addition to the tasks listed previously, the LabView VI also had to convert the numbers from two's complement into decimal numbers.
A VI was therefore written that could repeatedly send data to the sensors'
registers, read the data that the sensor sent back, convert the two's complement numbers into decimal numbers, and write all of the data into a text file.
2.3.3 Procedure
The procedure that was used with the two-axis sensor system was fundamentally sound. There were only slight problems with its implementation. The protocol that was used for the all-axis sensor system used the same procedure with one addition, that is, the subject also walked and ran without catching or throwing the ball.
The first step of the procedure was to put all of the equipment on the subject. This included putting on the helmet, torso box, and backpack and adjusting all of the straps to make sure that they fit snugly on the subject. The equipment for the all-axis sensors system was always connected, so the subject was ready to begin testing as soon as she put on all of the equipment.
When the subjects were ready, they were told to go to the home position. This experiment started with a quick calibration procedure in which the subject was asked to
lean forward, make a quick turn to the right, and then a quick turn to the left while standing at the home position. This was done to verify that the axes of the sensors were aligned with the subject's axes.
The next part of the experiment was performed in a similar manner to the first experiment except for a few small changes. The subject started at the home position and the experimenter waited in the throwing position. When the subject was ready, the throwing portion began. Again, the subject was instructed to not move until the
appropriate time to do so. The throw cycles were identical to the throw cycles from the first experiment. The experimenter yelled out to the subject what kind of throw he was about to throw. The same four choices were available: throw right or left and roll right or left. As soon as the ball was released, the subject was free to run over to catch the ball. The subject then attempted to catch the ball. Whether or not the subject caught the ball, the subject stood still and faced the experimenter. Ten seconds after the throw cycle started, the experimenter told the subject to throw the ball back. If the subject did catch the ball, the subject threw the ball back. If the subject did not catch the ball, the subject mimicked throwing the ball back. In both cases, the subject was then instructed to jog back to the home position at the same pace that he or she used to run and catch the ball.
The subject then waited at the home position until the next throw cycle started. In this protocol there were still 32 throw cycles with each type of throw occurring eight times.
Type of Throw 1 2 3 4 5 6 7 8 9 10 11 12 13 14 15 16 Throw Throw Roll Roll Throw Roll Roll Throw Throw Roll Roll Throw Throw Throw Roll Roll Right Left Right Right Right Left Left Left Right Right Right Left Right Left Left Left Table 2: The pattern used for the second experiment
This pattern was repeated two times for this experiment. A longer pattern was created for this experiment to ensure that the subjects would not recognize that a pattern was being repeated. Considerable care was taken to ensure that all of the throws were thrown in a similar manner every time to avoid the variability in throws evident in the first experiment.
After the 32 throw cycles were completed, subjects then performed the walking and running portion of the experiment. They were instructed to go in a circle around the testing area. First, they walked for 15 s, and then they jogged ran for 15 s. This cycle was repeated once. For this portion of the experiment, subjects were not given any instruction as to what to focus their gaze on. Subjects were free to look at whatever they wanted. The subjects were instructed, however, to jog at a similar pace as that used to run and catch the ball in the first part of the experiment. This part of the experiment provided a control condition for analyzing the data in this experiment.
Another change implemented into this phase of testing was that throughout the test, important milestone times were noted. Milestone times include the start and end of the walking and running portion, the time the ball was thrown, the time the subject caught the ball, the time the subject threw the ball back, and the time the subject returned to the home position. Also noted was the time when the different walking and throwing phases
were performed. All of these times were measured relative to the starting time of the experiment. By noting the exact times of all of these events, data analyses were greatly
3. Results
More tests were done using the two-axis sensor system than the all-axis sensor system. As a result, stronger conclusions can be drawn from the data gathered in the first set of experiments than the data gathered from the second set.
3.1 Two-Axis Sensor Experiments
U10 2 50 0 4-0 0 o
04
-50 -100 -n 130 140 150 160 170 180 Time (s)Figure 17: Graph of the yaw of the head (red) and torso (brown)for two consecutive throw cycles. The blue shaded areas represent the run and catch portion of the throw cycle. The yellow shaded areas
50
00
0 o -50 1inn 1 A130 140 150 160 170 180 Time (s)Figure 18: Graph of the pitch for both the head (blue) and torso (green)for the same two throw cycles
from Figure 17. The blue shaded areas represent the run and catch portion of the throw cycle. The yellow shaded areas represent the throw and return portion of the throw cycle.
Figures 17 and 18 illustrate typical responses in pitch and yaw for both the head and torso during consecutive throw cycles. If one was to look at a throw cycle for any other subject, one would find similar responses for most of their throw cycles. In Figure
17, it can be seen that for the run and catch portion of the throw cycle, the angular velocity in yaw for the head has a greater peak magnitude than it does for the torso. In the throw and return portion of the throw cycle, however, the magnitude of the velocity in yaw is about the same for both the head and torso. It also appears that the direction of the rotational velocities in yaw are generally the same for both the run and catch portion of the cycle and for the throw and return portion.
In Figure 18, which shows the pitch of the head and torso for two throw cycles, it is evident that the peak magnitudes of the angular velocities in the run and catch portion are greater than the peak magnitudes of the angular velocities in the throw and return portion. However, the sign of the velocities does not appear to be related to the portion of the throw cycle.
The power spectral density (PSD) of the head and trunk in both pitch and yaw is shown in Figures 19 and 20. These graphs are shown in a semi-log scale.
5 I .10 4 1 "10 3 1 .10 1 .102 1 1 .10 0 1 .10 Frequency (Hz)
Figure 19: The power spectral density of the head (red) and torso (brown) in yaw.
1 *10 4 1 *10 3 1 *10 1 .10 I *10 0 I *10 Frequency (Hz)
Figure 20: The power spectral density of the head (blue) and torso (green) in pitch.
Figure 19 suggests that in yaw, the PSD of the head decays more rapidly than the PSD of the torso for frequencies higher than approximately 1.5 Hz. In addition, for frequencies less than 1.5 Hz, the PSD curves of the head and neck are comparable and the peaks of both the PSD curves occur somewhere between 0.20 and 0.50 Hz. Also, the magnitude of the PSD decreases by three orders of magnitude at approximately 5.0 Hz.
As shown in Figure 20, the PSD of the head and torso are similar throughout the entire frequency range except at approximately 2.0 Hz. At around 2.0 Hz, the PSD of the torso has a peak which quickly decreases. Similar to the PSD curves for yaw, the PSD curves in pitch have the largest peak between 0.20 Hz and 0.50 Hz. At approximately 8.0 Hz, the PSD decreases by three orders of magnitude.
Figures 21 and 22 compare the PSD and the probability density function (PDF) of the catch portion and the PSD and PDF of the throw portion of the throwing cycle for the head and torso in pitch and yaw. In the catch portion, the subject has a directed visual task and in the throw portion, the subject does not have any specified visual task. It is important to note that in these graphs the scales are linear.
PSD, Ty: throw (brown), catch (black)
I I I r 04 RMS throw = 23.5 deg/s RMS catch = 25.1 deg/s )4 K Frequency (z) Frequency (ilz)
PSD, Hy: throw (red), catch (black) 2.
2.104
1 104
n.
PSD, Tp: throw (green), catch (black)
I I - RMS throw = 7.4 deg/s RMS catch = 20.2 deg/s 176% ! ! Frequency ( z) Frequency (11z)
PSD, Hp: throw (blue), catch (black)
Frequency (Hz) Frequency (I z)
Figure 21: Each graph is a comparison between the PSD of the catch portion and the PSD of the throw portion of the experiment for either the pitch or yaw of either the head or torso. Hy is the head yaw, Hp is
the head pitch, Ty is the torso yaw, and Tp is the torso pitch. 2.10
1.10
;-c~--·-- - --.~-~---c, ·
U
PDF Ty: throw (brown), catch (black)
Velocity (deg/s) 10Velocity
Throw Ty: RMS = 23.5 deg/s, max = 68.9, min = -69.6
Throw Hy: RMS = 20.1 deg/s, max = 119.0, min = 122.3
Catch Ty: RMS = 25.4 deg/s, max = 107.4, min = -118.2
Catch Hy: RMS = 15.7 deg/s, max = 83.6, min = -75.6
PDF1 Tr a thro-w I ireen)i catck hi(black PDF Hp: throw (blue), catch (black)
0. 0.
-100 50 0 50 1tl
Velocity (deg/s) Velocity (deg/s)
Throw Tp: RMS = 7.4 deg/s, max = 35.8, min = -32.2 Throw Hp: RMS = 8.5 deg/s, max = 44.8, min = -51.0
Catch Tp: RMS = 20.2 deg/s, max = 95.0, min = -100.8 Catch Hp: RMS = 18.2 degls, max = 64.2, min = -77.8
Figure 22: Each graph is a comparison between the PDF of the catch portion and the PDF of the throw portion of the experiment for either the pitch or yaw of either the head or torso. (Note:
Between the catch and throw portions of the experiment, the subjects decreased their speed by an average of 40%. This decrease in speed is due to the fact that in most cases, the subject jogged over to catch the ball but only walked when returning to the home position. Figures 21 and 22 show that the root mean square (rms) of trunk yaw increased by 7% when the subject had to run over to catch the ball and that the rms of the head yaw decreased by 28% when the subject had to run over to catch the ball. These figures also show that the pitch of the head and of the torso both increase significantly when subjects are trying to catch a ball. For the torso, the rms increases 176% and for the head the rms increases 116%. These increases in pitch are of a much greater magnitude than the changes in yaw for both the head and torso. It seems that the pitch of both the head and torso increases in the catch portion. Figures 21 and 22 also suggest that there is a large increase in torso pitch for the catch portion at velocities greater than 20 deg/s and frequencies of less than 1.0 Hz. In addition, there is an increase in head pitch for the catch portions at velocities greater than 40 deg/s and frequencies below 1 Hz. In contrast,
PDF Hy: throw catch (black)
o0
p 8 ,
h
the head yaw becomes more stable during the catch portion. There was a decrease in velocities greater than 40 deg/s and an increase in velocities less than 10 deg/s.
The following figure shows the trends of the average rms values for head and torso pitch and yaw.
IF 'L rp ny 1 n
Figure 23: The trends of the rms values for all subjects for all degrees offreedom. T and H represent the 2D velocity of the head and torso, respectively. The 2D velocity is the vector addition of the
pitch and yaw. The "Error" bars indicate ± one standard deviation.
Figure 23 shows that there is some variation in the trends for the mean rms rotational velocity values for the trunk in yaw. For six of the ten subjects the mean rms rotational velocity decreases. However, the head and torso pitch and the head yaw have more consistent trends between the throw and catch portions with at least eight of the ten subjects showing similar responses. For the 2D velocities of the head and torso, the mean rms rotational velocities of the torso increased in the catch portion, but decreased for the total velocity of the head for six of the subjects tested
The following table summarizes the major findings of this experiment.
mean rms rot vel max rot vel
min rot vel
Torso Yaw Throw 23.5 68.9 -69.5 Catch 25.4 107.4 -118.2 Torso Pitch Throw 7.4 35.8 -32.2 Catch 20.2 95.0 -100.8 Head Yaw Throw 20.1 119.0 -122.3 Catch 15.7 83.6 -75.6 Head Pitch Throw 44.8 -51.0 Catch 18.2 64.2 -77.8
Table 3: Summary of the major findings from the two-axis sensor experiment.
3.2 All-Axis Sensor Experiments
Only one subject was tested using the all-axis set of equipment. Although the data from this experiment are valid, it is not practical to draw conclusions from these data because of the small sample size. Data from this experiment are shown in the Figures 24 through 29.
200
100
150 155 160 165 170 175 180 185
Time (s)
Figure 24: Graph of the pitch of both the head (red) and torso (blue) for two consecutive throw cycles. The grey shaded areas represent the run and catch portion and the yellow shaded areas represent the
throw and return portion of the throw cycle
E--innLUY
100 (n 0) 0 0 -100 -200 150 155 160 165 170 175 180 185 Time (s)
Figure 25: Graph of the yaw of both the head (red) and torso (blue)for two consecutive throw cycles. The grey shaded areas represent the run and catch portion and the yellow shaded areas represent the throw
and return portion of the throw cycle
0
150 155 160 165 170 175 180 185
Time (s)
Figure 26: Graph of the roll of both the head (red) and torso (blue) for two consecutive throw cycles. The grey shaded areas represent the run and catch portion and the yellow shaded areas represent the throw
150 155 160 165 170 175 180 185
Time (s)
Figure 27: Graph of the x-axis acceleration of both the head (red) and torso (blue) for two consecutive
throw cycles. The grey shaded areas represent the run and catch portion and the yellow shaded areas represent the throw and return portion of the throw cycle
g. E 0 CU () C,2 150 155 160 165 170 175 180 185 Time (s)
Figure 28: Graph of the y-axis acceleration of both the head (red) and torso (blue) for two consecutive throw cycles. The grey shaded areas represent the run and catch portion and the yellow shaded areas
150 155 160 165 170 f i. l-U
Time (s)
Figure 29: Graph of the z-axis acceleration of both the head (red) and torso (blue)for two consecutive throw cycles. The grey shaded areas represent the run and catch portion and the yellow shaded areas
4 Discussion
4.1 Hardware
The all-axis sensor system is a considerable improvement over the two-axis sensor system as the motion for all degrees of freedom for both the head and torso are all measured. Because of this, the data obtained with this equipment provides more
information about head and torso movement during natural activities. In addition, the equipment in the all-axis sensor system is lighter than the two-axis sensor system and because the wiring for this equipment is not as rigid, the subject has more freedom when moving around. One subject who was tested with both sets of equipment commented on how much lighter this equipment felt compared to the old equipment.
There are still many more improvements that can be made to the all-axis sensor system. The backpack could be made lighter if the tablet PC was replaced by a smaller computer or if a PDA could collect the data. In addition, if a PDA or equivalently small
computer is used, the I2C/SPI interface device is small enough that they could both be
placed in a fanny pack as opposed to a backpack. This improvement would allow the subject to move more naturally during testing. Alternatively, a wireless system could be developed to communicate with the sensors remotely. This would remove the need to have any sort of backpack or fanny pack at all and would allow the user to move more naturally during testing.
4.2 Testing Protocol
The protocol used for the all-axis sensor system eliminated many of the flaws from the first phase of testing. One improvement that could still be made, however, is focusing more on rolling the ball as opposed to throwing the ball. The reason for this is that the subjects tended to move more naturally when going for the rolling throws. When running to catch the popped up ball, the subjects seemed hesitant to run while focusing on the ball. However, when running to scoop up the rolling ball, the subject tended to run at full speed while still being able to focus on the ball. Because the objective of this study is to examine the head and torso dynamics during natural activities, it seems that the rolling throws would be a better action to focus the experiment on.