During a Hospitalization
Thomas V. Perneger, MD, PhD
1,3, Agathe Charvet-Bérard, MS
1,3, and Arnaud Perrier, MD
2,31Division of Clinical Epidemiology, University Hospitals of Geneva, Geneva, Switzerland;2Division of General of Internal Medicine, University Hospitals of Geneva, Geneva, Switzerland;3University of Geneva, Geneva, Switzerland.
BACKGROUND: How medical decisions are made in
real-life situations is largely unexplored. We explored
patients’ perceptions of decision-making during a
hos-pitalization and examined the conformity of the decision
process with expert recommendations.
OBJECTIVE: To describe the conformity of the
decision-making process with current expert opinion and examine
the associations between various aspects of the
decision-making process and a global assessment of the decision.
METHODS: Mail survey of patients discharged from a
teaching hospital in Geneva, Switzerland. Patients
identified the main medical decision during their stay,
and rated the decision process (11-item
“decision
process score”) and their satisfaction with the decision
(five-item
“decision satisfaction score”). Both scores
were scaled between 0 (worst) and 100 (best).
PARTICIPANTS: The survey had 1467 respondents.
MAIN RESULTS: In total 862 (58.8%) of 1467
respon-dents reported having made a medical decision while in
the hospital. The decision process score (mean 78.5, SD
21.5) and the decision satisfaction score (mean 86.5, SD
20.4) were moderately correlated (r=0.62). Men, healthier
patients, patients discharged from the department of
surgery, and those who reported sharing the decision
with their doctor gave the highest ratings on both scales.
Five process variables were independently associated with
high satisfaction with the decision: the doctor explained
all possible treatments and examinations, the patient was
aware of risks at the time of the decision, the doctor’s
explanations were easy to understand, the patient was
involved in the decision as much as desired or more, and
the patient was not pressured into the decision.
CONCLUSIONS: A majority of patients discharged from
a general hospital were able to identify and rate a
medical decision. Recommended features of the process
of medical decision-making were associated with
great-er satisfaction with the decision.
KEY WORDS: shared decision-making; patient-centeredness; patient survey; quality of care.
J Gen Intern Med 23(10):1659–65 DOI: 10.1007/s11606-008-0736-4 © Society of General Internal Medicine 2008
INTRODUCTION
Patient involvement in medical decisions is a key aspect of patient-centred care.1–5Most patients are keen to participate in
medical decisions,3–6and most doctors have a positive attitude toward patient involvement.7Patient involvement is justified by
the ethical principle of autonomy, but may also lead to greater satisfaction with care8,9and to better clinical outcomes.10,11
Evidence about how medical decisions are reached in hospital care is limited. Observational studies of decision-making during medical visits12–16have not probed the percep-tions of the patients. Others have explored patients’ opinions about specific decisions in ambulatory care, including care for diabetes,9depression,10selected outpatient conditions,17 hys-terectomy,18 hypertension,19 surgical treatment for breast
cancer,11,20or anti-thrombotic therapy.21What patients think about medical decision-making during a typical hospitaliza-tion has received limited attenhospitaliza-tion.
In this study, we questioned patients recently discharged from an acute care hospital about the most important medical decision made during their stay. We sought to describe the conformity of the decision-making process with current expert opinion,1–5and to examine the associations between various aspects of the decision-making process and a global assess-ment of the decision.
METHODS
This study was part of a regular patient opinion survey conducted at a teaching hospital in Geneva, Switzerland. As quality assessment projects that entail minimal risk to parti-cipants, these surveys22,23 are exempted from full review by
the research ethics committee. The hospital is public, and is affiliated with the Faculty of Medicine, University of Geneva. It includes separate facilities for acute care, rehabilitation, psychiatric care, geriatrics, and long-term care, totalling 2197 beds. Inpatient care is provided by senior doctors and residents who are salaried by the hospital; the patient’s private physician is not directly involved.
Sample, Data Collection
Participants were adult residents of Switzerland discharged from the hospital in March 2004. Due to a data extraction problem, the Department of Geriatrics was not included. The survey package—a cover letter, the self-administrated ques-tionnaire, and a business reply envelope—was sent to patients’ homes 4–8 weeks after discharge. Patients were invited to send the questionnaire back empty if they considered themselves Received March 13, 2008
Revised June 17, 2008 Accepted July 1, 2008 Published online July 29, 2008
too sick or otherwise unable to fill it in, did not understand French sufficiently, or did not wish to participate. Non-respondents received a reminder postcard and two survey packages at 2 to 4 weeks intervals. We considered those who moved away, had died, or returned the questionnaire empty because they were too sick or did not speak French as ineligible.
Questionnaire
The core of the questionnaire was the 50-item Picker patient experience survey.24Patients were also asked about their age, sex, nationality, level of education, and current health (two items from the Short Form 36 Health Survey: general health, and feeling downhearted and blue during the last 4 weeks).25,26
We added questions about the most important decision made in the hospital. The items were translated into French or written de novo by TP and ACB, based on a review of the literature12–21and existing instruments.27–33For consistency
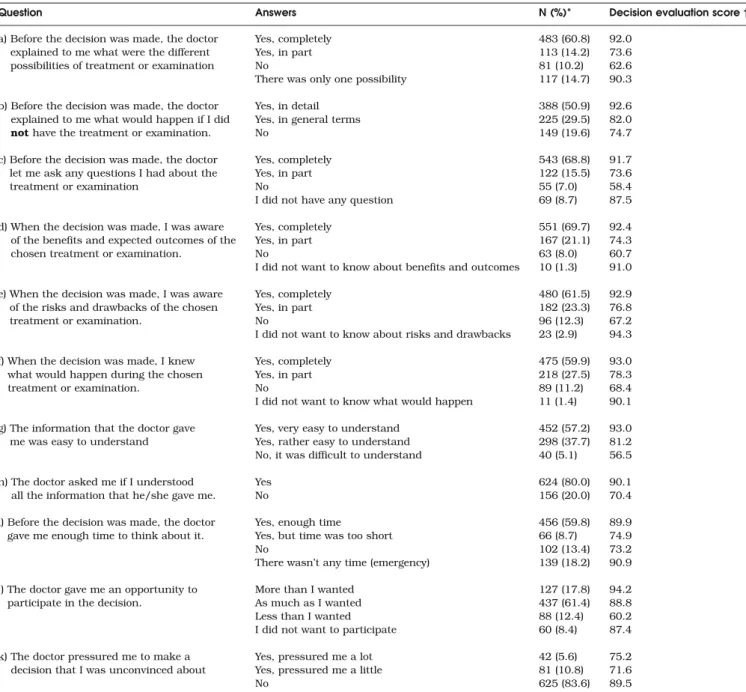
with the Picker questionnaire, we used a three-point response format whenever possible, with a fourth“not relevant” option where required. All items were pre-tested with 15 hospitalised patients. The pre-tests led us to include statements about timing (e.g.,“Before the decision was made...” or “When the decision was made...”), since inpatients see their doctor regularly and several reported receiving relevant information too late. Other changes made during pre-tests are given below. The initial question identified the type of decision, as starting a new medical treatment, choice between two medical treatments, having surgery, local vs. general anaesthesia, Table 1. Process of Decision-Making in Hospital, as Reported by 812 Former Inpatients
Question Answers N (%)* Decision evaluation score†
a) Before the decision was made, the doctor explained to me what were the different possibilities of treatment or examination
Yes, completely 483 (60.8) 92.0
Yes, in part 113 (14.2) 73.6
No 81 (10.2) 62.6
There was only one possibility 117 (14.7) 90.3
b) Before the decision was made, the doctor explained to me what would happen if I did not have the treatment or examination.
Yes, in detail 388 (50.9) 92.6
Yes, in general terms 225 (29.5) 82.0
No 149 (19.6) 74.7
c) Before the decision was made, the doctor let me ask any questions I had about the treatment or examination
Yes, completely 543 (68.8) 91.7
Yes, in part 122 (15.5) 73.6
No 55 (7.0) 58.4
I did not have any question 69 (8.7) 87.5
d) When the decision was made, I was aware of the benefits and expected outcomes of the chosen treatment or examination.
Yes, completely 551 (69.7) 92.4
Yes, in part 167 (21.1) 74.3
No 63 (8.0) 60.7
I did not want to know about benefits and outcomes 10 (1.3) 91.0
e) When the decision was made, I was aware of the risks and drawbacks of the chosen treatment or examination.
Yes, completely 480 (61.5) 92.9
Yes, in part 182 (23.3) 76.8
No 96 (12.3) 67.2
I did not want to know about risks and drawbacks 23 (2.9) 94.3
f) When the decision was made, I knew what would happen during the chosen treatment or examination.
Yes, completely 475 (59.9) 93.0
Yes, in part 218 (27.5) 78.3
No 89 (11.2) 68.4
I did not want to know what would happen 11 (1.4) 90.1
g) The information that the doctor gave me was easy to understand
Yes, very easy to understand 452 (57.2) 93.0
Yes, rather easy to understand 298 (37.7) 81.2
No, it was difficult to understand 40 (5.1) 56.5
h) The doctor asked me if I understood all the information that he/she gave me.
Yes 624 (80.0) 90.1
No 156 (20.0) 70.4
i) Before the decision was made, the doctor gave me enough time to think about it.
Yes, enough time 456 (59.8) 89.9
Yes, but time was too short 66 (8.7) 74.9
No 102 (13.4) 73.2
There wasn’t any time (emergency) 139 (18.2) 90.9 j) The doctor gave me an opportunity to
participate in the decision.
More than I wanted 127 (17.8) 94.2
As much as I wanted 437 (61.4) 88.8
Less than I wanted 88 (12.4) 60.2
I did not want to participate 60 (8.4) 87.4
k) The doctor pressured me to make a decision that I was unconvinced about
Yes, pressured me a lot 42 (5.6) 75.2
Yes, pressured me a little 81 (10.8) 71.6
No 625 (83.6) 89.5
* Percentages given on valid answers; on average 37 missing answers per question (4.6%) † Based on variables in Table2
peridural anaesthesia for childbirth, specialized investigation, other type of decision. We developed this closed-format list after pre-tests revealed that an open-ended question yielded inconsistent information.
Subsequent questions probed the decision-making process and global satisfaction with the decision. The decision process was explored through 11 items (Table 1), adapted from the COMRADE scale (items a, c, d, e, g, j),28the Decision Conflict
Scale (items a, d, e, k),29and the OPTION scale (items a–f, h).30 We created a new item about having had enough time to think about the decision (i), since sufficient time is an important requirement for informed consent.34 During pre-tests we added the response option about lack of time in emergency situations. The patient’s perception of who made the decision (doctor alone, mostly doctor, shared, mostly patient, patient alone) was adapted from Degner.31,32The global satisfaction with the decision was based on five items (Table 2), adapted from the COMRADE scale (items m, n),28the decision regret scale (items n, o, p),33and the Satisfaction with Decision Scale (item n).34We created one new item (item l: satisfaction with the
doctor’s role in the decision), because many of the process-related items address the role of the doctor; during pre-tests we added the explanation in parentheses about what we meant by the doctor’s role. The pre-test also led us to drop an item about the decision being consistent with the patient’s values, as several participants did not understand what we meant by this.
Statistical Analysis
First we analysed the proportion of respondents who reported on a decision made in the hospital, i.e., those who identified a specific type of decision or who answered more than half of the questions related to decision-making. The prevalence of patient-reported decision-making was compared across subgroups.
Second, we examined the frequency distributions of the items related to decision-making. We limited this analysis to respondents who answered a least half of these items. To derive a global process-related scale scaled between 0 (worst)
and 100 (best), we recoded each item response as desirable (scored as 100), intermediate (50), undesirable (0), or item not relevant or not applicable (100). For instance, in response to the item “When the decision was made, I knew what would happen during the chosen treatment or examination”, “Yes, completely” was assigned 100, “Yes, in part” was assigned 50, “No” was assigned 0, and “I did not want to know what would happen” was assigned 100 as well, since this response reflects the patient’s preference and not a deficiency in the information process. We verified by factor analysis that the scale was uni-dimensional, and computed a decision process score as the mean value between 0 and 100, if at least half of the items were answered. This approach to computing summary scores is used by many scaling algorithms, including the Short Form 36 Health Survey.26 We proceeded similarly for the five global
evaluation items, and computed a decision satisfaction score. We obtained Cronbach alpha coefficients for both scales.
To examine the validity of the questionnaire items, we compared mean decision-process scores across responses to satisfaction items, and mean decision-satisfaction scores across responses to process items. We expected that the process and outcome of the decision would be associated.
To identify the most important process-related items, we used analysis of variance, with the decision satisfaction score as the dependent variable, and the process items as factors.
We examined the two summary scores across patient subgroups, using analysis of variance. Post hoc comparisons were adjusted with the Scheffé method. Finally, we examined associations between the two summary scores and the global rating of the hospital stay (between excellent and poor) in ordinal logistic regression. P values <0.05 were considered statistically significant.
RESULTS
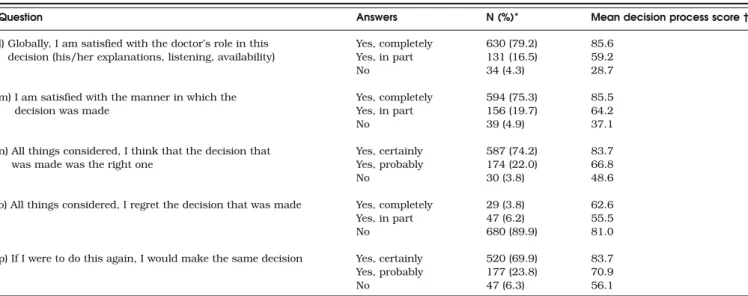
Of 2396 patients contacted by mail, 233 were found to be ineligible (22 had died, 86 had an unknown address, 44 did Table 2. Global Satisfaction with Decision-Making in Hospital, and Associations with the Decision Process Score, Reported by 812 Former
Inpatients
Question Answers N (%)* Mean decision process score†
l) Globally, I am satisfied with the doctor’s role in this decision (his/her explanations, listening, availability)
Yes, completely 630 (79.2) 85.6
Yes, in part 131 (16.5) 59.2
No 34 (4.3) 28.7
m) I am satisfied with the manner in which the decision was made
Yes, completely 594 (75.3) 85.5
Yes, in part 156 (19.7) 64.2
No 39 (4.9) 37.1
n) All things considered, I think that the decision that was made was the right one
Yes, certainly 587 (74.2) 83.7
Yes, probably 174 (22.0) 66.8
No 30 (3.8) 48.6
o) All things considered, I regret the decision that was made Yes, completely 29 (3.8) 62.6
Yes, in part 47 (6.2) 55.5
No 680 (89.9) 81.0
p) If I were to do this again, I would make the same decision Yes, certainly 520 (69.9) 83.7
Yes, probably 177 (23.8) 70.9
No 47 (6.3) 56.1
* Percentages given on valid answers; on average 35 missing answers per question (4.3%) ** For computation of decision evaluation score; established a priori
not speak French, 81 were too sick to respond). Of 2163 eligible respondents, 1467 (67.8%) returned the questionnaire.
Frequency of Decisions
Seven hundred and seventy-two (52.6%) respondents checked one type of medical decision made during their hospital stay, 447 (30.5%) checked that“no important medical decision was made in hospital,” and 248 (16.9%) left the answer blank. The types of decision were: starting a new medical treatment (158), choice between two medical treatments (38), having surgery (205), local vs. general anaesthesia (140), peridural anaesthe-sia for childbirth (74), specialized investigation (104), other type of decision (53). Among respondents who did not identify a specific decision, 90 answered nine or more of the 17 decision-related questions, and were therefore included among those who reported on a decision. Thus 862 (772 plus 90, 58.8%) of 1467 respondents gave a clear indication of having made a decision in the hospital.
Reports of decisions were more frequent among younger patients, the more educated, those born outside Switzerland, the more depressed patients, and those discharged from the departments of gynaecology–obstetrics and psychiatry (Table2).
Decision-making Process
Among 862 patients who identified a decision, 48 answered fewer than 9 of the 17 questions on decision-making. These incomplete records were excluded, leaving 814 observations for further analysis.
For each of the 11 questions about the decision-making process, a majority of patients selected the most favourable answer (Table1). The least favourable results were obtained for information on what would happen if the patient refused the intervention, and for the information being easy to understand.
The decision process score based on the 11 process-related items had a Cronbach alpha coefficient of 0.82. The mean was 78.5 (standard deviation 21.5), and 141 (17.5%) respondents had a score of 100.
Satisfaction with the Decision
Most patients were completely satisfied with the doctor’s role in the decision and with the decision globally (Table3). The five satisfaction items were also combined into a summary decision satisfaction score, scaled between 0 and 100. The Cronbach alpha coefficient was 0.81. The mean score was 86.5 (standard deviation 20.4), and 436 (54.6%) respondents had the maxi-mum score of 100. Each of the five satisfaction items was significantly associated with the mean decision process score. The Spearman correlation coefficient between the two sum-mary scores was 0.62.
Process Items as Predictors of Decision Satisfaction
Each of the 11 process items was significantly associated with the mean decision satisfaction score (Table 1), but in multi-variate analysis, five items remained significant (Table4): the doctor explained all possible options, the patient was aware of
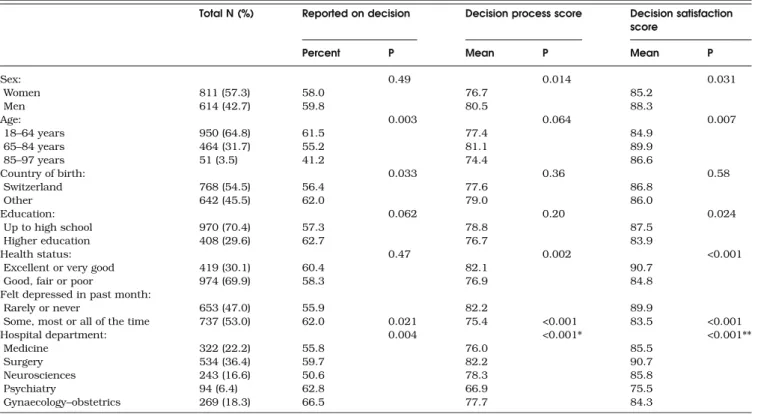
Table 3. Characteristics of Survey Participants, Proportions Who Reported a Medical Decision During Their Hospital Stay, and Mean Decision Process Scores and Decision Satisfaction Scores
Total N (%) Reported on decision Decision process score Decision satisfaction score
Percent P Mean P Mean P
Sex: 0.49 0.014 0.031 Women 811 (57.3) 58.0 76.7 85.2 Men 614 (42.7) 59.8 80.5 88.3 Age: 0.003 0.064 0.007 18–64 years 950 (64.8) 61.5 77.4 84.9 65–84 years 464 (31.7) 55.2 81.1 89.9 85–97 years 51 (3.5) 41.2 74.4 86.6 Country of birth: 0.033 0.36 0.58 Switzerland 768 (54.5) 56.4 77.6 86.8 Other 642 (45.5) 62.0 79.0 86.0 Education: 0.062 0.20 0.024 Up to high school 970 (70.4) 57.3 78.8 87.5 Higher education 408 (29.6) 62.7 76.7 83.9 Health status: 0.47 0.002 <0.001
Excellent or very good 419 (30.1) 60.4 82.1 90.7
Good, fair or poor 974 (69.9) 58.3 76.9 84.8
Felt depressed in past month:
Rarely or never 653 (47.0) 55.9 82.2 89.9
Some, most or all of the time 737 (53.0) 62.0 0.021 75.4 <0.001 83.5 <0.001
Hospital department: 0.004 <0.001* <0.001** Medicine 322 (22.2) 55.8 76.0 85.5 Surgery 534 (36.4) 59.7 82.2 90.7 Neurosciences 243 (16.6) 50.6 78.3 85.8 Psychiatry 94 (6.4) 62.8 66.9 75.5 Gynaecology–obstetrics 269 (18.3) 66.5 77.7 84.3
* Scores for psychiatry significantly lower than those of surgery, neurosciences and gynaecology
** Scores for surgery significantly higher than those of medicine, psychiatry, and gynaecology; scores for neurosciences significantly higher than those of psychiatry
risks, the doctor’s explanations were easy to understand, the patient was involved in the decision as much as desired or more, and the patient was not pressured into the decision.
Shared Decision-Making
The patients’ perception of who made the decision was as follows: the doctor told the patient what should be done, without asking her/his opinion (87, 11.4%), the doctor enquired about the patient’s opinion, but ultimately made the decision (154, 20.3%), the doctor and the patient decided together (322, 42.4%), the patient made the decision, having obtained the doctor’s opinion (175, 23.0%), and the patient told the doctor what she/he wanted, without asking the doctor’s opinion (22, 2.9%). The pattern of the summary scores was concave, with the highest scores occurring when the decision was shared between patient and doctor (Fig.1).
Subgroup Comparisons
Decision process scores were significantly higher among men, older patients, those in better health, those who were not depressed, and in patients discharged from the department of surgery (Table3). These results were essentially unchanged in multivariate analysis, but the differences by sex and age became non-significant (not shown). The univariate results were similar for the decision satisfaction score, with the added significant difference between the less and the more educated. Here too multivariate analysis confirmed these results, and the sex difference became non-significant (not shown).
Associations with Global Satisfaction
Both scores were associated with the global rating of hospital care between “poor” and “excellent.” In ordinal logistic regression
analysis, we just observed the association, in an ordinal logistic regression analysis a difference of one standard deviation of the process score was associated with an odds ratio of 2.4 (95% confidence interval 2.1– 2.8) of a higher global rating, and one standard deviation of the decision satisfaction score with an odds ratio of 2.6 (95% confidence interval 2.2– 3.0). Both associations remained statistically significant after adjustment for one another. Table 4. Multivariate Model Relating Process Variables and the Decision Satisfaction Score
Difference in decision satisfaction score
Process variable Response Adjusted
difference
95% confidence interval
P value
Doctor explained all possible treatments and examinations
Yes, completely 12.6 7.8 to 17.5 <0.001
Yes, in part 4.5 −0.7 to 9.5
No Reference
Only one possibility 12.9 7.4 to 18.4
Patient was aware of risks Yes, completely 10.7 6.2 to 15.2 <0.001
Yes, in part 4.0 −0.6 to 8.5
No Reference
Did not want to know 16.1 8.1 to 24.0
Doctor’s explanations were easy to understand Very easy 20.1 14.1 to 26.2 <0.001
Rather easy 14.9 8.9 to 20.8
No, difficult Reference
Patient was involved in decision More than wanted 14.6 9.8 to 19.5 <0.001
As much as wanted 12.1 8.0 to 16.1
Less than wanted Reference
Did not want to participate 14.1 8.5 to 19.7
Patient was pressured into decision Yes, a lot Reference <0.001
Yes, a little 0.7 −5.7 to 7.1
No 12.2 6.6 to 17.7
Who made the decision
patient mostly patient alone shared doctor mostly doctor alone Mean score 100 90 80 70 60 50
Figure 1. Mean decision process (dark gray) and decision satis-faction (light gray) scores, across the patient’s perception of who made the decision. Differences between groups globally signifi-cant for both scores (ANOVA: p-value <0.001). Post hoc
compar-isons for decision process score: mean of“doctor alone” significantly lower than all others, and“mostly doctor” significantly
lower than“mostly patient” and “patient alone”. For the decision satisfaction score, means of“doctor alone” and “mostly doctor”
DISCUSSION
More than half of the patients discharged from hospital identified a medical decision that was made during the hospital stay. According to patient reports, the decision-making process was globally in conformity with current expert opinions.1–5,14,30Most
respondents gave positive ratings to the decision that was reached; only few conveyed negative feelings through their responses. A shared decision-making approach led to the highest scores for both the process and decision evaluation of the decision-making. Both scores were also predictive of a more favourable assessment of the hospital stay.
According to our observations, a decision that the patient will be satisfied with requires explanations that are easy to under-stand, covering all options available to the patient as well as risks. Furthermore, a good decision requires patient involvement to the level desired, and absence of pressure into the decision. These empirical findings provide a solid support to experts’ opinions about the ingredients of appropriate decision-making. The association between process and outcome suggests that satis-faction with the decision is not only a consequence of low expectations (but as we did not measure expectations, we cannot assess the impact of this variable directly).
Only one finding was contrary to experts’ opinions: involving the patient more than he or she wanted had a positive effect on the global satisfaction. Possibly, some patients interpreted “more than I wanted” to mean “exceeding my initial expecta-tions”, rather than “too much”. If so, a more explicit wording of this item may be warranted. Alternatively, some patients do not know in advance how much involvement they would want, and realize in retrospect that greater involvement was a good thing. The finding that being involved“more than preferred” was associated with higher satisfaction than being involved “less than preferred” has been observed previously.35
Our study also confirms that the patient’s perception of shared decision-making is associated with the highest ratings of the decision. That process scores should be high for shared decision-making is in part tautological, since the process score gives high marks to the exchange of information and to the active involvement of the patient. However, the same cannot be said of the decision satisfaction score, which is not predicated on any type of process. Our results support shared decision-making as the preferable model for most patients.36,37
Other findings deserve comment. The prevalence of recalled decision-making appears to be low at 58.8%. Studies conducted in ambulatory settings typically identified several decisions made during a single visit.13,14,16It is likely that even more decisions are made during a hospital stay. Some patients may be unaware that decisions are made repeatedly, believing instead that their care is a sequence of pre-determined steps. Unless the doctor brings the decision to the patient’s attention, the patient may never realise that several courses of action were possible. That older patients, who are more likely to prefer a doctor-centred decision-making style, were less likely to report a medical decision is consistent with this hypothesis. However, incomplete or selective recall remains a possibility.
Patient reports of decision-making process were more favourable than we anticipated based on previous descriptive studies. For each of the 11 process-related items, more than half of the respondents gave the most desirable answer, and one out of six rated all of these 11 elements at the highest level. Several caveats are in order. Firstly, patients who were not
involved in decisions may have skipped this section of the questionnaire. Secondly, given that for most patients several decisions were made in the hospital, respondents may have focused on the decision for which the process was the most explicit, and which therefore conformed best with current standards. Thirdly, patient opinion surveys tend to produce globally positive ratings. Finally, the moderate response rate raises the possibility that patients who were more satisfied with decision-making were also more likely to participate. Thus both selection bias and information bias may have contributed to the globally favourable findings.
This study was based on an unselected large sample of patients discharged from a general hospital. However, only one hospital was involved, and it remains unclear whether the results that we observed are applicable to other hospitals, particularly to hospitals in other cultural contexts, where both the doctors’ approaches to medical decision-making and the patients’ expectations in this area may differ.
Another limitation is the lack of a precise description of the decision discussed by the respondent. This was tried in pre-tests, but the responses that we obtained were too heterogeneous and the idea was abandoned. This limits the interpretability of the results. Furthermore, we only collected patients’ perceptions, with no corroborating evidence from the doctor. Finally, all limitations of self-report, such as imperfect memory and social desirability bias, apply to our results as well.
While not a specific goal of this study, a useful by-product is the development of two scales that allow the patient to evaluate the process and the outcome of medical decision-making. Both scales had good internal consistency. Their validity is sup-ported by the associations between process items and decision satisfaction scores, and vice versa (Tables1and2). However, a more extensive validation of these scales is advisable. In particular, measurement of the outcome of decision-making is challenging, as satisfaction with the decision may be high when the patient’s expectations are low, and may decrease when more extensive information about available options causes discomfort or decisional conflict.
In conclusion, our results indicate that decision-making in a general hospital is globally satisfactory, though several areas for improvement exist, and provide an empirical confirmation of expert opinions about the desirable features of medical decision-making.
Acknowledgment: Project funded by the Quality Program, Univer-sity Hospitals of Geneva.
Veronique Kolly, RN, helped with pre-tests and organized the data collection.
Grant Support: None.
Contributors: TP, ACB and AP contributed to the conception of the study and the interpretation of results. TP and ACB developed and pre-tested the survey instrument. TP supervised data collection, conducted the analyses and wrote the first draft, which ACB and AP revised for substantive content. All authors approve the final content.
Conflict of Interest: None disclosed.
Corresponding Author: Thomas V. Perneger, MD, PhD; Division of Clinical Epidemiology, University Hospitals of Geneva, Geneva, Switzerland (e-mail: thomas.perneger@hcuge.ch).
REFERENCES
1. Charles C, Gafni A, Whelan T. Decision-making in the physician-patient encounter: revisiting the shared treatment decision-making model. Soc Sci Med. 1999;49:651–61.
2. Laine C, Davidoff F. Patient centered medicine. A professional evolution. JAMA. 1996;275:152–6.
3. Say R, Murtagh M, Thomson R. Patients’ preference for involvement in
medical decision making: a narrative review. Patient Educ Couns.
2006;60:102–114.
4. Guadagnoli E, Ward P. Patient participation in decision-making. Soc Sci
Med. 1998;47:329–39.
5. Woolf SH, Chan ECY, Harris R, Sheridan SL, Braddock CH, Kaplan RM, Krist A, O’Connor A, Tunis S. Promoting informed choice: transforming health care to dispense knowledge for decision making. Ann Intern Med. 2005;143:293–300.
6. Mazur DJ, Hickam DH. Patients’ preferences for risk disclosure and role
in decision making for invasive medical procedures. J Gen Intern Med.
1997;12:114–7.
7. McGuire AL, McCullough LB, Weller SC, Whitney SN. Missed
expecta-tions? Physicians’ views of patients’ participation in medical
decision-making. Med Care. 2005;43:466–70.
8. Kaplan SH, Greenfield S, Gandek B, Rogers WH, Ware JE. Character-istics of physicians with participatory decision making styles. Ann Intern Med. 1996;124:497–504.
9. Golin C, DiMatteo MR, Duan N, Leake B, Gelberg L. Impoverished diabetic patients whose doctors facilitate their participation in medical decision making are more satisfied with their care. J Gen Intern Med.
2002;17:866–75.
10. Clever SL, Ford DE, Rubenstein LV, Rost KM, Meredith LS, Sherbourne
CD, Wang NY, Arbelaez JJ, Cooper LA. Primary care patients’ involvement
in decision making is associated with improvement in depression. Med
Care. 2006;44:398–405.
11. Hack TF, Degner LF, Watson P, Sinha L. Do patients benefit from participating in medical decision making? Longitudinal follow-up of women with breast cancer. Psychooncology. 2006;15:9–19.
12. Gotler RS, Flocke SA, Goodwin MA, Zyzanski SJ, Murray TH, Stange KC. Facilitating participatory decision making. What happens in
real-world community practice? Med Care. 2000;38:1200–9.
13. Braddock CH, Fihn SD, Levinson W, Jonsen AR, Pearlman RA. How doctors and patients discuss routine clinical decisions. J Gen Intern
Med. 1997;12:339–45.
14. Braddock CH, Edwards KA, Hasenberg NM, Laidley TL, Levinson W. Informed decision making in outpatient practice. Time to get back to basics. JAMA. 1999;282:2313–20.
15. Street RL, Gordon HS, Ward MM, Krupat E, Kravitz RL. Patient participation in medical consultations. Why some patients are more
involved than others. Med Care. 2005;43:960–9.
16. Ford S, Schofield T, Hope T. Observing decision-making in the general practice consultation: who makes which decisions? Health Expectations.
2006;9:130–7.
17. Entwistle VA, Watt IS, Gilhooly K, Bugge C, Haites N, Walker AE.
Assessing patients’ participation and quality of decision-making:
insights from a study of routine practice in diverse settings. Patient
Educ Couns. 2004;55:105–13.
18. Skea Z, Harry V, Bhattacharya S, Entwistle V, Williams B, MacLennan
G, Templeton A. Women’s perceptions of decision-making about
hyster-ectomy. BJOG. 2004;111:133–42.
19. Strull WM, Lo B, Charles G. Do patients want to participate in medical
decision making? JAMA. 1984;252:2990–4.
20. Katz SJ, Lantz PM, Janz NK, Fagerlin A, Schwartz K, Liu L, Deapen D, Salem B, Lakhani I, Morrow M. Patient involvement in surgery
treatment decisions for breast cancer. J Clin Oncol. 2005;23:5526–33.
21. Man-Son-Hing M, Laupacis A, O’Connor A, Biggs J, Drake E, Yetisir
E, Hart RG. A patient decision aid regarding antithrombotic therapy for stroke prevention in atrial fibrillation. A randomized controlled trial.
JAMA. 1999;282:737–43.
22. Perneger TV, Chamot A, Bovier PA. Non-response bias in a survey of
patient perceptions of hospital care. Med Care. 2005;43:374–80.
23. Agoritsas T, Bovier PA, Perneger TV. Patient reports of undesirable
events during hospitalization. J Gen Intern Med. 2005;20:922–8.
24. Cleary PD, Edgman-Levitan S, Roberts M, Moloney TW, McMullen W, Walker JD, Delbanco TL. Patients evaluate their hospital care: a
national survey. Health Aff (Milwood). 1991;10:254–67.
25. Jenkinson C, Stewart-Brown S, Petersen S, Paice C. Assessment of the SF-36 version 2 in the United Kingdom. J Epidemiol Community Health. 1999;53:46–50.
26. Leplège A, Ecosse E, Verdier A, Perneger TV. The French SF-36 Health Survey: translation, cultural adaptation, and preliminary psychometric
evaluation. J Clin Epidemiol. 1998;51:1013–23.
27. Elwyn G, Edwards A, Mowle S, Wensing M, Wilkinson C, Kinnersley P, Grol R. Measuring the involvement of patients in shared decision-making: a systematic review of instruments. Patient Educ Couns.
2001;43:5–22.
28. Elwyn G, Edwards A, Hood K, Roblling M, Atwell C, Holmes-Rovner
M, Kinnersley P, Houston H, Russell I. The development of COMRADE–
a patient-based outcome measure to evaluate the effectiveness of risk communication and treatment decision making in consultations. Patient
Educ Couns. 2003;50:311–22.
29. O’Connor A. Validation of a decisional conflict scale. Med Decis Making.
1995;15:25–30.
30. Elwyn G, Edwards A, Wensing M, Hood K, Atwell C, Grol R. Shared decision making: developing the OPTION scale for measuring patient
involvement. Qual Saf Health Care. 2003;12:93–99.
31. Degner LF, Kristjanson LJ, Bowman D, Sloan JA, Carriere KC, O’Neill
J, Bilodeau B, Watson P, Mueller P. Information needs and decisional preferences in women with breast cancer. JAMA. 1997;277:1485–92.
32. Chamot E, Charvet A, Perneger TV. Women’s preferences for doctor’s
involvement in decisions about mammography screening. Med Decis
Making. 2004;24:379–85.
33. Brehaut JC, O’Connor A, Wood TJ, Hack TF, Siminoff L, Gordon E, Feldman-Stewart D. Validation of a decision regret scale. Med Decis
Making. 2003;23:281–91.
34. Holmes-Rovner M, Kroll J, Schmitt N, Rovner DR, Breer ML, Rothert ML, Padonu G, Talarczyk G. Patient satisfaction with health care decisions: the Satisfaction with Decision Scale. Med Decis Making.
1996;16:58–64.
35. Taylor HA. Barriers to informed consent. Sem Oncol Nurs. 1999;15:89– 95.
36. Lanz PM, Janz NK, Fagerlin A, Schwartz K, Liu L, Lakhani I, Salem B, Katz SJ. Satisfaction with surgery outcomes and decision process in a population based sample of women with breast cancer. Health Serv Res.
2005;40:745–68.
37. Carlsen B, Aakvik A. Patient involvement in clinical decision making: the effect of GP attitude on patient satisfaction. Health Expect.