Nephrol Dial Transplant (1996) 11: 1582-1585
Original Article
IMephrology
Dialysis
Transplantation
Pharmacokinetics of antimicrobial agents in anuric patients during
continuous venovenous haemofiltration
B. Joos, M. Schmidli and G. Keusch
Department of Medicine, University Hospital, Zurich, Switzerland
Abstract
Background. The optimal drug dosing in anuric patients undergoing continuous haemofiltration is a difficult task. More pharmacokinetic data is needed to derive practical guidelines for dosage adjustments. Methods. Drug elimination of various antimicrobial agents (amikacin, amoxycillin, ceftazidime, ciproflox-acin, flucloxacillin, imipenem, netilmicin, penicillin G, piperacillin, sulphamethoxazole, tobramycin, vanco-mycin) was studied in 24 patients with acute renal failure treated by pump-assisted continuous venoven-ous haemofiltration (CVVH). Concentrations of serial blood and ultrafiltrate samples were determined by HPLC or by fluorescence polarization immunoassay. Total body clearance (CL) and haemofilter clearance (CLf) rates were determined by standard
model-independent equations. Data from published literature on fractions not bound to proteins (fu), non-renal drug
clearance fractions (Qo), and normal clearance values
(CLn) were used to derive a pharmacokinetic model,
taking into account drug removal by ultrafiltration and by non-renal clearance.
Results. A total of 37 treatment periods was studied. Blood flow through the haemofilters was lOOml/min resulting in an average ultrafiltrate flow rate (UFR) of 13.2 + 4.6 (range 3.2-22.1) ml/min. Acceptable cor-relations of calculated and measured haemofilter clear-ances and total body clearclear-ances were obtained. Conclusions. Total body clearance in anuric patients during CVVH is predictable from drug properties, which are generally known. The individual dosage requirements may be calculated by multiplying Qo + fu' UFR/CLn with the dose considered
appro-priate in the absence of renal impairment.
Key words: acute renal failure; antimicrobial agents; continuous venovenous haemofiltration; drug dosage; pharmacokinetics
Correspondence and offprint requests to: Dr Beda Joos, Division of Infectious Diseases, Department of Medicine, University Hospital Zurich, CH-8091 Zurich, Switzerland.
Introduction
Continuous haemofiltration is a well-established tool in the treatment of patients with renal failure. However, despite good control of uraemia, acute renal failure is often associated with a high mortality rate [1]. Septicaemia frequently complicates the disease progres-sion, and it has been identified as a major predictor of a poor outcome. Optimal drug dosing is thus essential in this situation but pharmacokinetic data during con-tinuous renal replacement therapy are scarce. Complex mathematical models have been proposed [2,3], but their application in clinical practice is limited. The current methods to estimate drug removal through the haemofilter rely on sieving coefficients, i.e. average filtrate to blood concentration ratios [2-5]. These values, however, must be determined previously for each drug.
The aim of this study is to investigate the pharmaco-kinetics of various antimicrobial agents in patients with acute renal failure undergoing pump-assisted con-tinuous venovenous haemofiltration (CVVH) and to derive practical guidelines for dosage adjustments.
Subjects and methods
Selection of patients
Anuric patients undergoing continuous renal replacement therapy and receiving antimicrobial chemotherapy were con-sidered eligible for inclusion in the study. Drug clearance rates were measured during the C W H in a total of 24 patients with acute renal failure due to various causes.
Haemofiltration
Pump-assisted C W H was performed by a double-lumen subclavian catheter [1]. Blood flow through the polyamide hollow-fibre membrane filters (Gambro FH66) was set at 100 ml/min. The replacement fluid (Ringer's lactate) was administered in pre-dilution or post-dilution mode. The ultrafiltrate flow rate (UFR) was continuously monitored throughout treatment.
Pharmacokinetics during C W H
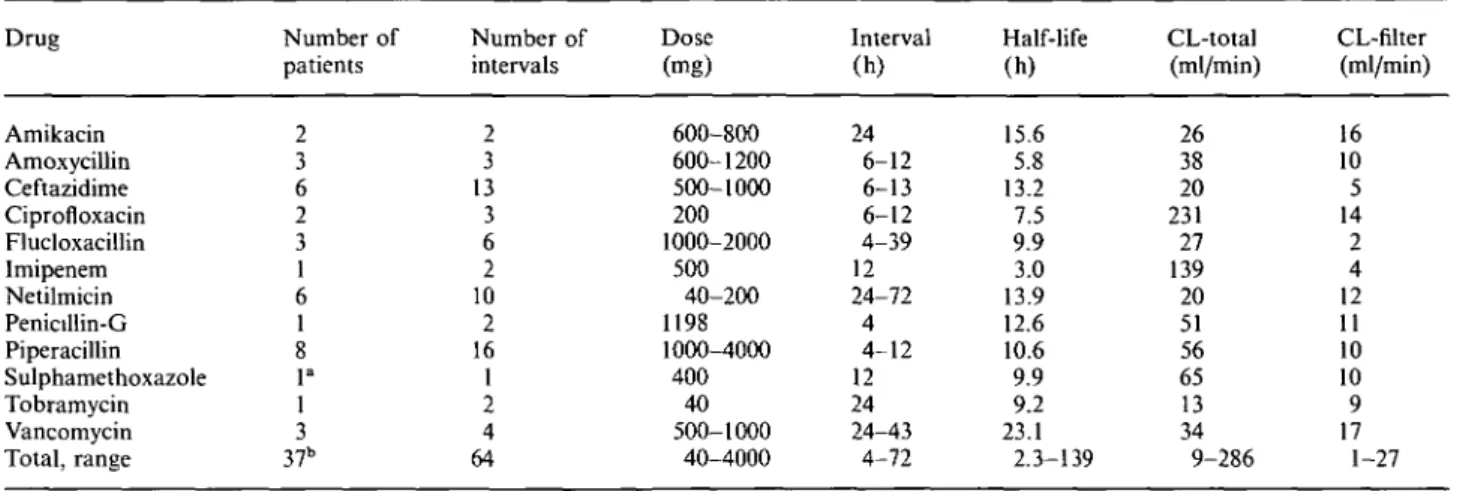
Table 1. Dosage and median pharmacokinetic parameters observed in 24 patients during continuous venovenous haemofUtration
1583 Drug Amikacin Amoxycillin Ceftazidime Ciprofloxacin Flucloxacillin Imipenem Netilmicin Penicillin-G Piperacillin Sulphamethoxazole Tobramycin Vancomycin Total, range Number of patients 2 3 6 2 3 1 6 1 8 V 1 3 37b Number of intervals 2 3 13 3 6 2 10 2 16 1 2 4 64 Dose (mg) 600-800 600-1200 500-1000 200 1000-2000 500 40-200 1198 1000-4000 400 40 500-1000 40-4000 Interval (h) 24 6-12 6-13 6-12 4-39 12 24-72 4 4-12 12 24 24-43 4-72 Half-life (h) 15.6 5.8 13.2 7.5 9.9 3.0 13.9 12.6 10.6 9.9 9.2 23.1 2.3-139 CL-total (ml/min) 26 38 20 231 27 139 20 51 56 65 13 34 9-286 CL-filter (ml/min) 16 10 5 14 2 4 12 11 10 10 9 17 1-27
a Trimethoprim concentrations in haemofiltrate were below the limit of detection (<0.2 mg/1) in this patient. b
Therapy consisted of 1—3 different drugs in individual patients, resulting in a total of 37 treatment periods.
Dosage and administration
Antibiotics were administered intravenously either alone or in combination (Table 1). The choice of antimicrobial therapy for each patient was based on clinical judgement only. The dosing interval was chosen according to the presumed half-life of the respective drug.
Up to three different drugs were administered to each patient during the study, resulting in a total of 37 evaluable treatment periods. In many cases, several subsequent dosing intervals per drug and patient were studied (64 totally) in order to obtain more reliable data and to ensure that a steady state was reached.
Specimen collection
Serial blood samples and pooled ultrafiltrate were obtained at various time points during the steady state. On the average, 11 + 7 specimens were collected during each of the 37 treat-ment periods. The optimal timing of sample collection was determined individually depending on the drug to be stud-ied and on the actual length of the dosing interval. Concentrations of imipenem were determined immediately due to its limited stability, while aminoglycoside and vanco-mycin levels were assayed within 24 h. All other serum and haemofiltrate samples were stored together with appropriate control standards at — 70°C for up to 3 months before being measured in batch.
Assay methods
Concentrations of beta-lactam antibiotics, ciprofloxacin, and sulphamethoxazole were determined by HPLC whereas the aminoglycosides and vancomycin were measured by a fluorescence polarization immunoassay (Abbott TDX).
Pharmacokinetic analysis
The timing of the doses, dosing intervals, duration of infu-sion, and the volume of the ultrafiltrate produced per time unit were recorded for each patient. A serum concentration versus time profile was plotted for each dosing interval and the area under the curve (AUC) was calculated by the
log-trapezoidal method. The amount of drug excreted through the haemofilter during one dosing interval was calculated from the volume of collected ultrafiltrate and the drug concentration in the ultrafiltrate. Standard model-inde-pendent equations were applied to calculate
total body clearance (CL = Dose/AUC) and filter clearance (excreted amount/AUC).
Selected drug properties such as protein binding (unbound fraction fu), non-renal drug clearance fraction (Qo), and
normal clearance values (CLn) were derived from published
literature [6-8] (Table 2).
Statistical methods
The correlations of calculated and measured clearances were determined by standardized principal component analysis [9], and by distribution independent regression analysis according to Passing and Bablok [10,11]. The latter model estimates confidence intervals for slope and intercept and tests for linearity by cusum statistics and by the run test. The performance of the prediction method was determined Table 2. Selected drug properties used to predict total body clearance and haemofilter clearance [6—8]
Drug Amikacin Amoxycillin Ceftazidime Ciprofloxacin Flucloxacillin Imipenem Netilmicin Penicillin-G Piperacillin Sulphamethoxazole Tobramycin Vancomycin Range 0.96 0.87 0.85 0.7 0.2 0.75 0.96 0.6 0.84 0.6 1.0 0.9 0.2-1.0 Qo8 0.02 0.06 0.05 0.5 0.3 0.3 0.01 0.08 0.25 0.8 0.02 0.05 0.01-0.8 (ml/min) 92 372 132 500 83 233 92 500 182 26 77 77 26-500 a
fu, unbound fraction; Qo, non-renal drug clearance fraction; CLn
1584 B. Joos et al.
by calculating bias and precision (root of mean squared differences) according to Sheiner and Beal [12].
Results
Twenty-four patients were included in the study. Approximately 50% of the patients experienced an acute renal failure due to various internal medical causes, e.g. septic shock, pneumonia, ARDS, pancreat-itis, hepatorenal syndrome. One-third of the patients suffered from postoperative acute renal failure follow-ing either renal transplantation, combined renal and pancreas transplantation, or cardiac surgery. The remaining patients had multiple traumatic lesions or traumatic brain injury. Half of the patients were on the internal and half on the surgical intensive care unit. All patients were attended by a nephrologist.
The antimicrobial therapy used consisted of 12 different antimicrobial agents given in a wide variety of dosages either alone or in combination (Table 1). Serum and nitrate kinetics were studied during a total of 37 treatments (64 dosing intervals). The aver-age ultrafiltrate flow rate was 13.2 ±4.6 ml/min (mean + SD, range 3.2-22.1).
Using the fundamental pharmacokinetic drug para-meters observed in individuals without renal failure (Table 2), a theoretical model was derived which could be used to predict the clearance values. The measured haemofilter clearances and total body clearances were in good agreement with fu-UFR and with
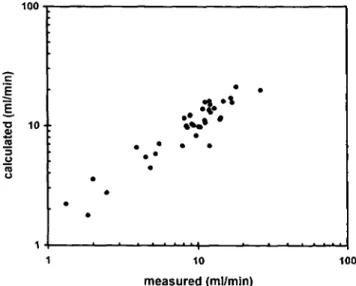
fu • UFR + Qo • Cln respectively. Figures 1 and 2
illus-trate the distribution of the observed values. The quantity fu • UFR was a good predictor of filter
clear-ance (Table 3). The majority of the measurements deviated by less than 15%. Total body clearance was underestimated by fu • UFR + Qo • Cln by an average of
7.6 ml/min. Deviations were <33%, however, in the majority of the 37 treatment periods.
100 1000 E
1
1
O 1 0 -100 measured (ml/min) 10 100 measured (ml/min) 1000Fig. 2. Measured and calculated total body clearance rates of 12
different drugs during continuous venovenous haemofiltration (calcu-lated values were obtained from fu-UFR + Q0-CLn).
Table 3. Comparison of measured and calculated haemofilter
clear-ance and total body clearclear-ance values during 37 treatment periods Method Filter clearance"
Predictive performance [12]: bias (ml/min)
precision (rmseb)
0.6 (-0.2, 1.4) 2.4(1.7, 3.0) Standardized principal component analysis [9]:
slope
y-intercept (ml/min) 0.94
1.3
Distribution-independent regression analysis [10, slope0 y-interceptc (ml/min) 1.04(0.87, 1.24) 0.56 (-1.3, 2.0) Total clearance8 -7.6 (-16.4, 1.1) 27.0(14.0, 35.6) 1.03 -8.9 11]: 0.81 (0.57, 1.05) -2.0 (-9.9, 5.7)
Fig. 1. Measured and calculated haemofilter clearance rates of 12
different drugs during continuous venovenous haemofiltration (calcu-lated values were obtained from fu-UFR).
* 95% confidence intervals are indicated in parentheses.
b
Root of mean squared prediction error.
c
No statistically significant differences of slopes from 1 or of intercepts from 0 (P<0.05) and no significant deviation from linearity as determined by the cusum and run tests (P>0.1).
Comparison of the measured and calculated values for both haemofilter and total body clearance by distribution-independent linear regression analysis yielded slopes of approximately 1 and y-intercepts near 0 ml/min (Table 3). No significant deviation from lin-earity was found by the cusum and run tests (P>0.\).
Discussion
The existing mathematical models used to estimate drug elimination during continuous renal replacement therapy have recently been reviewed by Reetze-Bonorden et al. [5]. Sieving coefficients are frequently used to characterize the ability of a drug to pass through the haemofilter membrane. These values,
how-Pharmacokinetics during CVVH
ever, have not been measured for all drugs used in patients with acute renal failure.
The approach presented in this study has the advant-age that all parameters needed to estimate drug clear-ance are readily available. The convective transport from blood to ultrafiltrate was calculated from ultrafil-trate flow rate and unbound fraction alone, and the non-renal clearance was assumed to be the same as in patients without renal impairment. This simple model is far from being perfect. It is evident that protein binding may be altered in anuric patients and non-renal elimination may be impaired in these severely ill patients. Moreover, possible interactions due to mul-tiple drug therapy may be responsible for pharmaco-kinetic alterations. It is conceivable also that a reduced hepatic clearance may be in part compensated by lower protein binding and consequently increased haemofilter clearance and vice versa.
Various statistical methods were used to compare predicted with measured haemofilter and total body clearances. Evaluation of predictive performance [12] has become usual practice; however, this method demands an independent variable presumed to be free of experimental error. Standardized principal compon-ent analysis [9] is a multivariate procedure, but normal distribution of the values is required. Regression ana-lysis, according to Passing and Bablok [10,11], may overcome these drawbacks since it does not depend on an error-free variable or on rigid distributional require-ments. In addition, this procedure tests for a linear relationship between the two variables, confidence limits are given for the slope and the intercept, and the influence of outliers is minimized.
The 12 drugs studied exhibited marked differences in their protein binding as well as in their non-renal contribution to total clearance. In addition wide ranges of dose, dosing intervals, and ultrafiltration rates were covered. Nevertheless in most patients the proposed formula fu • UFR + Qo • CLn provided a reliable estimate
of the total drug clearance. The individual dosage requirements may be calculated in proportion to the ratio of total body clearance observed during CVVH and the normal clearance rate found in patients without renal impairment. Consequently the following formula may be used to predict the maintenance dose during renal replacement therapy.
Dose = Dn-(Q0 + fu-UFR/CLn)
where Dn denotes normal dose, CLn normal clearance,
Qo non-renal clearance fraction, fu unbound fraction,
and UFR ultrafiltrate flow rate.
In conclusion, the results of the present study allow practical dosage recommendations to be made for
1585
anuric patients undergoing C W H . Most drugs used in clinical practice have relatively low molecular weights, so that similar mechanisms of clearance during C W H would be expected. It is therefore anticipated that the same dosage calculations will also be appro-priate for the majority of other therapeutic agents. Monitoring serum concentrations, however, remains mandatory when using drugs which possess a narrow therapeutic range. Prospective studies are needed to evaluate the efficiency of these dosage guidelines and to study specifically whether the desired drug concen-trations are achieved.
Acknowledgements. The authors thank the nursing staff of the
medical intensive care unit of the University Hospital Zurich for their invaluable assistance, and Peter Gowland for his helpful review of this manuscript.
References
1. Keusch G, Schreier P, Binswanger U. Outcome in critically ill patients with acute renal failure treated by continuous hemo-filtration. Contrib Nephrol 1991; 93: 57-60
2. Vincent HH, van Ittersum FJ, Akcahuseyin E, Vos MC, van Duyl WA, Schalekamp MA. Solute transport in continuous arteriovenous hemodiafiltration: a new mathematical model applied to clinical data. Blood Purif 1990; 8: 149-159
3. Kroh UF, Dehne M, El Abed K, Feussner KD, Hofmann W, Lennartz H. Drug dosage during continuous hemofiltration: pharmacokinetics and practical implications. Contrib Nephrol 1991; 93: 127-130
4. Golper TA, Wedel SK, Kaplan AA, Saad AM, Donta ST, Paganini EP. Drug removal during continuous arteriovenous hemofiltration: theory and clinical observations. Int J Artif
Organs 1985; 8: 307-312
5. Reetze-Bonorden P, Bohler J, Keller E. Drug dosage in patients during continuous renal replacement therapy. Pharmacokinetic and therapeutic considerations. Clin Pharmacokinet 1993; 24: 362-379
6. Vozeh S, Schmidlin O, Taeschner W. Pharmacokinetic drug data. Clin Pharmacokinet 1988; 15: 254-282
7. Dettli L. Pharmakokinetische Daten filr die Dosisanpassung. In: Arzneimittel - Kompendium der Schweiz, Registerband. Documed, Basel, 1990: 331-340
8. Walther H, Meyer FP. Klinische Pharmakologie anlibakterieller
Arzneimittel. Urban & Schwarzenberg, Munchen, 1987
9. Feldmann U, Schneider B, Klinkers H, Haeckel R. A multivari-ate approach for the biometric comparison of analytical methods in clinical chemistry. J Clin Chem Clm Biochem 1981; 19: 121 -137 10. Passing H, Bablok W. A new biometrical procedure for testing the equality of measurements from two different analytical methods. Application of linear regression procedures for method comparison studies in clinical chemistry, Part I. J Clin Chem
Clin Biochem 1983; 21: 709-720
11. Passing H, Bablok W. Comparison of several regression proced-ures for method comparison studies and determination of sample sizes. Application of linear regression procedures for method comparison studies in clinical chemistry, Part II. J Clin Chem
Clin Biochem 1984; 22: 431-445
12. Sheiner LB, Beal SL. Some suggestions for measuring predictive performance. J Pharmacokinet Biopharm 1981; 9: 503-512
Received for publication: 22.1.96 Accepted in revised form: 2.4.96