Abstract. The CT data acquired in combined PET/CT studies provide a fast and essentially noiseless source for the correction of photon attenuation in PET emission data. To this end, the CT values relating to attenuation of pho-tons in the range of 40–140 keV must be transformed into linear attenuation coefficients at the PET energy of 511 keV. As attenuation depends on photon energy and the absorbing material, an accurate theoretical relation cannot be devised. The transformation implemented in the Dis-covery LS PET/CT scanner (GE Medical Systems, Mil-waukee, Wis.) uses a bilinear function based on the atten-uation of water and cortical bone at the CT and PET ener-gies. The purpose of this study was to compare this trans-formation with experimental CT values and corresponding PET attenuation coefficients. In 14 patients, quantitative PET attenuation maps were calculated from germanium-68 transmission scans, and resolution-matched CT images were generated. A total of 114 volumes of interest were defined and the average PET attenuation coefficients and CT values measured. From the CT values the predicted PET attenuation coefficients were calculated using the bi-linear transformation. When the transformation was based on the narrow-beam attenuation coefficient of water at 511 keV (0.096 cm–1), the predicted attenuation coeffi-cients were higher in soft tissue than the measured values. This bias was reduced by replacing 0.096 cm–1 in the transformation by the linear attenuation coefficient of 0.093 cm–1 obtained from germanium-68 transmission scans. An analysis of the corrected emission activities shows that the resulting transformation is essentially equivalent to the transmission-based attenuation correc-tion for human tissue. For non-human material, however, it may assign inaccurate attenuation coefficients which will also affect the correction in neighbouring tissue.
Keywords: PET – CT – Attenuation correction – Attenu-ation Coefficient – Metallic implant
Eur J Nucl Med (2002) 29:922–927 DOI 10.1007/s00259-002-0796-3
Introduction
The combination of a positron emission tomograph (PET) and an X-ray computer tomograph (CT) into a single scanner has several advantages. Such a PET/CT scanner allows acquisition of functional PET and ana-tomical CT data in one session without moving the pa-tient and with minimal delay between the image data sets. The two image sets are perfectly co-registered, and thus the functional PET images and the anatomical CT images can be jointly reviewed. In addition, the CT im-ages can be used to derive information for the correction of the PET emission data. CT images portray the attenu-ation properties of the tissue in the field of view for pho-tons at the CT energies. While photon attenuation gov-erns image contrast for CT, it causes severe distortions in PET images if not corrected for. For instance, only about 5% of the 511-keV PET emission photons from the cen-tre of the body can be detected [1]; the others are ab-sorbed in the tissue. PET attenuation correction is straightforward and accurate [2], if the distribution of at-tenuation coefficients in the tissue is known.
Traditionally, the attenuation coefficients are mea-sured in an additional PET transmission scan. However, the transmission scan adds at least 50% to scanning time and results in data with a relatively high noise level. When these data are used for corrections, they propagate the noise into the emission images. In a combined PET/CT environment, therefore, it makes sense to re-place the PET transmission scan by attenuation informa-tion derived from the CT images. To this end a transfor-C. Burger (
✉
)Nuclear Medicine, University Hospital, Rämistrasse 100, 8091 Zurich, Switzerland e-mail: [email protected]
Tel.: +41-1-2554015, Fax: +41-1-2554414
Original article
PET attenuation coefficients from CT images:
experimental evaluation of the transformation of CT
into PET 511-keV attenuation coefficients
C. Burger1, G. Goerres1, S. Schoenes1, A. Buck1, A.H.R. Lonn2, G.K. von Schulthess1 1Nuclear Medicine, University Hospital, Rämistrasse 100, 8091 Zurich, Switzerland
2G.E. Medical Systems Limited, Slough, UK
Received 1 December 2001 and in revised form 9 February 2002 / Published online: 19 April 2002 © Springer-Verlag 2002
mation of the CT values into PET attenuation coeffi-cients is needed. To do this successfully, several facts must be considered. The attenuation of a given material depends on its effective atomic number and its density as well as the photon energy [3]. In CT, the attenuation measurement is based on a spectrum of photons from 40 keV to 140 keV, while the PET attenuation measure-ments use almost monochromatic 511-keV photons. Kinahan et al. [4] discussed several approaches for the transformation of CT into PET attenuation data, includ-ing a global scalinclud-ing of the CT numbers assuminclud-ing an av-erage photon energy of 70 keV, segmentation of the CT images into different tissue types and assignment of pre-defined attenuation coefficients, and a hybrid method which applies different scaling factors to soft tissues and tissue with CT values above 200 Hounsfield units (HU) representing bone structures [5]. While their work was based on phantom studies, the aim of this study was to directly compare PET attenuation coefficients and CT values measured in combined PET/CT patient studies. Based on these data, the approach for CT-based attenua-tion correcattenua-tion in the Discovery LS PET/CT scanner (GE Medical Systems, Milwaukee, Wis.) was evaluated.
Materials and methods
Clinical acquisitions. We used the data of 14 oncological patients
who underwent a clinical fluorine-18 fluorodeoxyglucose (FDG) study on a combined PET/CT system (GE Discovery LS) with the following clinical protocol: At 45–55 min post injection of FDG, a CT scan was performed from the head to the pelvic floor (scan length 86.7 cm) with a Vmaxof 140 kV, 80 mA, 0.5 s tube rotation time, pitch 6, and 5-mm slice thickness. Immediately after CT scanning, a PET emission scan was obtained covering the same axial field of view (FOV). Acquisition time was 4 min at each of the six table positions. Then, a transmission scan was performed with two germanium-68 rod sources with 2 min per table position.
Data processing. Quantitative images of the linear attenuation
co-efficient at 511 keV [µ(511 keV) (cm–1), µ-maps] were obtained as
a by-product of the segmented attenuation correction step in emis-sion image reconstruction with the standard GE software. These µ-maps are calculated by filtered back-projection of the transmission sinograms after prior planar smoothing with an 8-mm Gaussian filter, and would in later processing steps be used as the input for the segmentation algorithm. The µ-maps covered the full PET FOV of 550 mm, and had a 4.25 mm slice thickness and a 128×128 image matrix with 4.3 mm pixel size. The reconstructed CT images were inherently aligned to the µ-maps, but initially had a smaller FOV of 497 mm and a 512×512 matrix. They were inter-polated to the pixel size of the µ-maps using the fusion tool within the PMOD software [6] (PMOD Group, Zurich, Switzerland; www.pmod.com). The resulting 128×128 CT images were then smoothed by a three-dimensional Gaussian filter with 12 mm full-width at half-maximum (FWHM) in-plane and 5 mm FWHM axi-ally to match them to the spatial resolution of the transmission da-ta. Volumes of interest (VOI) were manually defined on different tissues such as brain, lung, fat, liver, muscle, bone and skull, and the average pixel value in Hounsfield units per VOI was
calculat-ed. The same VOIs were projected onto the corresponding µ-maps and the average regional PET attenuation coefficient in cm–1
cal-culated. A total of 114 polygonal VOIs were manually defined and evaluated in the 14 patient studies.
Adjustment of the CT spatial resolution to the µ-maps. A
com-bined PET/CT attenuation measurement of a single-photon emis-sion tomography (SPET) phantom (Data Spectrum Corp, Chapel Hill, N.C.) in two orthogonal orientations was performed. Except for prolonged transmission scanning of 10 min, the acquisition and reconstruction parameters were the same as described above. Gaussian filters with FWHM ranging from 8 mm to 16 mm were applied to the CT images and the smoothed images displayed to-gether with the PET µ-maps. To compare the point spread function of the PET attenuation data and the CT data after smoothing a combined measurement was performed with a steel ball of 4 mm diameter in the centre of the field of view. Acquisition duration of the transmission measurement was prolonged to 10 h. A Gaussian filter with 12-mm FWHM in-plane and 5 mm axially was applied to the CT data, and profiles plotted through the centre of the ball.
Transformation of CT values to µ(511 keV) on the Discovery LS.
The software in the Discovery LS performed the following steps. CT images were first interpolated to the resolution of the PET pix-els. The CT values obtained were then transformed from Houns-field units to linear PET attenuation coefficients in cm–1by:
(1)
where the different µ represent the linear attenuation coefficients at the PET 511 keV energy and at the effective CT energy for wa-ter and bone. To dewa-termine the effective CT energy, a simulation of the CT measurement was performed for our particular scanner (data not shown). Assuming a patient attenuation equivalent to 300 mm of water yielded an effective CT energy of about 80 keV. The linear attenuation coefficients were initially calculated from the tables given by Hubbell and Seltzer [7], which list the narrow beam mass attenuation values for different substances over a large range of energies, resulting in:
(2)
The attenuation maps calculated from the CT data by Eq. 1 were forward projected according to the PET acquisition geometry. Fi-nally, the attenuation correction factors were obtained by exponen-tiation of the line integrals.
Experimental determination of PET attenuation coefficients. In an
attempt to obtain experimental values for the linear attenuation co-efficients better defined than in the in vivo situation, two types of phantom measurement were performed. The first phantom was a NEMA PET phantom (Data Spectrum Corp, Chapel Hill, N.C.) filled with water, containing a Teflon insert as well as a piece of femoral bone from a cow. The second phantom was a CT calibra-tion phantom (electron density phantom model 062, Computerized Imaging Reference Systems, Inc. Norfolk, Va.) normally used for quality control in radiation therapy. It included plugs of 3 cm
di-Fig. 1A–F. CT images and
matched PET attenuation maps.
A–C show images of a SPET
phantom containing rods of 5, 6.5, 8, 10, 11.5 and 13 mm di-ameter while D and E show pa-tient images. A and D are the original CT images. B and E are the CT images resampled to the PET pixel size and smoothed with a 3D Gaussian filter (12 mm×12 mm×5 mm).
C and F are the matched PET
ameter equivalent to tissues of different attenuation such as lung inhale, lung exhale, adipose, liver, muscle, breast, trabecular bone and dense bone. The dense bone plug had a 1 cm diameter only. Transmission scanning time was extended to 10 min; the other ac-quisition parameters remained as described above.
Results
The smoothed CT images derived from the resolution adjustment experiments with the Data Spectrum phan-tom were visually compared with the PET µ-maps. One example with an axially oriented phantom is shown in Fig. 1A–C. An approximate value of 12 mm FWHM was determined for the Gaussian smoothing filter to adjust the in-plane resolution of CT to the µ-maps. From imag-es with the phantom rods parallel to the slice orientation an axial smoothing of about 5 mm FWHM was derived. The profiles through the steel ball had an FWHM of 13.7 mm (13.3 mm) in-plane and 6.6 mm (7.8 mm)
axi-ally for the PET µ-maps and the smoothed CT data, re-spectively. As a consequence, the CT images were smoothed with a 12×12×5mm Gaussian filter before all VOI analyses.
The VOI averages of the attenuation coefficients for the patient data are shown in Fig. 2, together with the bi-linear function (1) describing the CT-to-µ(511 keV) transformation implemented in the Discovery LS. The VOIs were 15.5 ml on average (±11.6 ml), ranging from 3 ml for bone structures to 65 ml for brain. Using the narrow-beam value of 0.096 cm–1 for the transformation resulted in an obvious discrepancy with the measurements in the range 0 HU to 200 HU (Fig. 2A). Therefore, the transformation was modified to be based on the experimentally determined value measured with the NEMA phantom.
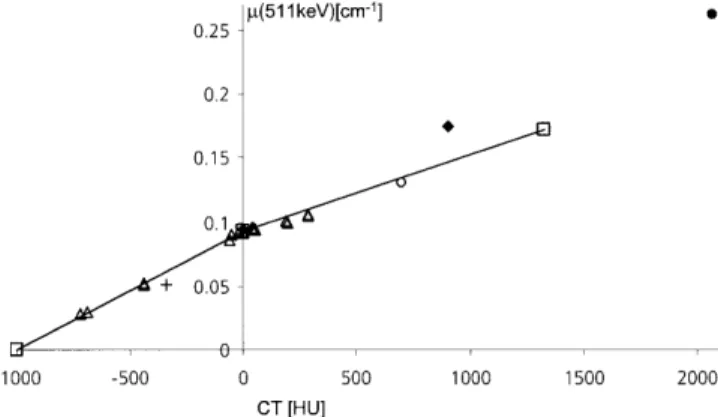
The results obtained in the phantom measurements are shown in Fig. 3. The tissue-equivalent materials from the radiation therapy phantom matched the transforma-tion functransforma-tion well except for the trabecular and cortical bone equivalents, which showed less attenuation in PET measurements than expected. A similar effect was seen for the data from the cortical regions of the bovine bone and for a support structure for the head-holder fixation made out of carbon fibre. On the other hand, the attenua-tion of 511-keV photons in the Teflon insert of the NEMA phantom and in a metallic implant in a patient study was higher than predicted.
Discussion
The aim of this study was to directly compare the attenu-ation data from PET transmission measurements with those from CT measurements. As illustrated in Fig. 1C Fig. 2. Scatter plots of the 114 VOI averages from 14 patients.
The values of the smoothed CT images are plotted versus the val-ues of the PET attenuation maps. The line represents the transfor-mation defined in Eq. 1 with A from narrow-beam experiments and B determined from PET transmission data
Fig. 3. Scatter plot of VOI averages in materials other than human
tissue. The open triangles represent lung inhale, lung exhale, adi-pose, breast, liver, muscle, trabecular and cortical bone from low to high attenuation values (two separate measurements each). The plus
sign represents a carbon fibre part of the table, the filled diamond
the Teflon insert of the NEMA phantom, the open circle trabecular cow bone and the filled circle a metallic implant in a patient
and F, the spatial resolution in the PET µ-maps is poor, giving rise to partial volume effects in the calculation of the VOI averages. In order to have the same effects hap-pen with CT, the high spatial resolution in the CT images had to be reduced to the resolution of the µ-maps. In phantom measurements, smoothing with a Gaussian fil-ter of 12×12×5 mm FWHM was found to give images with approximately matched spatial resolution. The actu-al use of CT in PET attenuation correction, however, would presumably require some adjustments in pre-pro-cessing due to slight differences in the PET emission and transmission geometries.
Initially the VOI averages calculated did not match well the bilinear transformation function (1) formed us-ing the narrow-beam attenuation coefficients from Eq. 2, especially in the soft tissue range 0 HU to 200 HU (Fig. 2A). Replacement of the narrow-beam value of (0.096 cm–1) by the experimental value of 0.093 cm–1 improved the agreement, as shown in Fig. 2B. The sum of squared residuals was thereby re-duced by 3.2%. This adjustment of the transformation was also supported by the quantitative PET emission ac-tivities obtained with both variants of the CT-based at-tenuation correction. Using resulted in ac-tivities which were significantly higher than the activi-ties obtained with the standard 68Ge-based segmented at-tenuation correction. When using , the over-estimation was reduced. A Bland-Altman analysis [8] of the corrected activities in 27 soft tissue VOIs of six patients showed that a residual bias remained, but that the values were within the calculated limits of agree-ment of 2.1 kBq/cc. A comparison between CT-based at-tenuation correction and segmented atat-tenuation correc-tion with these data yielded a regression slope of 0.93 (r2=0.994). This residual bias can to some extent be ex-plained by an effect reported by Visvikis et al. [9]. These authors evaluated the impact of segmentation and itera-tive reconstruction on attenuation correction with a GE Advance PET scanner, which is identical to the PET scanner in the Discovery LS used for this study. For 2-min transmission scans they found a regression slope of 0.96 when comparing SUV values obtained with seg-mented attenuation correction to values obtained without segmentation. The improvement achieved by using the empirical suggests that the effective attenuation seen by the PET transmission scan is lower than the attenuation occurring in narrow-beam experi-ments. A likely explanation for this reduced attenuation is the broad-beam acquisition geometry of PET event de-tection leading to some unremoved scatter components in the data. Therefore it seems to be more adequate to adjust the transformation accordingly rather than to pos-tulate a narrow-beam situation which is not met by the physical arrangement.
While the bilinear transformation seems sufficiently accurate for human tissue, it may not predict accurately
the attenuation coefficients of some non-human materi-als in the FOV. This is particularly the case for high Z materials, because photon interaction at the CT energies is primarily photoelectric (proportional to Z4), while at
the PET energy it is almost exclusively Compton scatter-ing with an electron density dependence. In such situa-tions, under- or over-correction of the neighbouring tis-sue activity will occur with CT-based attenuation correc-tion owing to the limited spatial resolucorrec-tion of PET. As shown in Fig. 3, PET attenuation would be underestimat-ed basunderestimat-ed on the CT measurement of the Teflon insert in the NEMA phantom and on the metallic insert in a pa-tient. To get an idea of the magnitude of the resulting un-der-correction, a vial of 0.9 cm diameter containing high activity was placed next to the Teflon insert. The CT cor-rected emission activity was decreased by 8.5% relative to the PET transmission corrected activity. The effect will be even more pronounced for metallic implants. In the example shown in Fig. 3, a PET attenuation coeffi-cient of 0.262 cm–1was measured, but the CT value was
only 2,070 HU whereas a value of 2,840 HU would be expected from Eq. 1. This reduction is likely due to the historical limitation of the dynamic CT range to 4,096 integer values covering –1,024 HU to 3,071 HU. Attenu-ation values higher than 3,071 HU are truncated, yield-ing distorted PET attenuation coefficients in addition to reconstruction artefacts. One remedy for this situation, which would also reduce the reconstruction artefacts, would be the use of an extended CT scale [10], which, however, is not yet implemented in the current genera-tion of commercial scanners. An even better solugenera-tion would combine the extended CT scale with a segmenta-tion approach whereby truncated or otherwise distorted CT numbers were replaced by adequate PET attenuation coefficients during the transformation.
In conclusion, a simple bilinear function to transform CT values into linear attenuation coefficients at 511 keV for PET attenuation correction seems adequate for hu-man tissue. To avoid over-correction of the emission ac-tivities in soft tissue, the apparent attenuation coefficient of water seen by the PET scanner should be employed when defining the transformation, rather than a value de-rived from narrow-beam experiments. The reconstructed activity around metallic implants must be interpreted with caution because of the inaccurate attenuation cor-rection caused by the truncation of the metal CT num-bers.
Acknowledgements. This work was supported in part by a grant
from GE Medical Systems. The authors would like to thank C. Stearns and S. Ross from GE Medical Systems for helpful discus-sions, and T. Berthold for technical assistance.
7. Hubbell JH, Seltzer SM. Tables of X-ray mass attenuation co-efficients and mass energy absorption coco-efficients from 1 keV to 20 MeV for elements Z =1 to 92 and 48 additional sub-stances of dosimetric interest. Gaithersburg: National Institute of Standards and Technology, 1996.
8. Bland MJ, Altman DG. Statistical methods for assessing agreement between two methods of clinical measurement.
Lancet 1986 I:307–310.
9. Visvikis D, Cheze-LeRest C, Costa DC, Bomanji J, Gacinovic S, Ell PJ. Influence of OSEM and segmented attenuation cor-rection in the calculation of standardised uptake values for [18F]FDG PET. Eur J Nucl Med 2001; 28:1326–1335.
10. Link TM, Berning W, Scherf S, Joosten U, Joist A, Engelke K, Daldrup Link HE. CT of metal implants: reduction of artifacts using an extended CT scale technique. J Comput Assist
Tomogr 2000; 24:165–172.
References
1. Jaszczak RJ, Hoffman ED. Positron emission tomography (PET): scatter and attenuation. In: Wagner HN, Szabo Z, Buchanan JW, eds. Principles of nuclear medicine, 2nd edn. Philadelphia: Saunders, 1995.
2. Bailey DL. Transmission scanning in emission tomography.
Eur J Nucl Med 1998; 25:774–787.
3. Kalender WA. Computertomographie – Grundlagen
Geräte-technologie, Bildqualität, Anwendungen. Publicis MCD, 2000.
4. Kinahan PE, Townsend DW, Beyer T, Sashin D. Attenuation correction for a combined 3D PET/CT scanner. Med Phys 1998; 25:2046–2053.
5. Beyer T, Kinahan PE, Townsend DW. The use of X-ray CT for attenuation correction of PET data. IEEE Nuclear Science
Sym-posium and Medical Imaging Conference. Norfolk, Va. 1994.
6. Mikolajczyk K, Szabatin M, Rudnicki P, Grodzki M, Burger C. A JAVA environment for medical image data analysis: initial ap-plication for brain PET quantitation. Med Inf 1998; 23:207–214.