ORIGINAL PAPER
Ectoparasite reproductive performance when host
condition varies
Shona Rueesch&Mélissa Lemoine&Heinz Richner
Received: 1 November 2011 / Accepted: 3 May 2012 / Published online: 22 May 2012 # Springer-Verlag 2012
Abstract Host condition can influence both the nutritive resources available to parasites and the strength of host defences. Since these factors are likely to be correlated, it is unclear whether parasites would be more successful on hosts in good, intermediate or poor conditions. For more complex parasites, like fleas, where larvae depend on adults to extract and make available some essential host resources, host condition can act at two levels. First, it can affect the investment of females into eggs, and second, it can influence offspring growth. In a two-step experiment, we first let female hen fleas Ceratophyllus gallinae feed on nestlings of reduced, control or enlarged great tit Parus major broods and secondly used the blood from these nestlings as a food source for flea larvae reared in the laboratory. We then assessed the effect of brood size manipulation on reproduc-tive investment and survival of female fleas, and on surviv-al, developmental time, mass and size of pre-imago larvae and adults of the first generation. Although host condition, measured as body mass controlled for body size, was sig-nificantly influenced by brood size manipulation, it did not affect the female fleas' reproductive investment and surviv-al. Larvae fed with blood from nestlings of reduced broods lived longer, however, than larvae fed on blood from en-larged or control broods. Additionally, F1 adults grew shorter tibiae when their mother had fed on hosts of reduced broods. The finding that brood size manipulation influenced parasite reproduction suggests that it affected nutritive
resources and/or host defence, but the precise mechanism or balance between the two requires further investigation.
Introduction
A parasite lives in or on another organism from which it exploits resources in order to increase its fitness, thereby exerting harm to the host. The distribution of parasites within a host population is often characterised by a clumped pattern, in which few individuals in a population harbour many para-sites whilst others have few or no parapara-sites (Shaw and Dobson
1995). Individual hosts that show high parasite infestation levels may be highly profitable for parasites, profitability being defined by the fitness-relevant properties of the resour-ces obtained and the costs of obtaining these resourresour-ces. Var-iation in encounter probability (e.g. heterogeneity of host behaviour or variation in host attractiveness; Reimchen and Nosil 2001) or in host profitability to the parasites (Poulin
1998) may thus drive the distribution pattern of parasites and even the distribution among different host species sharing the same habitat (Krasnov et al.2003).
Since available host nutritive resources can be related to the host body condition, parasites may profit from exploit-ing hosts in good condition. Numerous studies found that parasites gain a higher reproductive success when feeding on food-supplemented hosts (e.g. Christe et al.2003; Tseng
2006; Tschirren et al.2007). However, hosts in good con-dition may also have more resources to invest into defence strategies against parasites (e.g. grooming, increased skin thickness and immune system), which will increase the costs of exploiting the host. Parasites should therefore preferen-tially infest hosts in poor condition that have fewer resour-ces to invest into defence mechanisms (reviewed by Sheldon and Verhulst 1996; Krasnov et al.2005) and thus
S. Rueesch (*)
:
M. Lemoine:
H. RichnerInstitute for Ecology and Evolution, University of Bern, Baltzerstrasse 6,
3012 Bern, Switzerland e-mail: [email protected] H. Richner
may possess a weaker immune system (e.g. Brinkhof et al.
1999; Christe et al. 1998; Krist et al. 2004; Roulin et al.
2003). In return, parasites exploiting hosts in poor condition may be limited by the resources they can extract from them if such hosts offer suboptimal nutritive resources, and there-fore parasites may be better off on hosts in intermediate condition despite their potentially better defence (Bize et al.
2008).
While the selective pressure imposed by parasites on host fitness was tested in several study systems (Møller1997), the effect of host quality, resource availability (e.g. Rossin et al. 2005) and other characteristics (e.g. Lourenço and Palmeirim 2008) on parasite fitness is poorly understood and sometimes showed contradictory results (Krasnov et al.
2005; Tschirren et al.2007). Using a rodent-flea experimen-tal system (Orienexperimen-tal rat flea Xenopsylla ramesis feeding on Sundervall's Jird Meriones crassus), Krasnov et al. (2005) showed that fleas feeding on food-limited hosts produced more eggs with higher hatching success and higher larval survival. The greater success on experimentally underfed hosts may be explained by the lower immunocompetence of hosts in poor nutritional condition (Nelson 1984). In contrast, Tschirren et al. (2007) demonstrated that female hen fleas (Ceratophyllus gallinae) feeding on food-supplemented great tit (Parus major) nestlings laid signifi-cantly more eggs. The food supplementation might have changed the profitability of the nestlings' blood, for example its digestibility (Sarfati et al.2005) or nutritional composi-tion (Nijdam et al.2005). These studies manipulated food (supplementation or deprivation) in order to change host condition. Since the effect of food supplementation on host blood composition is unknown, we aimed at changing host condition not by food manipulation but rather by brood size manipulation in order to identify components of host con-dition that cause variation in parasite fitness. Indeed, brood size manipulation affects sibling competition by reducing per capita food availability and/or increasing begging and food solicitation when increasing brood size. Interestingly, increas-ing brood size reduces offsprincreas-ing condition (e.g. Roulin et al.
1999; Losdat et al2010) even when parents adjust their food provisioning to offspring number (Neuenschwander et al.
2003) suggesting important competition-induced costs probably related to metabolism (Losdat et al2010). Reducing brood size should relax sibling competition and improve nestling condition, while increasing brood size should intensify competition and reduce nestling condition. Experi-mental brood size manipulation thus appears as an appropriate procedure to investigate the effect of nutritional stress on avian parasite fitness.
In a two-step experiment, we first tested the effect of brood size manipulation on the reproductive performance of female fleas, and secondly the effect of the manipulation on the development and survival of the larval fleas, using
great tits and their most common ectoparasite, the hen flea. By increasing or decreasing the original brood size by two nestlings, we aimed at creating hosts in better or worse conditions (e.g. Berthouly et al.2008). In the first step, we let fleas feed for 2 days on nestlings in the wild, then collected female fleas and assessed their reproductive per-formance and survival in the laboratory. Since larvae feed on faeces containing semi-digested host blood secreted by the parent fleas, we collected blood from nestlings and in a second step assessed larval development and survival in the laboratory.
Based on the finding by Tschirren et al. (2007) that female fleas exploiting food-supplemented nestlings laid more eggs, we predicted that female fleas feeding on hosts in reduced broods should lay more eggs with higher hatch-ing success and higher larval survival than females feedhatch-ing on nestlings of control broods. In contrast, female fleas feeding on broods of increased size were predicted to lay fewer eggs with lower hatchability and lower larval survival than females feeding on nestlings of control broods. We further predicted that larvae fed in the laboratory with poor quality blood from enlarged broods would grow smaller, develop more slowly and live shorter. If resource quality is the main driver of flea fitness, a gradual decrease of parasite fitness should occur in enlarged broods, and larval perfor-mance should reflect the direct effect of resource quality provided by the host blood.
In ectoparasitic insects, multiple studies investigated the trans-generational effect of host quality on the offsprings' phenotype and found a link between the maternal environ-ment and offspring condition (developenviron-ment time and body mass; e.g. Mousseau and Fox1998; Rossiter1991). Here, we test for an arthropod parasite of a vertebrate host the interac-tion between a resource-induced maternal effect (via brood size manipulation in their host) and the larval feeding envi-ronment (by feeding them with host blood of variable quality). If maternal effects are adaptive, we predict larvae to survive longer when the maternal environment corresponds to the larval feeding environment.
Materials and methods Study site and species
The experiment was carried out during the breeding season of 2010 in a great tit (P. major) population breeding in nest boxes in the Bremgartenwald, a deciduous forest near Berne, Switzerland (46°57′ N, 7°24′ E). The great tit belongs to the Paridae family, which serves as the main host of the ectoparasitic hen flea C. gallinae (Rothschild and Clay1952; Tripet and Richner1997). Adult hen fleas live in the nest material of birds and feed by sucking blood from
the host. Flea development passes through several stages. Larval development begins with an active feeding stage that consists of two instars, followed by a third instar, called the white larva stage (WLS), a transition stage between larva and pupa stage. During this stage, all material from the gut is expelled, larvae take on a white colour and become inactive. Thereupon follows the pupa stage where larvae pupate in self-built cocoons or remain naked without a cocoon. Once host nestlings fledge, the flea larvae either complete devel-opment and disperse as adults or remain in the cocoon until the next spring (Du Feu1987; Humphries1968).
Brood size manipulation
Natural brood size in our sample ranged from four to 11 young tits. With the brood size manipulation, we created broods of three different brood size groups: reduced, control and en-larged broods. In‘reduced’ broods, two nestlings of interme-diate mass were removed on the fourth day after hatching; these nestlings were added to broods of the‘enlarged’ group with the same hatching date. In‘control’ nests, nestling numb-ers were not changed. The assignment of broods to the treat-ment groups was randomised.
Nest material and flea infestation
Fleas used in the experiment came from a stock population collected from old nest material and were stored over winter at 4°C in an incubator room. When nestlings were 12 days old, we replaced the nest material with nest material cleared of ectoparasites, collected from deserted nests at the beginning of the field season and microwaved to kill all ectoparasites naturally present in the nest material (Richner et al.1993). We then infested nests with 40 female and 20 male fleas and let them feed and mate on the hosts for 48±2 h.
Blood collection and larval blood treatment
In order to feed flea larvae in the laboratory, we used blood taken from nestlings on day 12 after hatching. On average, nestling blood from two broods was required to feed all the larvae of one infested nest. Therefore, blood was collected from 82 broods in order to feed larvae of female fleas collected in 41 broods. Blood was exclusively taken from nestlings that had not been moved between nests in order to avoid genetic effects and stress responses on blood quality. Blood samples of about 60μl (less than 1 % of the average nestling body mass) were taken from the brachial vein using a capillary tube without anticoagulant coating. The blood samples from each brood were mixed into one Eppendorf tube. Blood samples were deep-frozen and later dried in a vacuum centrifuge at 40°C (4–8 h) until entirely dry and then manually pulverised. The process of freezing and
heating blood ruptures the protein-rich red blood cells, mimicking the blood cell rupture during digestion of a flea's blood meal (Lehane1991). Newly hatched larvae were fed with blood of nestlings from the three different treatment groups, i.e. reduced, control or increased brood size. The larvae of each female flea that hatched on the same day were put into one vial and received blood of the same brood. The three different blood types were distributed equally between the offspring of all the females originating from one nest. Larvae were offered an amount of blood that was calculated to average to 0.5 mg per larva. The quantity of 0.5 mg corresponds to a restricting quantity that still enables devel-opment of larvae (H. Schüpbach, unpublished data; Hsu et al. 2002). The pulverised blood was weighed using an elec-tronic precision balance (Sartorius Genius Serie, Sartorius AG, Göttingen, Germany).
Host monitoring and measurements
Nest boxes were monitored from the beginning of the breeding season in April to determine occupation, laying date, clutch size and hatching date. During brood size manipulation, nestlings were weighed and marked individ-ually by selectively removing tuft feathers. Body mass was measured to 0.1 g. On day 8, nestlings were weighed and ringed individually with aluminium rings. On days 12 and 15 post-hatching, nestling body mass, tarsus (to the nearest of 0.1 mm) and wing length (to the nearest of 1 mm) were recorded. Measures were taken blindly with regard to the brood size manipulation. In addition, samples of feathers for sexing (Griffiths et al. 1998) were taken from nestlings on day 12. We assessed the immune response to an injection of 0.01 mg of lipopolysaccharide (LPS, Sigma-Aldrich) dis-solved in 0.02 ml of phosphate buffered saline into the wing web (Berthouly et al.2008). LPS is a mitogen that induces an antigen-mediated infiltration and aggregation of inflam-matory cells and T cells at the site of injection. The nestling response was measured as the difference between the wing web thickness on day 14 before and 24±6 h after the injection. Wing web thickness was measured with a constant-tension dial micrometre to the nearest of 0.01 mm (Mitotuyo Type 2046FB-60). Increased swelling is considered a sign of higher immunocompetence (Parmentier et al.1998). A few days after fledging, we assessed fledging success by counting dead nest-lings in the nest material.
Reproductive success of female hen fleas
In order to assess the effect of the brood size manipulation on flea reproductive success, we infested half of the manip-ulated broods each with 40 female and 20 male fleas, which were then randomly assigned to the three brood size treat-ments. After 2 days during which the fleas could feed freely
on the nestlings, we collected between 2–39 females from each of the 41 infested nests by manually extracting them from the nest material in the laboratory. For that purpose, we pulled the nest material apart above a white tray onto which female fleas fell. We caught the females and placed them in individual glass vials (200 ml, 26°C and 72±5 % relative humidity) covered with a meshed cloth and rubber band where they were given 2 days for laying eggs. Vials with eggs were collected and the females were placed in new vials where they were monitored until death under starva-tion. The number of eggs per vial was counted and checked every 24±2 h to record hatching success (number of hatched larvae) and time, as well as hatching spread, i.e. period of time between the first and last larvae hatching within a clutch. An egg was considered dead if no larva hatched after 7 days. Since larvae were not marked individually and we also aimed to prevent cannibalism of eggs, newly hatched larvae were transferred to a new vial. Moreover, this allowed monitoring of larval development. In 11 of the infested nests, we either did not succeed in recover-ing females or we succeeded in recoverrecover-ing females but they did not lay eggs, or the eggs did not hatch. So the larvae we obtained in the laboratory came from fleas collected from 30 infested nests.
Larval offspring cohorts
Vials with larvae were checked every 24±2 h in order to record moulting into the white larva stage, pupation, adult emergence, as well as death at all developmental stages and as newly emerged imago under starvation. We measured indi-vidual larval mass at the WLS to the nearest 10μg (Sartorius Genius Serie, Sartorius AG, Göttingen, Germany). Each white larva was then transferred to an individual vial, where it was kept without being fed until it either pupated or died. A pupa was considered dead if no imago emerged after 15 days (max-imal emergence time of a rodent flea at 25°C was 15.3± 1.7 days, see Krasnov et al.2001). We sexed emerged adult fleas after their death and measured their tibia length of the right jumping leg, an accurate correlate of body size in fleas (Tripet et al.2002). All vials were stored in a dark climatic chamber at 26°C (corresponding to the mean tempera-ture in host nests during the nestling period; Tripet and Richner
1999) with a relative humidity of 72±5 % (H. Schüpbach, unpublished data).
Statistical analysis Brood size manipulation
We compared clutch size, laying date, hatching date, brood size as well as individual nestling mass before the brood size manipulation using linear models with normal error to test
the randomisation procedure. Individual nestling mass was analysed by including clutch size, laying date (variables correlated with bird quality; e.g. Verhulst and Nilsson2008) and nestling sex as covariates, and brood identity as a random factor to account for nest and parental effects. Similarly, the efficiency of brood size manipulation was tested by comparing the brood size and mass on days 4, 8 and 12 after manipulation by using linear models with normal error.
Nestling quality
Nestling mass, tarsus and wing length at day 12 were analysed using linear mixed models with normal error in-cluding brood size before manipulation, laying date and nestling sex as covariates, and brood identity as a random factor. The body condition was analysed by adding nestling tarsus length as a covariable to the model of body mass. Only two-way interactions for which we had particular predictions were included in initial models. In the analysis of wing length, we included a variance structure function allowing different variances for each treatment level (varI-dent function of nlme package; Pinheiro et al.2011) due to heteroscedasticity among treatments. The analysis of nes-tling parameters was conducted with data on nesnes-tlings orig-inating from the experimental nests only (i.e. excluding nestlings added to nests) to control for stress responses due to nestling exchange. Broods with a laying date before April 4 were removed because the exact start of laying was unknown. Nestling immune response was tested as the mean difference in wing-web thickness per nest between days 14 and 15 using a linear model with normal error and the same covariables as mentioned above.
Reproductive success of female hen fleas
The number of females fleas collected per nest with respect to brood size manipulation was analysed with a linear model with normal error, and the proportion of non-laying females (binary variable) was analysed using a linear model with binomial error and logit link function. Host laying date, which explained more variance than hatching date, was included as a covariable.
The number of flea eggs and hatched larvae were ana-lysed using linear mixed models with normal error. The proportion of hatched larvae (number of hatched eggs vs. number of non-hatched eggs) was tested using a linear mixed model with a binomial error and logit link function. Hatching time of the larvae per vial, hatching spread and female flea survival under starvation in days were analysed using a linear mixed model with a Poisson error and log link function. All variables fitted the assumptions of homosce-dasticity. The hosts' brood identity was included as random
factor, and laying date as a covariable. Furthermore, clutch size of female fleas was included into initial models for analyses of hatching time, hatching spread and female survival.
Larval offspring cohorts
In a first analysis of larval survival, the overall survival time was tested with a linear mixed-effect with Poisson error and log link function. Secondly, the survival time of the larvae successfully reaching the WLS was investigated using a linear model with normal error. In addition, we analysed the probability of all larvae to reach the WLS and the probability of successful larvae reaching the adult stage using linear mixed models with a binomial error and logit link function. We also tested the white larval mass of larvae successfully reaching the WLS with a linear mixed model with normal error. Host brood and mother's identity were included in all initial models as random factors but host identity was removed from all final models except from the overall survival of larvae since including host brood identity did not statistically improve the models (all χ2< 0.006, P>0.81). We included brood size manipulation and larval feeding treatment as explanatory variables but, in order to maintain statistical power, added their interaction only in models analysing the overall larval survival and probability to reach the WLS. Covariables referring to the flea cycle such as hatching date (describing when larvae hatched in the season), hatching time (describing when larvae hatched after oviposition, i.e. 1, 2 or 3 days thereafter), clutch size and number of larvae per vial were included in initial models for larval survival and prob-ability to reach WLS. In contrast, only hatching time and number of larvae per vial were included in the initial models analysing parameters referring to larvae that sur-vived the active feeding stage. Furthermore, we included mass of white larva (under 0.7 mg) into the model testing the probability to reach adulthood.
For the larvae reaching adulthood, total developmental time, white larval mass and survival time under starva-tion, as well as tibia length of the newly emerged adults were analysed. All the mentioned adult F1 variables were analysed with the help of linear mixed models with normal error. Due to small sample size in the treatment groups, we tested only host brood size manipulation and larval blood treatment in the models as explanatory variables.
We did the statistical analyses using models in R (R Development Core Team2011). Model selection was done by evaluating the best fitting fixed effects and covariables using maximum likelihood. Parameter estimates of mixed models were obtained via restricted maximum likelihood. Non-significant interactions or effects were removed using a
stepwise backward elimination procedure. A significance level of P00.05 was used for all statistical tests. Residuals of the models were checked for normality.
Results
Efficiency of brood size manipulation
Overall, 82 broods were manipulated, with 29 reduced, 26 control and 27 enlarged broods. Clutch size, laying date, hatching date and brood size before manipulation did not significantly differ among experimental groups (F2,7700.11, P00.90; F2,7700.80, P00.45; F2,7701.35, P00.27; and F2,7700.64, P00.53, respectively). There was no significant difference in individual nestling mass before manipulation among the brood size groups (F2,6600.60, P00.55). Brood size manipulation influenced environmental conditions for fleas over a large part of the nestling period. That is, 8 days after hatching, enlarged broods held significantly more nestlings than control broods (8.58±1.95 vs. 7.23± 2.27, respectively, t7202.35, P00.02) and reduced broods fewer nestlings than controls (reduced broods 5.99±1.86, t720−2.10, P00.04). Twelve days after hatching, differences among experimental brood sizes were still significant (F2,680 6.33, P00.003). However, the number of nestlings in enlarged broods was similar at that time to the number of nestlings in control broods (7.82±1.89 vs. 7.01±2.31, respectively, t680 1.22, P00.23). By day 12, ten out of the initial 82 broods had failed. In enlarged broods, five out of 27; in control broods, two out of 26; and in reduced broods, three out of 29 broods failed. Brood failure was not significantly influenced by the brood size manipulation (χ2test, P00.58).
Nestling quality
Nestling measurements at day 12 were affected by the brood size manipulation, controlling for original brood size, laying date and nestling sex (body mass F2,66012.87, P<0.001; tarsus length F2,6705.28, P00.008; wing length F2,6705.03, P0 0.009). Nestlings reared in enlarged broods were significantly lighter and smaller at day 12 than nestlings in control broods (body mass t660−4.42, P<0.001; tarsus length t670−2.97, P0 0.004; wing length t670−2.73, P00.008), whereas nestlings in reduced broods had similar size and mass as the nestlings in control broods (body mass t660−0.13, P00.90; tarsus length t670−0.42, P00.68; wing length t670−0.003, P01.00). Male nestlings were significantly heavier and had longer tarsi than females (body mass t32902.13, P00.03; tarsus length t3290 2.46, P00.02). The body condition at day 12 was significantly affected by the brood size manipulation (F2,6606.74, P00.002; Fig.1A; controlling for original brood size, laying date and nestling sex). Nestlings reared in enlarged broods were in
poorer body condition than nestlings from control broods (t660−3.06, P00.003), which were of similar body condition as nestlings from reduced broods (t6600.19, P00.85). The mean LPS response by nest was not influenced by the brood size manipulation after accounting for clutch size and laying date (F2,6100.66, P00.52). Laying date had a significant effect on the response to LPS injection (F1,6408.44, P0 0.005) with the strength of the response increasing with the season's advance.
Reproductive success of female hen fleas
After letting female fleas feed on nestlings for 2 days, an average of 27 females were picked per nest in each brood size group (F2,2702.22, P00.13), indicating that the brood size manipulation did not increase flea mortality, emigration or immigration. 34.7 % of all the collected females did not lay eggs. The proportion of females not laying eggs was equal among all manipulated host brood sizes (F2,2700.20, P00.82). Excluding females that did not lay eggs from the analysis of clutch size did not change the results. In total, 617 females produced 2,906 eggs from which 2,298 (79.1 %) larvae hatched. Reproductive success of female fleas, in terms of clutch size and number of larvae, was not influenced by the brood size manip-ulation after taking into account the hosts' laying dates (clutch size F2,2901.40, P00.26; Fig.1B; number of hatched larvae F2,2901.12, P00.34). The mean clutch size was 4.71±2.38 eggs (n0617) leading to 3.97±2.71 larvae on average (n0558). Similarly, the brood size manipulation did not affect hatching time (χ200.92, P00.63), hatching spread (χ20 0.63, P00.73) and female survival (χ202.65, P00.27) con-trolling for host laying date and flea clutch size (Table1). Eggs from clutches started hatching 1.47 ±0.53 days on average after oviposition, and it took on average 1.26 ± 0.48 days until all eggs of a clutch had hatched (n0558). Hatching time of the first larva was longer (z0−3.23, P0 0.001), and hatching spread was smaller in smaller clutches (z04.27, P<0.001). The proportion of hatched larvae did not depend on their mother's assignment to the host brood size manipulation (χ200.13, P00.94). Females laying
Fig. 1 A Nestling body condition (mean±SE) measured as body mass corrected for tarsus length according to brood size manipulation. Reduced: two nestlings were removed compared to the original clutch size; control: nestlings were left unmanipulated; enlarged: two nestlings were added to the original clutch size. The small numbers in the graph indicate the nestling sample size. B Flea clutch size (mean±SE) according to host brood size manipulation. Reduced: two nestlings were removed compared to the original clutch size; control: nestlings were left unmanipulated; enlarged: two nestlings were added to the original clutch size. The small numbers in the graph indicate the female flea sample size. C Larval survival in days (mean±SE) according to larval blood treatment. Reduced: blood taken from nestlings reared in reduced broods; control: blood taken from nestlings reared in control broods; enlarged: blood taken from nest-lings reared in enlarged broods. The small numbers in the graph indicate the sample size of larvae
bigger clutches had a shorter life span (z0−4.27, P<0.001). Females lived 2.60±1.15 days on average after laying eggs (n0577).
Larval performance
From the larvae that hatched, 3.4 % (n078) survived to the white larva stage, 2 % (n046) finally pupated and 1.7 % (n040) emerged as new imagines. Of 40 larvae emerging as F1-generation fleas, 21 were females and 19 males.
Overall, larval survival was neither influenced by the brood size manipulation nor by the interaction between the brood size manipulation and larval blood treatment. However, larval survival was affected by the blood treatment (Table2; con-trolling for hatching time and number of larvae per vial). Larvae fed on blood from reduced broods lived longer than larvae fed on blood from enlarged (12.20±12.25 days vs. 10.35±11.32 days, respectively, z02.34, P00.02) or control broods (12.20±12.25 days vs. 9.44±10.17 days, respectively, z03.64, P<0.001; Fig.1C). This effect was not significant for larvae that reached at least the WLS (brood size manipulation χ201.07, P00.35; blood treatment χ201.42, P00.25). Over-all, larval survival decreased with the hatching time of eggs (z0−15.26, P<0.001) and increased with the number of larvae
per vial (z06.66, P<0.001). The probability to reach the WLS was not influenced by the brood size manipulation, the larval food treatment or their interaction (Table 2). The mass of larvae successfully reaching the WLS (0.28 ±0.12 μg on average (n078)) and the probability to reach adulthood were neither influenced by the brood size manipulation (F2,500 1.61, P00.21; χ200.92, P00.63, respectively) nor by the larval food treatment (F2,4801.20, P00.31; χ201.26, P0 0.53, respectively). Nevertheless, the probability of larvae reaching the adult stage marginally increased with white larval mass (χ203.61, P00.06). Additionally, the probability of reaching adulthood was bigger for larvae hatching on days 1 or 2 after oviposition (χ2024.31, P<0.001). All the success-fully developing larvae in our experiment spent the pupa stage as naked pupae without an enclosing cocoon. The brood size manipulation and larval blood treatment were not found to have any effect on adult fleas from the new generation in terms of overall developmental time (F2,2701.29, P00.29; F2,2900.88, P00.43, respectively), white larval mass (F2,290 1.69, P00.2; F2,2700.02, P00.98) and survival under starva-tion (F2,2700.93, P00.41; F2,2901.84, P00.18). The tibia length of newly hatched adults, on average 1.18±0.14 mm (n040), was also not changed by the blood treatment (F2,270 Table 1 Effect of the brood size manipulation, controlling for host
laying date and partly flea clutch size on female reproductive measures i.e. clutch size, number of hatched larvae, hatching time, hatching spread and female survival without food
Variable DF F/χ2 P
Clutch size (n0617)
Host laying date 1,28 0.08 0.78
Brood size manipulation 2,29 1.4 0.26
Number of larvae (n0558)
Host laying date 1,28 0.01 0.92
Brood size manipulation 2,29 1.12 0.34
Hatching time (n0558)
Host laying date 1 0.06 0.8
Flea clutch size 1 9.55 0.002
Brood size manipulation 2 0.92 0.63
Hatching spread (n0558)
Host laying date 1 0.02 0.89
Flea clutch size 1 16 <0.001
Brood size manipulation 2 0.63 0.73
Female survival (n0577)
Host laying date 1 2 0.16
Flea clutch size 1 18.51 <0.001
Brood size manipulation 2 2.65 0.27
All models included the host nest as random factor. Significant differ-ences are indicated in italics
DF degrees of freedom
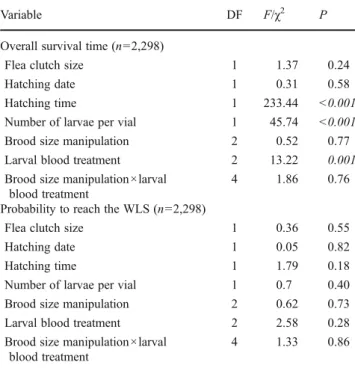
Table 2 Influence of the brood size manipulation, the larval blood treatment, their interaction and covariables (flea clutch size, hatching date, hatching time, number of larvae per vial) on parameters concerning all hatched larvae i.e. on overall survival time (Poisson distribution) and probability to reach the WLS
Variable DF F/χ2 P
Overall survival time (n02,298)
Flea clutch size 1 1.37 0.24
Hatching date 1 0.31 0.58
Hatching time 1 233.44 <0.001
Number of larvae per vial 1 45.74 <0.001
Brood size manipulation 2 0.52 0.77
Larval blood treatment 2 13.22 0.001
Brood size manipulation ×larval blood treatment
4 1.86 0.76
Probability to reach the WLS (n02,298)
Flea clutch size 1 0.36 0.55
Hatching date 1 0.05 0.82
Hatching time 1 1.79 0.18
Number of larvae per vial 1 0.7 0.40
Brood size manipulation 2 0.62 0.73
Larval blood treatment 2 2.58 0.28
Brood size manipulation ×larval blood treatment
4 1.33 0.86
Female and nest identities were included into the model of survival time as random factors, whereas only female identity was included into the model analysing the probability to reach WLS. Significant differ-ences are indicated in italics
0.71, P00.50) but was significantly affected by the brood size manipulation (F2,2903.44, P00.05). Adult fleas originating from female fleas fed on reduced broods had a significantly shorter tibia length of 1.11±0.15 mm than those produced by mothers fed on control broods (t290−2.03, P00.05), which had a similar tibia length as adults originating from mothers fed on enlarged broods (t2900.00, P01.00).
Discussion
Reproductive success of female hen fleas
Brood size manipulation was partially successful in creating a difference in nestling condition. We found that nestlings reared in enlarged broods were smaller and lighter than nestlings in control or reduced broods, which did not sig-nificantly differ from each other. Nestlings in enlarged broods also had a lower body condition since they were relatively lighter after taking body size into account. How-ever, brood size manipulation did not influence the repro-ductive success of female fleas in terms of clutch size, hatching success and female survival. Our findings are in contrast to previous studies that demonstrated that (a) fleas laid more eggs when feeding on experimentally underfed rodent hosts with decreased body mass (Krasnov et al.
2005) and (b) female fleas laid more eggs when their bird hosts had been provided with a food-supplemented diet where nestlings were then larger and heavier (Tschirren et al.2007). In addition, in the study by Krasnov et al. (2005), hatching success, time until hatching and survival of starved parent fleas were highest for female fleas on food-limited hosts, which suggested a decline in the immune responses in hosts with limited food intake. In the present study, the time until eggs started hatching and the period of time until all the eggs of one clutch had hatched depended on the size of the clutch. If a female produced a relatively small clutch, eggs took longer to start hatching, but all eggs of the clutch hatched within a short period of time. In a clutch with more eggs, eggs started to hatch earlier, but the time until all the eggs had hatched was longer. Later onset of hatching within a clutch may be compensated by a faster hatching completion of all eggs. This suggests that female fleas invested differently in eggs depending on their clutch size. Females that laid more eggs experienced lower survival. The reduced chance of sur-vival could be a consequence of the reallocation of resources to reproduction at the expense of survival.
In summary, host brood size manipulation had no effect on the reproductive success of female fleas although the experimental treatment affected host condition in enlarged broods. This may indicate that the brood size manipulation of hosts did not change profitability (quality and quantity of nutritive resources, cost of exploitation) for the parasites.
However, larval survival was affected by the blood treatment, demonstrating that the brood size manipulation was efficient in changing the host profitability for feeding larvae. Another possibility is that the difference in host profitability and con-dition was not sufficiently important to cause a difference in female nutritive states. Indeed, females could maximise feed-ing efficiency by compensatfeed-ing the cost of obtainfeed-ing the nutritive resources (e.g. increasing the duration of one meal or the number of meals) at the expense of the quality of the gained resources. The absence of effects is unlikely to result from a too short female feeding period in a host nest since the same infestation procedure had been successfully applied before (Tschirren et al.2007).
Larval performance
The high mortality of larvae during early development sug-gests that our experiment may have provided suboptimal growth conditions and thus did not allow the minimal weight necessary for induction of gut purge (Nijhout and Williams 1974) and further developmental steps. In many insect species, larvae increase body size by moulting during several instars until reaching a critical body size or weight threshold. At this point, growth stops and metamorphosis is induced (Mirth and Riddiford2007). An insect larva must surpass three size checkpoints before metamorphosis can occur (Nijhout and Williams 1974; Nijhout 1975): first, the threshold size for metamorphosis in the penultimate instar; second, the minimal viable weight in the last instar that ensures survival through metamorphosis; and third, the critical weight that indicates that metamorphosis can no longer be delayed. If larvae starve during the ‘period of indispensable nutrition’ (active feeding stage) (Nijhout
1975), they will not survive to moult into pupae since they will not have attained their minimal viable weight. Larvae starving between the minimal viable weight and the critical weight extend the last larval instar to locate additional food and reach the critical weight. A study by Tripet et al. (2002) showed that food availability has a significant effect on the number of larvae that reach the white larva stage. In our experiment, limited food availability during the early active feeding stage may have induced high larval mortality, which may have led to a halt in development and resulted in death before gut purge could occur.
The suboptimal growth conditions may also be due to a lack of supplementary food sources in the host blood. In-deed, in the wild, parent fleas secrete host blood with their faeces. The faeces make up for a substantial part of the larval diet and are an essential nutritional requirement for developing larvae. Since larvae are not equipped with mouthparts for extracting blood from hosts, the adult fleas act as an intermediate providing essential nutrients to larvae, which is hence a form of parental investment (Hinkle et al.
1991; Silverman and Appel 1994). Besides faeces, larvae were shown to feed on detritus (Lehane 1991; Marshall
1981; Rothschild and Clay 1952). Other studies deny that debris is of importance for the nourishment of larvae (e.g. Strenger 1973). In addition, mixing animal and vegetable food has been shown to improve the nutrient balance (Coll and Guershon2002). Thus, a further factor, which may have prevented successful development in our experiment, could be the lack of supplementary food sources such as organic detritus and yeast in the larval diet. Both possibly make up a major part of larval diet and are important for weight gain to reach the critical weight.
Interestingly, all the successfully developing larvae that passed the WLS in our experiment spent the pupa stage as naked pupae. Lawrence and Foil (2002) found that cocoon formation (e.g. in cat flea larvae) is related to the amount of yeast or flea eggs consumed. Larvae consuming small amounts of yeast or eggs developed as naked pupae or formed incomplete cocoons. The lack of cocoon formation in our experiment could thus have resulted from insufficient resources for building cocoons. However, larvae developing as naked pupae have no developmental disadvantage as they are known to develop into adults as successfully as the pupae within a protective cocoon (Dryden and Smith1994). Never-theless, Hsu et al. (2002) found that naked pupae differ in their timing of development, as they were observed to appear later than the regular pupae with enclosing cocoon and therefore avoided being cannibalised by the larvae that hatched in the same period.
Finally, the lack of substrate in our experimental vials could have generated harsh environmental rearing condi-tions for the larvae. Under similar environmental condicondi-tions (dark climatic chamber at 26°C temperature and 72±5 % relative humidity) and food levels but with sterilised sand provided, larvae developed faster and grew heavier than in our laboratory experiment (H. Schüpbach, unpublished data). Ex-trinsic environmental factors such as substrate structure, am-bient temperature and relative humidity can have a big impact on the duration of development (for a review, see Krasnov
2008). Therefore, sterilised sand may have provided an ade-quate substrate for larvae.
The high larval mortality leading to low statistical power (78 larvae located in six groups) may have masked any existing interaction between brood size manipulation and larval blood treatment, as well as prevented the detection of subtle effects. Overall, the results support the prediction that host profitability has an effect on offspring development. However, we found no influence of the different blood types on the probability of larvae to get through the current developmental stage and on the quality of larvae that entered the white larva stage in terms of survival, developmental time, size of pre-imaginal stages and adults of the first generation. From this, one could conclude that blood
appears to be a crucial requirement of the larval feeding environment, but entering the white larva stage may not depend on the blood quality here since overall food avail-ability was low in our experiment. Additionally, the chance of reaching the adult stage was greater for heavier larvae. Smaller larvae have a higher surface-to-volume ratio leading to a lower water and fat storage capacity. Therefore, smaller individuals will show a lower resistance to desiccation (Le Lagadec et al.1998), causing the observed mortality. In addi-tion, smaller individuals that survived the active feeding stage may have had less nutritional resources in order to induce metamorphosis.
However, we found two significant effects of host brood size manipulation on larvae. The survival of larvae was ex-tended when feeding on blood from reduced broods. This suggests that the current environmental conditions are impor-tant for the development of larvae and that blood from reduced broods was possibly of better quality and composition than blood from control or enlarged broods.
Interestingly, adult F1 fleas resulting from females exploiting nestlings of reduced broods developed shorter tibiae compared to the ones produced by females fed in enlarged or control broods. From this, one could assume that mothers may be able to invest differently into eggs. These results show that the brood size reduction and the blood from reduced broods had an effect on development and survival of larvae, although there was no difference in host condition between nestlings reared in reduced and control broods.
To summarise, we show in this study that the differences in host condition created by the brood size manipulation among nestlings in the three brood size groups did not influence the female fleas' reproductive investment and sur-vival. Due to the lack of interaction between the feeding conditions of females and offspring, we assume that the effect of host condition on offspring is determined only by the larval feeding conditions, i.e. the larval blood treatment. Larvae lived longer when fed on blood from hosts in re-duced broods, and adults prore-duced by female fleas feeding on nestlings of reduced broods had shorter tibiae. This study also suggests that larvae are sensitive to several environ-mental factors during development, especially during the active feeding stage, and that larval survival and develop-ment may be limited by food shortage, wrong diet compo-sition or absence of appropriate substrate. For future studies involving the rearing of larvae, we would therefore recom-mend the provision of detritus and substrate to prevent high mortality.
Finally, with our study, we cannot draw clear conclusions on the influence of host condition on reproductive invest-ment and survival of female fleas, but we have clear evi-dence supporting the assumption that larvae live longer when feeding on blood from a host in a reduced brood.
The fact that larvae lived longer when provided with blood from smaller host broods shows that blood profitability was affected by the brood size manipulation although host condi-tion did not vary. In this experiment, we did not find a correlation between host condition (measured as body mass corrected for size) and blood profitability. Further investiga-tions are needed to identify the blood components that affect blood profitability and how these components are linked to host condition.
Acknowledgements We are grateful to V. Saladin for molecular sexing of nestlings and to M. Coslovsky and M. Rueesch for helpful comments on the manuscript. We also wish to thank M. Coslovsky for kindly allowing us to use his nest boxes. The work was approved by the veterinary office of the Canton Berne, Switzerland (permit number 22/ 10) and financially supported by the Swiss National Science Foundation (grant number 3100A0-122566/1).
References
Berthouly A, Cassier A, Richner H (2008) Carotenoid-induced mater-nal effects interact with ectoparasite burden and brood size to shape the trade-off between growth and immunity in nestling great tits. Funct Ecol 22(5):854–863. doi: 10.1111/j.1365-2435.2008.01439.x
Bize P, Jeanneret C, Klopfenstein A, Roulin A (2008) What makes a host profitable? Parasites balance host nutritive resources against immunity. Am Nat 171(1):107–118. doi:10.1086/523943 Brinkhof MWG, Heeb P, Kolliker M, Richner H (199 9)
Immunocompetence of nestling great tits in relation to rearing environment and parentage. Proc R Soc Lond B Biol Sci 266 (1435):2315–2322
Christe P, Møller AP, de Lope F (1998) Immunocompetence and nestling survival in the house martin: the tasty chick hypothesis. Oikos 83(1):175–179
Christe P, Giorgi MS, Vogel P, Arlettaz R (2003) Differential species-specific ectoparasitic mite intensities in two intimately coexisting sibling bat species: resource-mediated host attractiveness or par-asite specialization? J Anim Ecol 72(5):866–872
Coll M, Guershon M (2002) Omnivory in terrestrial arthropods: mix-ing plant and prey diets. Annu Rev Entomol 47:267–297 Dryden MW, Smith V (1994) Cat flea (Siphonaptera, Pulicidae)
co-coon formation and development of naked flea pupae. J Med Entomol 31(2):272–277
Du Feu CR (1987) Some observations on fleas emerging from tit nestboxes. Ringing Migr 8:123–128
Griffiths R, Double MC, Orr K, Dawson RJG (1998) A DNA test to sex most birds. Mol Ecol 7(8):1071–1075
Hinkle NC, Koehler PG, Kern WH, Patterson RS (1991) Hematophagous strategies of the cat flea (Siphonaptera: Pulicidae). Fla Entomol 74 (3):377–385
Hsu MH, Hsu YC, Wu WJ (2002) Consumption of flea faeces and eggs by larvae of the cat flea, Ctenocephalides felis. Med Vet Entomol 16(4):445–447
Humphries DA (1968) The host-finding behaviour of the hen flea Ceratophyllus gallinae (Schrank) (Siphonaptera). Parasitology 58:403–414
Krasnov BR (2008) Functional and evolutionary ecology of fleas: a model for ecological parasitology. Cambridge University Press, New York, pp 206–216
Krasnov BR, Khokhlova IS, Fielden LJ, Burdelova NV (2001) Development rates of two Xenopsylla flea species in relation to air temperature and humidity. Med Vet Entomol 15 (3):249–258
Krasnov BR, Sarfati M, Arakelyan MS, Khokhlova IS, Burdelova NI, Degen AA (2003) Host specificity and foraging efficiency in blood-sucking parasite: feeding patterns of the flea Parapulex chephrenis on two species of desert rodents. Parasitol Res 90 (5):393–399. doi:10.1007/s00436-003-0873-y
Krasnov BR, Khokhlova IS, Arakelyan MS, Degen AA (2005) Is a starving host tastier? Reproduction in fleas parasitizing food-limited rodents. Funct Ecol 19(4):625–631. doi: 10.1111/j.1365-2435.2005.01015.x
Krist AC, Jokela J, Wiehn J, Lively CM (2004) Effects of host condition on susceptibility to infection, parasite developmental rate, and parasite transmission in a snail-trematode interaction. J Evol Biol 17(1):33–40. doi:10.1046/j.1420-9101.2003.00661.x Lawrence W, Foil LD (2002) The effects of diet upon pupal
develop-ment and cocoon formation by the cat flea (Siphonaptera: Pulicidae). J Vector Ecol 27(1):39–43
Le Lagadec MD, Chown SL, Scholtz CH (1998) Desiccation resistance and water balance in southern African keratin beetles (Coleoptera, Trogidae): the influence of body size and habitat. J Comp Physiol B Biochem Syst Environ Physiol 168(2):112–122
Lehane MJ (1991) Biology of blood-sucking insects. HarperCollins Academic, London, pp 87–96; pp 98–102
Losdat S, Helfenstein F, Gaude B, Richner H (2010) Effects of sibling competition and male carotenoid supply on offspring condition and oxidative stress. Behav Ecol 21(6):1271–1277 Lourenço S, Palmeirim JM (2008) Which factors regulate the
repro-duction of ectoparasites of temperate-zone cave-dwelling bats? Parasitol Res 104(1):127–134. doi:10.1007/s00436-008-1170-6 Marshall AG (1981) The ecology of ectoparasitic insects. Academic
Press, London, pp 132–133
Mirth CK, Riddiford LM (2007) Size assessment and growth control: how adult size is determined in insects. Bioessays 29(4):344–355. doi:10.1002/bies.20552
Møller AP (1997) Parasitism and the evolution of host life history. In: Clayton DH, Moore J (eds) Host-parasite evolution: general prin-ciples and avian models. Oxford University Press, Oxford, pp 105–127
Mousseau TA, Fox CW (1998) The adaptive significance of maternal effects. Trends Ecol Evol 13(10):403–407
Nelson WA (1984) Effects of nutrition of animals on their ectopara-sites. J Med Entomol 21(6):621–635
Neuenschwander S, Brinkhof MWG, Kölliker M, Richner H (2003) Brood size, sibling competition, and the cost of beg-ging in great tits (Parus major). Behav Ecol 14(4):457–462 Nijdam E, Delezie E, Lambooij E, Nabuurs MJA, Decuypere E,
Stegeman JA (2005) Feed withdrawal of broilers before transport changes plasma hormone and metabolite concentrations. Poult Sci 84(7):1146–1152
Nijhout HF (1975) Threshold size for metamorphosis in the tobacco hornworm, Manduca sexta (L.). Biol Bull 149(1):214–225 Nijhout HF, Williams CM (1974) Control of molting and
meta-morphosis in tobacco hornworm, Manduca sexta (L.)—Growth of last-instar larva and decision to pupate. J Exp Biol 61(2):481– 491
Parmentier HK, Reilingh GD, Nieuwland MGB (1998) Kinetic and immunohistochemical characteristics of mitogen-induced cu-taneous hypersensitivity in chickens selected for antibody respon-siveness. Vet Immunol Immunopathol 66(3–4):367–376
Pinheiro J, Bates D, DebRoy S, Deepayan S, R Development Core Team (2011) nlme: linear and nonlinear mixed effects models. R package version 3.1-100.http://cran.r-project.org/web/packages/ nlme/index.html
Poulin R (1998) Evolutionary ecology of parasites. Chapman and Hall, London, pp 90–110
R Development Core Team (2011) R: a language and environment for statistical computing. R Foundation for Statistical Computing, Vienna.http://www.R-project.org
Reimchen TE, Nosil P (2001) Ecological causes of sex-biased parasit-ism in three spine stickleback. Biol J Linn Soc 73(1):51–63. doi:10.1006/bijl.2001.0523
Richner H, Oppliger A, Christe P (1993) Effect of an ectoparasite on reproduction in great tits. J Anim Ecol 62(4):703–710
Rossin MA, Poulin R, Timi JT, Malizia AI (2005) Causes of inter-individual variation in reproductive strategies of the parasitic nematode Graphidioides subterraneus. Parasitol Res 96(5):335– 339. doi:10.1007/s00436-005-1400-0
Rossiter MC (1991) Environmentally-based maternal effects—a hid-den force in insect population-dynamics. Oecologia 87(2):288– 294
Rothschild ML, Clay T (1952) Fleas, flukes and cuckoos; a study of bird parasites. Collins, London, pp 71–72; pp 111–113
Roulin A, Ducrest A-L, Dijkstra C (1999) Effect of brood size manip-ulations on parents and offspring in the barn owl Tyto alba. Ardea 87:91–100
Roulin A et al (2003) Which chick is tasty to parasites? The importance of host immunology vs. parasite life history. J Anim Ecol 72(1):75– 81
Sarfati M, Krasnov BR, Ghazaryan L, Khokhlova IS, Fielden LJ, Degen AA (2005) Energy costs of blood digestion in a host-specific haematophagous parasite. J Exp Biol 208(13):2489– 2496. doi:10.1242/jeb.01676
Shaw DJ, Dobson AP (1995) Patterns of macroparasite abundance and aggregation in wildlife populations: a quantitative review. Parasitology 111:S111–S133
Sheldon BC, Verhulst S (1996) Ecological immunology: costly para-site defences and trade-offs in evolutionary ecology. Trends Ecol Evol 11(8):317–321
Silverman J, Appel AG (1994) Adult cat flea (Siphonaptera, Pulicidae) excretion of host blood proteins in relation to larval nutrition. J Med Entomol 31(2):265–271
Strenger A (1973) Zur Ernährungsbiologie der Larve von Ctenocephalides felis felis. Zool Jahrb Syst 100:64–80
Tripet F, Richner H (1997) Host responses to ectoparasites: food compensation by parent blue tits. Oikos 78(3):557–561 Tripet F, Richner H (1999) Dynamics of hen flea Ceratophyllus gallinae
subpopulations in blue tit nests. J Insect Behav 12(2):159–174 Tripet F, Jacot A, Richner H (2002) Larval competition affects the life
histories and dispersal behavior of an avian ectoparasite. Ecology 83(4):935–945
Tschirren B, Bischoff LL, Saladin V, Richner H (2007) Host condition and host immunity affect parasite fitness in a bird-ectoparasite system. Funct Ecol 21(2):372–378. doi: 10.1111/j.1365-2435.2007.01235.x
Tseng M (2006) Interactions between the parasite's previous and cur-rent environment mediate the outcome of parasite infection. Am Nat 168(4):565–571
Verhulst S, Nilsson JA (2008) The timing of birds' breeding seasons: a review of experiments that manipulated timing of breeding. Philos Trans R Soc B-Biol Sci 363(1490):399–410. doi:10.1098/ rstb.2007.2146