Increased Salt-Sensitivity in
Endothelial Nitric Oxide Synthase–Knockout Mice
Allison M. Leonard, Linda L. Chafe, Jean-Pierre Montani, and Bruce N. Van Vliet
Background: Although impaired nitric oxideproduc-tion contributes importantly to salt-sensitivity, the role of the endothelial isoform of nitric oxide synthase (eNOS) has received little attention. In the present study we com-pared the effects of a high-salt diet on the blood pressure response of eNOS knockout (eNOS⫺/⫺) and control (eNOS⫹/⫹) mice.
Methods: Mean arterial pressure (MAP), heart rate,
pulse pressure, and activity levels were recorded by telem-etry in mice fed a regular-salt diet (0.7% NaCl) followed by 6 weeks on either a high-salt (8% NaCl) or regular-salt diet.
Results: The eNOS⫺/⫺ mice exhibited a 15% increase
in MAP and a 2- to 2.5-fold increase in salt-sensitivity relative to the control strain. Salt-induced increases in MAP were well sustained in eNOS⫺/⫺, whereas in
eNOS⫹/⫹ the initial increase was biphasic. The effects of salt on MAP were particularly pronounced during loco-motor activity, during the dark phase, and at the peak levels of MAP recorded over the course of the day. The high-salt diet also led to a transient increase in the pro-portion of time spent active. Levels of heart rate and pulse pressure were relatively unaffected by the high-salt diet.
Conclusion: The eNOS⫺/⫺ mice exhibit an increased
blood pressure response to a high-salt diet. This finding suggests that eNOS normally provides an important contri-bution to the body’s adaptation to a salt load and that reduced production of NO by eNOS may promote salt-sensitivity and salt-induced hypertension. Am J Hypertens 2006;19: 1264 –1269 © 2006 American Journal of Hypertension, Ltd.
Key Words: Sodium-dependent hypertension, mice,
nitric oxide, nitric oxide synthase, blood pressure.
I
mpaired production of nitric oxide (NO) contrib-utes importantly to salt-induced hypertension.1 Salt-induced increases in NO production are attenuated in animal models of salt-sensitivity.1–3 In such cases, administration of L-arginine restores NO production and reduces salt-sensitivity1,4 – 6 Conversely, NO synthase(NOS) inhibition produces salt-sensitivity in otherwise salt-resistant animals.7–10 Similar associations between NO production and salt-sensitivity have been described in hypertensive patients.11–16
Nitric oxide is produced by three isoforms of NO synthase. Each isoform has the potential to influence the regulation of blood pressure (BP) through their presence within the vascular endothelium (eNOS [NOS-3]), ner-vous system (nNOS [NOS-1]), and kidney including the renal tubules (eNOS, iNOS [NOS-2], and nNOS) and macula densa (nNOS).17 The use of NOS inhibitors with relative specificity for nNOS or iNOS9,10,18 implicates reduced NO production by these two NOS isoforms as possible contributors to salt-induced hypertension. An im-pact of eNOS on salt-sensitivity might also be anticipated
based on its influence on the renal cortical and medullary circulations19and renal tubular salt transport20and its con-tribution to the actions of several natriuretic substances.21–23 The objective of the present study was to test the hypoth-esis that mice with targeted disruption of the eNOS gene would have an increased BP response to salt loading. In contrast to recently published study findings,24our results demonstrate a 2- to 2.5-fold enhancement of salt-sensitiv-ity in eNOS knockout mice, suggesting that the eNOS isoform contributes importantly to the BP response to salt loading.
Methods
AnimalsControl mice (eNOS⫹/⫹, C57BL/6J) and eNOS-deficient mice25(eNOS⫺/⫺, B6.129P2-NOStm1Unc; backcrossed to a C57Bl/6J background) were bred locally or purchased from Jackson Laboratories. Mice were fed a standard regular-salt (RS) feed containing 0.4% sodium (0.7% so-dium chloride), 1.0% calcium, 0.9% potassium and 0.8%
Received May 2, 2006. First decision May 31, 2006. Accepted May 31, 2006.
From the Faculty of Medicine (AML, LLC, BNVV), Memorial Univer-sity of Newfoundland, St. John’s, Newfoundland, Canada; and Institute of Physiology (J-PM), University of Fribourg, Fribourg, Switzerland.
Supported by a grant from the Canadian Institutes of Health Research (to BVV).
Address correspondence and reprint requests to Dr. Bruce N. Van Vliet, Faculty of Medicine, Memorial University of Newfoundland, St. John’s, NL, Canada, A1B 3VC; e-mail: [email protected]
0895-7061/06/$32.00 © 2006 by the American Journal of Hypertension, Ltd.
phosphorus (Lab diet 5P00, Richmond, IN). A high-salt (HS) diet was created by added additional salt to bring the level to 8% NaCl. The recording room had an average temperature of 23°⫾ 0.5°C and was maintained on a 12-h light, 12-h dark cycle. Experiments were approved by the Memorial University of Newfoundland Animal Care Committee.
Experimental Protocol
Mice (male, 11 to 18 weeks) were implanted with a telemeter (DSI #TA11PA-C20) via the carotid artery under ketamine/ xylazine anesthesia (90 and 10 mg/kg intraperitoneally).26
The experimental diet was initiated 17 to 21 days after telemeter implantation. The BP data were recorded by telem-etry 7 days, 2 days, and 1 day before, and 1 to 6, 13, 20, 27, 34, and 41 days after the switch to the experimental diet. Telemetry
Data was sampled at 500 Hz for 3 sec at 30-sec intervals.26 The 24-h data sets were processed using in-house routines (download link:http://www.med.mun.ca/basic/pages/faculty/ vanvliet.htm). The average of the offset measured at 37°C before implantation (2.9⫾ 0.4 mm Hg) and after removal (3.9⫾ 0.4 mm Hg) was subtracted from the collected data before analysis. The proportion of time spent active (Active Time) was calculated by dividing the number of sample periods for which the activity signal was ⬎0 by the total number of samples. The intensity of activity was calculated26 as the mean of log (activity) for values of activity⬎0. Statistical Analysis
Data are reported as the mean⫾ SEM. The protocol was divided into four phases for statistical analysis: 1) control, 2) early (week 1), 3) middle (weeks 2–3), and 4) late (4 – 6). The Dunnett test was used for comparisons be-tween control and experimental periods. A general linear model analysis of variance followed by a Tukey test was
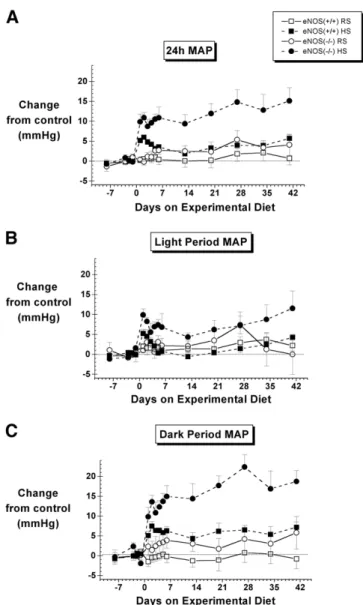
FIG. 1. The effect of regular-salt (RS) versus high-salt (HS) diet on
mean arterial pressure (MAP) in control (eNOS⫹/⫹) and eNOS knockout (eNOS⫺/⫺) mice. Data are shown for the average of the entire day (24-h MAP, top) as well as the individual 12-h light and 12-h dark periods of the day (middle and bottom, respectively).
N⫽ 6 to 8 except on day 2 for which N ⫽ 4 for the eNOS⫺/⫺ HS
group. Control values are given inTable 1. SeeTable 2for statistical comparisons.
Table 1. Control period hemodynamics in the four groups of mice
Characteristic
Control mice eNOS knockout mice Control diet
group (nⴝ 7)
High salt diet group (nⴝ 7)
Control diet group (nⴝ 8)
High salt diet group (nⴝ 6) 24-h MAP (mm Hg) 108⫾ 1 105⫾ 1 123⫾ 2* 121⫾ 2* Light-period MAP (mm Hg) 100⫾ 2 97⫾ 1 113⫾ 2* 113⫾ 1* Dark-period MAP (mm Hg) 116⫾ 1 112⫾ 1 131⫾ 3* 130⫾ 3* Range of 24 h MAP (mm Hg) 54⫾ 2 54⫾ 2 79⫾ 8* 71⫾ 5 24-h Minimum MAP (mm Hg) 83⫾ 1 81⫾ 1 89⫾ 1* 90⫾ 2 24-h Maximum MAP (mm Hg) 137⫾ 1 135⫾ 1 168⫾ 7* 161⫾ 3* 24-h Pulse pressure (mm Hg) 30⫾ 1 31⫾ 2 33⫾ 2 34⫾ 2.4
24-h Heart rate (beats/min) 578⫾ 10 542⫾ 11 547⫾ 9 571⫾ 10
24-h Active time (% time active) 37⫾ 2 36⫾ 3 43⫾ 5 40⫾ 1.5
24-h Intensity of activity (a.u.) 1.2⫾ 0.1 1.2⫾ 0.0 1.2⫾ 0.1 1.2⫾ 0.1
a.u.⫽ arbitrary units; MAP ⫽ mean arterial pressure. * P⬍ .05 between strains, within the same diet group.
used to evaluate differences between groups. A value of
P⬍ .05 was used as the limit of statistical significance.
Results
Changes in MAP Values
The eNOS⫺/⫺ mice were hypertensive, with significant increases in their 24-h MAP, 12-h light-period MAP, 12-h dark period MAP, and daily maximum MAP (Table 1). MAP was significantly increased by the high-salt diet in both eNOS⫹/⫹ and eNOS⫺/⫺ mice (Fig. 1, Table 2). In
eNOS⫹/⫹ mice, the increase in MAP was relatively modest (5.9⫾ 0.6 mm Hg at day 2) and biphasic, the response being significant during the early phase (24-h and dark-period data) and late phases (dark-period data). In contrast, the response of eNOS⫺/⫺ mice was significantly greater and well sus-tained. After initially peaking on day 2 (10.8⫾ 1.3 mm Hg above control levels), the 24-h MAP slowly climbed to the overall peak response occurring on the last day of the exper-iment (15.1⫾ 3.3 mm Hg above control levels). The effects of salt on MAP were most pronounced during the dark period of the day (Fig. 1,Table 1).
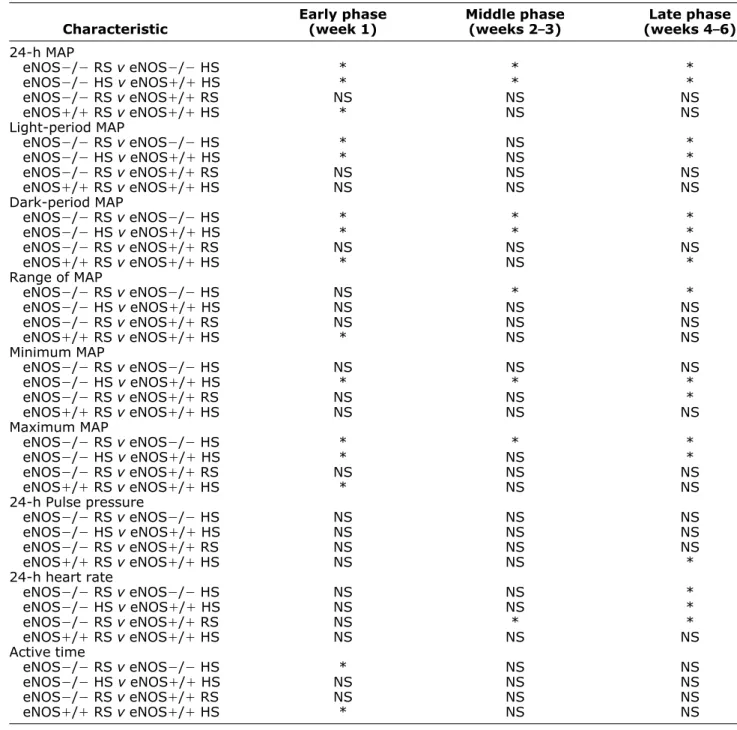
Table 2. Between-group comparisons of salt-induced responses
Characteristic Early phase (week 1) Middle phase (weeks 2–3) Late phase (weeks 4–6) 24-h MAP eNOS⫺/⫺ RS v eNOS⫺/⫺ HS * * * eNOS⫺/⫺ HS v eNOS⫹/⫹ HS * * * eNOS⫺/⫺ RS v eNOS⫹/⫹ RS NS NS NS eNOS⫹/⫹ RS v eNOS⫹/⫹ HS * NS NS Light-period MAP eNOS⫺/⫺ RS v eNOS⫺/⫺ HS * NS * eNOS⫺/⫺ HS v eNOS⫹/⫹ HS * NS * eNOS⫺/⫺ RS v eNOS⫹/⫹ RS NS NS NS eNOS⫹/⫹ RS v eNOS⫹/⫹ HS NS NS NS Dark-period MAP eNOS⫺/⫺ RS v eNOS⫺/⫺ HS * * * eNOS⫺/⫺ HS v eNOS⫹/⫹ HS * * * eNOS⫺/⫺ RS v eNOS⫹/⫹ RS NS NS NS eNOS⫹/⫹ RS v eNOS⫹/⫹ HS * NS * Range of MAP eNOS⫺/⫺ RS v eNOS⫺/⫺ HS NS * * eNOS⫺/⫺ HS v eNOS⫹/⫹ HS NS NS NS eNOS⫺/⫺ RS v eNOS⫹/⫹ RS NS NS NS eNOS⫹/⫹ RS v eNOS⫹/⫹ HS * NS NS Minimum MAP eNOS⫺/⫺ RS v eNOS⫺/⫺ HS NS NS NS eNOS⫺/⫺ HS v eNOS⫹/⫹ HS * * * eNOS⫺/⫺ RS v eNOS⫹/⫹ RS NS NS * eNOS⫹/⫹ RS v eNOS⫹/⫹ HS NS NS NS Maximum MAP eNOS⫺/⫺ RS v eNOS⫺/⫺ HS * * * eNOS⫺/⫺ HS v eNOS⫹/⫹ HS * NS * eNOS⫺/⫺ RS v eNOS⫹/⫹ RS NS NS NS eNOS⫹/⫹ RS v eNOS⫹/⫹ HS * NS NS 24-h Pulse pressure eNOS⫺/⫺ RS v eNOS⫺/⫺ HS NS NS NS eNOS⫺/⫺ HS v eNOS⫹/⫹ HS NS NS NS eNOS⫺/⫺ RS v eNOS⫹/⫹ RS NS NS NS eNOS⫹/⫹ RS v eNOS⫹/⫹ HS NS NS * 24-h heart rate eNOS⫺/⫺ RS v eNOS⫺/⫺ HS NS NS * eNOS⫺/⫺ HS v eNOS⫹/⫹ HS NS NS * eNOS⫺/⫺ RS v eNOS⫹/⫹ RS NS * * eNOS⫹/⫹ RS v eNOS⫹/⫹ HS NS NS NS Active time eNOS⫺/⫺ RS v eNOS⫺/⫺ HS * NS NS eNOS⫺/⫺ HS v eNOS⫹/⫹ HS NS NS NS eNOS⫺/⫺ RS v eNOS⫹/⫹ RS NS NS NS eNOS⫹/⫹ RS v eNOS⫹/⫹ HS * NS NS
HS⫽ high salt diet; NS ⫽ not significant; RS ⫽ regular salt diet. Intensity of Activity results are not shown (ANOVA, NS). * P⬍ .05 for specified comparison (Tukey test).
Distribution of MAP Values
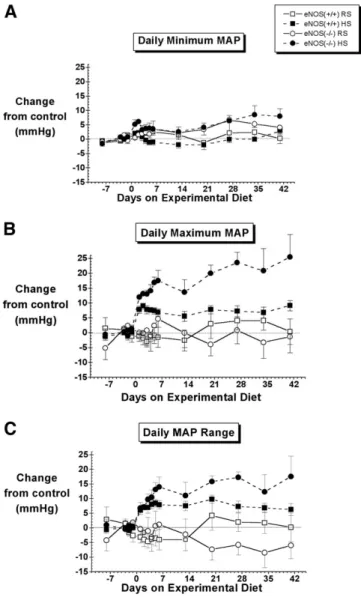
The BP of C57Bl/6J mice was bimodally distributed (Fig. 2), the left and right modes of the distribution cor-responding to values recorded during periods of inactivity and activity, respectively.26After 6 weeks on the high-salt diet, the BP distribution of eNOS⫺/⫺ mice was wider, with significant increases in the daily maximum MAP and daily MAP range, but little to no change in the daily minimum MAP level (Fig. 3,Table 2). In contrast, little to no change was observed in the MAP distributions of eNOS⫹/⫹ mice fed a high-salt diet (Figs. 2and3,Table 2). Pulse Pressure
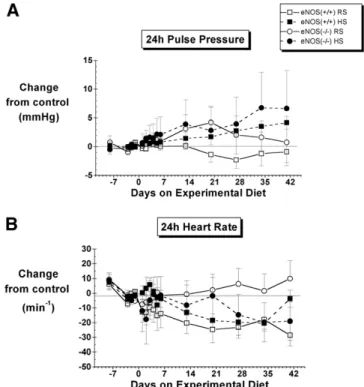
Pulse pressure tended to increase on the high-salt diet, but this tendency reached significance only in the case of the eNOS⫹/⫹ mice (Fig. 4,Table 2).
Heart Rate
In eNOS⫺/⫺ mice, the high-salt diet was associated with a tendency for the HR to decrease from that of the control group, reaching significance in the late phase (Fig. 4,
Table 2). No significant changes were observed in the heart rate of eNOS⫹/⫹ mice.
Locomotor Activity
In both the eNOS⫹/⫹ and eNOS⫺/⫺ mice, the percent-age of time spent active initially increased when the mice were placed on the high-salt diet and gradually decreased toward baseline levels as the protocol progressed (Fig. 5,
Table 2). No significant changes were observed in the intensity of activity (Fig. 5,Table 2).
Discussion
Impaired nitric oxide production is associated with salt-sensitivity of BP.1However, the role of individual NOS isoforms is not well understood. Our data demonstrate that
FIG. 2. Frequency distributions of mean arterial pressure in a
typ-ical control (eNOS⫹/⫹, top) and eNOS knockout mouse (eNOS⫺/⫺,
bottom). Distributions are shown for the control period
(regular-salt diet, dark columns) and on the final day (day 42) of the high-salt diet (hatched columns).
FIG. 3. Effect of a regular-salt (RS) versus high-salt (HS) diet on
the daily range, minimum and maximum mean arterial pressure (MAP) in control (eNOS⫹/⫹) and eNOS knockout (eNOS⫺/⫺) mice.
N⫽ 6 to 8 except on day 2 for which N ⫽ 4 for the eNOS⫺/⫺ HS group. Control values are given inTable 1. Statistical comparisons are shown inTable 2.
eNOS knockout mice exhibit increased salt-sensitivity of BP. This finding suggests that, in addition to its roles as a regulator of regional blood flow and basal BP, the eNOS
isoform also participates in the body’s adaptation to a salt load. In turn, this suggests that impaired production of NO by eNOS could contribute importantly to salt sensitivity and salt-induced hypertension.
Salt-induced increases in the BP of eNOS⫺/⫺ mice were⬃2 to 2.5 fold greater than that of the control strain (Fig. 1). This effect of salt appeared to be caused by a pronounced rightward expansion of the MAP distribution with little to no change in the left-hand edge of the distribution (Fig. 2). This conclusion is consistent with the observed increases in the maximum and 24-h mean MAP level, and the absence of any significant change in the minimal MAP level. Consistent with previous reports in rats27,28 and mice,29 the greatest effects of salt on MAP
occurred during the dark phase of the day (Fig. 1) and during bouts of locomotor activity, irrespective of the time of day (data not shown).
Our conclusion differs markedly from that of a recent study by Mattson and Meister.24In their study, eNOS⫺/⫺
mice of the same sex, genetic background, and origin were reported to be completely salt resistant. The two studies differed in many respects. In the study by Mattson and Meister,24 BP was measured by catheter during brief (3-h/day) recordings made over a 3-day control and 3-day experimental period, 3 to 5 days after catheter installation. In contrast, the present study was based on continuous recordings by telemetry from undisturbed mice commenc-ing 10 to 14 days after telemeter implantation and con-tinuing during 42 days exposure to the high-salt diet. Heart rates differed markedly between the two studies (640 to 667 min⫺1v⬍580 min⫺1in the present study). However, FIG. 4. The effect of a regular-salt (RS) and high-salt (HS) diet on
24-h pulse pressure and heart rate in control (eNOS⫹/⫹) and eNOS knockout (eNOS⫺/⫺) mice. N ⫽ 6 to 8 except on day 2 for which N ⫽ 4 for the eNOS⫺/⫺ HS group. Control values are given inTable 1. SeeTable 2for statistical comparisons.
FIG. 5. The effect of a regular-salt (RS) versus high-salt (HS) diet on the percentage and level (intensity) of activity in eNOS⫹/⫹ and eNOS⫺/⫺ mice. N ⫽ 6 to 8 except on day 2 for which N ⫽ 4 for the eNOS⫺/⫺ HS group. Control values are given inTable 1. SeeTable 2for statistical comparisons. a.u.⫽ arbitrary units.
the most important difference may be the level of salt loading. In the present study, salt loading was achieved by providing an 8% NaCl diet as is often used in rodent studies. Based on measured food consumption rates in our mice, we estimate the salt load in our experiments to be ⬃5 mEq Na/day. In contrast, the salt load in the study by Mattson and Meister24was⬃1 mEq Na/day delivered by intravenous infusion of saline. It is quite possible that we would not have observed salt-sensitivity if we had used this lower level of salt loading. However, it is important to note that the 8% salt diet used in our study was sufficient to elevate BP even in the control strain of C57Bl/6J mice (consistent with previous studies in this strain29,30), whereas control mice showed no response to salt loading in the study by Mattson and Meister.24This is an essential point, as salt resistance in the control mice has the potential to mask an effect of a gene on sensitivity. The moderate salt-sensitivity displayed by our control mice while consuming an 8% salt diet suggests that this protocol is highly appro-priate for investigating the genetic determinants of salt-sensitivity in mice of a C57Bl/6J background.
In summary, our results suggest that the eNOS isoform provides an important contribution to the BP response to salt-loading. Reductions in NO production by eNOS (eg, because of quenching by reactive oxygen species, endog-enous NOS inhibitors, substrate or cofactor limitations) may promote salt-sensitivity and salt-induced hyperten-sion.
References
1. Manning RD, Hu L, Tan DY, Meng S: Role of abnormal nitric oxide systems in salt sensitive hypertension. Am J Hypertens 2001;14: 68S–73S.
2. Ni Z, Oveisi F, Vaziri ND: Nitric oxide synthase isotype expression in salt-sensitive and salt-resistant Dahl rats. Hypertension 1999;34: 552–557.
3. Ni Z, Vaziri ND: Effect of salt loading on nitric oxide synthase expression in normotensive rats. Am J Hypertens 2001;14:155–163. 4. Chen PY, Sanders PW: L-arginine abrogates salt-sensitive
hyper-tension in Dahl/Rapp rats. J Clin Invest 1991;88:1559 –1567. 5. Hu L, Manning RD Jr: Role of nitric oxide in regulation of
long-term pressure-natriuresis relationship in Dahl rats. Am J Physiol 1995;268:H2375–H2383.
6. Miyata N, Cowley AW: Renal intramedullary infusion of L-arginine prevents reduction of medullary blood flow in hypertension in Dahl salt-sensitive rats. Hypertension 1999;33:446 – 450.
7. Tolins JP, Shultz PJ: Endogenous nitric oxide synthesis determines sensitivity to the pressor effect of salt. Kidney Int 1994;46:230 –236. 8. Yamada SS, Sassaki AL, Fujihara CK, Malheiros DMAV, De Nucci G, Zatz R: Effect of salt intake and inhibitor dose on arterial hypertension and renal injury induced by chronic nitric oxide block-ade. Hypertension 1996;27:1165–1172.
9. Rudd MA, Trolliet M, Hope S, Scribner AW, Daumerie G, Toolan G, Cloutier T, Loscalzo J: Salt-induced hypertension in Dahl salt-resistant and salt-sensitive rats with NOS II inhibition. Am J Physiol 1999;277:H732–H739.
10. Tan DY, Meng S, Cason GW, Manning RD JR: Mechanisms of salt-sensitive hypertension: role of inducible nitric oxide synthase. Am J Physiol Regul Integr Comp Physiol 2000;279:R2297–R2303. 11. Campese VM, Tawadrous M, Bigazzi R, Bianchi S, Mann AS,
Oparil S, Raij L: Salt intake and plasma atrial natriuretic peptide and nitric oxide in hypertension. Hypertension 1996;28:335–340. 12. Higashi Y, Oshima T, Watanabe M, Matsuura H, Kajiyama G:
Renal response to L-arginine in salt-sensitive patients with essential hypertension. Hypertension 1996;27:643– 648.
13. Campese VM, Amar M, Anjali C, Medhat T, Wurgaft A: Effect of L-arginine on systemic and renal haemodynamics in salt-sensitive patients with essential hypertension. J Hum Hypertens 1997;11: 527–532.
14. Miyoshi A, Suzuki H, Fujiwara M, Masai M, Iwasaki T: Impairment of endothelial function in salt-sensitive hypertension in humans. Am J Hypertens 1997;10:1083–1090.
15. Barba G, Vallance PJ, Strazzullo P, MacAllister RJ: Effects of sodium intake on the pressor and renal responses to nitric oxide synthesis inhibition in normotensive individuals with different so-dium sensitivity. J Hypertens 2000;18:615– 621.
16. Fujiwara N, Osanai T, Kamada T, Katoh T, Takahashi K, Okumura K: Study on the relationship between plasma nitrite and nitrate level and salt sensitivity in human hypertension: modulation of nitric oxide synthesis by salt intake. Circulation 2000 29;101: 856 – 861.
17. Ortiz PA, Garvin JL: Cardiovascular and renal control in NOS-deficient mouse models. Am J Physiol Regul Integr Comp Physiol 2002;284:R628 –R638.
18. Mattson DL, Maeda CY, Bachman TD, Cowley AW: Inducible nitric oxide synthase and blood pressure. Hypertension 1998;31:15–20. 19. Mattson DL, Meister CJ: Renal cortical and medullary blood flow
responses to L-NAME and ANG II in wild-type, nNOS null mutant, and eNOS null mutant mice. Am J Physiol Regul Integr Comp Physiol 2005;289:R991–R997.
20. Plato CF, Shesely EG, Garvin JL: eNOS mediates L-arginine-induced inhibition of thick ascending limb chloride flux. Hyperten-sion 2000;35:319 –323.
21. Soares TJ, Coimbra TM, Martins AR, Pereira AG, Carnio EC, Branco LG, Albuquerque-Araujo WI, de Nucci G, Favaretto AL, Gutkowska J, McCann SM, Antunes-Rodrigues J: Atrial natriuretic peptide and oxytocin induce natriuresis by release of cGMP. Proc Natl Acad Sci USA 1999;96:278 –283.
22. Costa MA, Elesgaray R, Loria A, Balaszczuk AM, Arranz C: Vascular and renal effects of dopamine during extracellular volume expansion: role of nitric oxide pathway. Life Sci 2006;78:1543–1549.
23. Kohan DE: The renal medullary endothelin system in control of sodium and water excretion and systemic blood pressure. Curr Opin Nephrol Hypertens 2006;15:34 – 40.
24. Mattson DL, Meister CJ: Sodium sensitivity of arterial blood pres-sure in L-NAME hypertensive but not eNOS knockout mice. Am J Hypertens 2006;19:327–329.
25. Shesely EG, Maeda N, Lim H-S, Desai KM, Krege JH, Lauback VE, Sherman PA, Sessa WC, Smithies O: Elevated blood pressures in mice lacking endothelial nitric oxide synthase. Proc Natl Acad Sci 1996;93:13176 –13181.
26. Van Vliet BN, Chafe LL, Montani JP: Characteristics of 24-h telemetered blood pressure in eNOS-knockout mice and C57BL/6J control mice. J Physiol 2003;549.1:313–325.
27. Osborn JW, Hornfeldt BJ: Arterial baroreceptor denervation impairs long-term regulation of arterial pressure during dietary salt loading. Am J Physiol 1998;275:H1558 –H1566.
28. Huang BS, Van Vliet BN, Leenen FH: Increases in CSF [Na⫹] precede the increases in blood pressure in Dahl S rats and SHR on a high-salt diet. Am J Physiol Heart Circ Physiol 2004;287:H1160 –H1166. 29. Carlson SH, Wyss JM: Long-term telemetric recording of arterial
pressure and heart rate in mice fed basal and high NaCl diets. Hypertension 2000;35:E1–E5.
30. Gros R, Van Wert R, You X, Thorin E, Husain M: Effects of age, gender, and blood pressure on myogenic responses of mesenteric arteries from C57BL/6 mice. Am J Physiol Heart Circ Physiol 2002;282:H380 –H388.