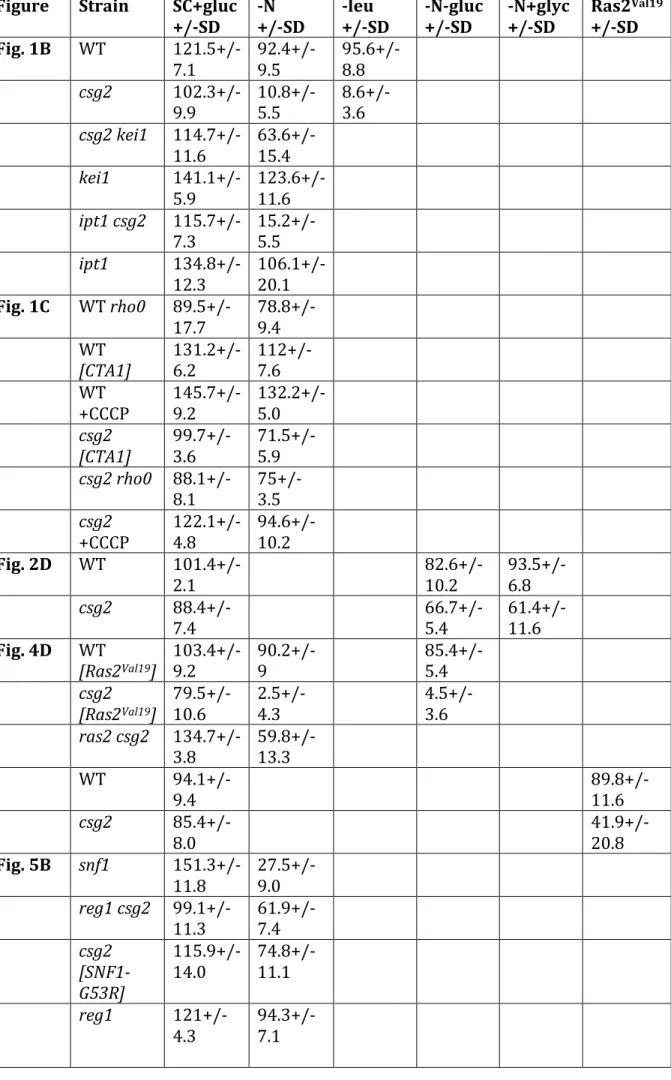
Supplemental Table 1-Mean colony numbers +/- standard deviation for cell viability assays.. Cell counts were in duplicate, n=3.
Figure Strain SC+gluc
+/-SD -N +/-SD -leu +/-SD -N-gluc +/-SD -N+glyc +/-SD Ras2 Val19 +/-SD Fig. 1B WT 121.5+/-7.1 92.4+/- 9.5 95.6+/- 8.8 csg2 102.3+/- 9.9 10.8+/- 5.5 8.6+/- 3.6 csg2 kei1 114.7+/- 11.6 63.6+/- 15.4 kei1 141.1+/- 5.9 123.6+/- 11.6 ipt1 csg2 115.7+/- 7.3 15.2+/- 5.5 ipt1 134.8+/- 12.3 106.1+/- 20.1 Fig. 1C WT rho0 89.5+/- 17.7 78.8+/- 9.4 WT [CTA1] 131.2+/-6.2 112+/- 7.6 WT +CCCP 145.7+/- 9.2 132.2+/- 5.0 csg2 [CTA1] 99.7+/- 3.6 71.5+/- 5.9 csg2 rho0 88.1+/- 8.1 75+/- 3.5 csg2 +CCCP 122.1+/- 4.8 94.6+/- 10.2 Fig. 2D WT 101.4+/- 2.1 82.6+/- 10.2 93.5+/- 6.8 csg2 88.4+/- 7.4 66.7+/- 5.4 61.4+/- 11.6 Fig. 4D WT [Ras2Val19] 103.4+/- 9.2 90.2+/- 9 85.4+/- 5.4 csg2 [Ras2Val19] 79.5+/- 10.6 2.5+/-4.3 4.5+/- 3.6 ras2 csg2 134.7+/-3.8 59.8+/- 13.3 WT 94.1+/- 9.4 89.8+/- 11.6 csg2 85.4+/- 8.0 41.9+/- 20.8 Fig. 5B snf1 151.3+/- 11.8 27.5+/- 9.0 reg1 csg2 99.1+/- 11.3 61.9+/- 7.4 csg2 [SNF1-G53R] 115.9+/- 14.0 74.8+/- 11.1 reg1 121+/-4.3 94.3+/- 7.1
Supplemental Fig. 1-(A) Cell staining with propidium iodide confirms rapid and
massive cell death in csg2∆ cells deprived of nitrogen. (B) Cells were shifted to nitrogen deprivation medium for various times and stained with propidium iodide and annexin V-FITC (Clontech Laboratories) according to manufacturer’s
instructions. As a positive control for apoptotic death, wild-type cells were exposed to 10 mM H2O2 for 4h before annexin V-FITC staining. (C) Growth of csg2∆ cells on SC plates with H2O2.
Supplemental Fig. 2-Relative mitochondrial membrane potential, assayed by TMRM
fluorescence. Fluorescence images were quantitated by Image J; 50
cells/experiment; n = 3. (A) ETC inhibitors (antimycin A, 100 µM; Na azide, 10 µM; CCCP, 10 µM; TET, 100 µM) were added for 60 min before staining with TMRM, as described in Methods. (B) Representative images of TMRM fluorescence with Mitotracker green to localize mitochondria in mid-log cells. Matched exposure indicates csg2∆ cells photographed at the same exposure time with images adjusted at the same Photoshop settings as those for wild-type cells. (C) Quantitation of TMRM fluorescence in mid-log cells and after shifting to nitrogen deprivation medium for 1h.
Supplemental Fig. 3- Oxygraph measurement of O2 consumption by mitochondria isolated from WT and csg2∆ cells growing in SC medium with 3% glycerol.
Mitochondria were normalized to protein. State (1) indicates basal mitochondrial O2 consumption. State (2) indicates O2 consumption after addition of 10 µM
α ketoglutarate. State (3) is after addition 500 µM ADP, reflecting Vmax respiration. State (4) occurs after consumption of ADP.
Supplemental Fig. 4- (A) Cytoplasmic catalase activity, measured in cell lysate, and
mitochondrial catalase activity, measured in isolated mitochondria, are decreased in cells expressing MET-RAS2Val19, and in csg2∆ cells. Hyperactive Ras was induced by washing exponentially growing cells with water and resuspending in methionine-free medium for 1h. CTT1 and CTA1 encode cytoplasmic and mitochondrial catalase activity, respectively.
(B) Heat shock sensitivity was measured by shifting cells to 52°C for 10 min and then plating for viability. Colony numbers were expressed as a percent of those formed from cells that were not temperature-shifted but plated directly.
(C) Hyperactive Ras2Val19 prevents increased MMP during nitrogen deprivation. Exponentially growing wild-type cells bearing pMET-RAS2Val19 were washed with water and incubated in medium with or without methionine for 3h; cells were then washed with water and resuspended in nitrogen deprivation medium for 1h. Relative MMP was measured by TMRM fluorescence; fluorescence in 50 cells were quantitated by Image J/experiment; n = 3.
Supplemental Fig. 5- ROS accumulation in csg2∆ cells is abrogated by reg1∆,
constitutively activating Snf1; ROS accumulates in snf1∆ cells during nitrogen deprivation. (A) Quantitation of DHE stained cells post-nitrogen deprivation; fluorescence in 150 total cells quantitated by Image J; n = 3. (B) DHE staining of cells after nitrogen deprivation for 4h.