Publisher’s version / Version de l'éditeur:
https://publications-cnrc.canada.ca/fra/droits
L’accès à ce site Web et l’utilisation de son contenu sont assujettis aux conditions présentées dans le site
LISEZ CES CONDITIONS ATTENTIVEMENT AVANT D’UTILISER CE SITE WEB.
Client Report (National Research Council of Canada. Construction), 2014-12
READ THESE TERMS AND CONDITIONS CAREFULLY BEFORE USING THIS WEBSITE. https://nrc-publications.canada.ca/eng/copyright
NRC Publications Archive Record / Notice des Archives des publications du CNRC :
https://nrc-publications.canada.ca/eng/view/object/?id=1898139a-15da-4e3c-8242-bad41bbc85fd https://publications-cnrc.canada.ca/fra/voir/objet/?id=1898139a-15da-4e3c-8242-bad41bbc85fd
NRC Publications Archive
Archives des publications du CNRC
For the publisher’s version, please access the DOI link below./ Pour consulter la version de l’éditeur, utilisez le lien DOI ci-dessous.
https://doi.org/10.4224/21274560
Access and use of this website and the material on it are subject to the Terms and Conditions set forth at
Full-scale standard fire resistance test of a wall assembly for use in
lower storeys of mid-rise buildings: report to Research Consortium for
Wood and Wood-Hybrid Mid-Rise Buildings
NATIONAL RESEARCH COUNCIL CANADA
FULL-SCALE STANDARD FIRE
RESISTANCE TEST OF A WALL
ASSEMBLY FOR USE IN LOWER
STOREYS OF MID-RISE BUILDINGS
CLIENT REPORT: A1-004691.1
Full-Scale Standard Fire Resistance Test of a Wall Assembly
for Use in Lower Storeys of Mid-Rise Buildings
P-S. Lafrance, R. Berzins, P. Leroux, J.Z. Su, and G.D. Lougheed
Report No.
A1-004691.1
Report date: December 31, 2014
Contract No. A1-004691
Prepared for Canadian Wood Council
28 pages
This report may not be reproduced in whole or in part without the written consent of both the client and the National Research Council of Canada.
Full-Scale Standard Fire Resistance Test of a Wall Assembly for Use in Lower Storeys of Mid-Rise Buildings
P-S. Lafrance, R. Berzins, P. Leroux, J.Z. Su and G.D. Lougheed
INTRODUCTION
The acceptable solutions provided in the 2010 National Building Code of Canada (NBC) Division B [1] limits the use of combustible (wood) construction based on building height and area requirements. For buildings that exceed the height and area requirements for combustible construction, the prescriptive requirements in the 2010 NBC require that noncombustible construction be used for the primary structural elements.
A research project, Wood and Wood-Hybrid Midrise Buildings, was undertaken to develop information to be used as the basis for alternative/acceptable solutions for mid-rise construction using wood structural elements. As one approach, encapsulation materials could be used to protect the combustible (wood) structural materials for a period of time in order to delay the effects of the fire on the combustible structural elements, including delay of ignition. In delaying ignition, any effects of the combustion of the combustible structural elements on the fire severity can be delayed. In some cases, and depending upon the amount of encapsulating material used (e.g. number of layers), ignition of the elements might be avoided completely. This scenario would primarily depend upon the fire event and the actual fire performance of the encapsulating materials used. The effectiveness of the encapsulation approach in limiting the involvement of wood structural materials in fires was demonstrated in the research project through bench-, intermediate- and full-scale fire experiments.
In addition to developing the encapsulation approach for protecting the wood structural
materials to meet the code intent, research was undertaken to examine standard fire resistance of encapsulated wood structural assemblies for use in mid-rise wood/timber buildings. One of the major differences between structural lightweight wood frame (LWF) assemblies used in mid-rise wood buildings (5-6 storeys) and low-mid-rise wood buildings (≤ 4 stories) is the wall assemblies for the lower storeys. For mid-rise wood buildings, loadbearing wall assemblies on the lower storeys have to be designed to resist higher axial loads due to the self-weight of the upper storeys, which often result in the need for larger-size stud members and/or a greater number of studs, and higher lateral loads in case of seismic events or wind loads, which often requires the use of wood shear panels within the wall assembly. These wall assemblies very often will need to meet standard fire resistance requirements, and therefore, information regarding their standard fire-resistance ratings should be developed.
Five full-scale furnace tests were conducted in conformance with CAN/ULC-S101 [2] to
determine the standard fire resistance of encapsulated lightweight wood frame wall assemblies for use in mid-rise applications. The test assemblies and the results of the five tests are
provided in Reference [3].
One of the wall assemblies used in the previous tests [3], Wall Assembly #5, was constructed using 2x6 (38 mm x 140 mm) staggered studs spaced at 400 mm o.c., a 2x8 (38 mm x 190 mm) double top plate, 2x8 single bottom plate and 2x8 single end studs. At the structural failure of this wall assembly at 81 min, many of the studs, particularly those on the exposed side of the
mid-height to determine if the deformation of the studs within the plane of the wall assembly could be reduced and the fire endurance period for the assembly increased. This report provides the results of the test with the modified wall assembly (Wall Assembly #6).
FULL-SCALE EXPERIMENT Test Method and Setup
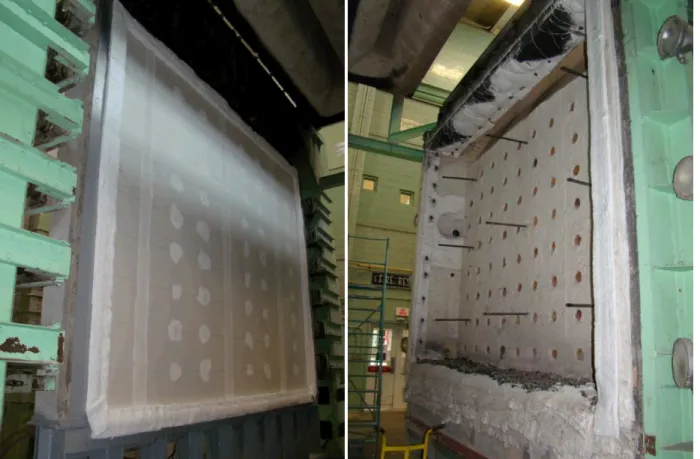
A full-scale furnace test was conducted to determine the fire endurance period for a generic encapsulated LWF assembly. The test was conducted in conformance with CAN/ULC-S101 [2], with additional instrumentation installed for research data collection. Figure 1 shows the wall furnace used for the fire resistance test.
Figure 1. Full-scale wall furnace used for fire resistance test. Description of Test Assembly and Instrumentation
2x4 (38 mm x 89 mm) wood material, was added at the mid-height of the wall assembly (see Figure 3 and Figure 5).
For both assemblies, a shear membrane layer of 11.1 mm thick OSB was attached to one side of the framing. Two layers of 12.7 mm thick Type X gypsum board were applied to both sides of the framing. 140 mm thick glass fibre insulation was installed in the wall cavities. The insulation was installed with its back side (side facing the studs) partially scored (leaving approximately 70 mm not scored) so that it wrapped around the center staggered stud and that the gypsum board was not put under excessive stress.
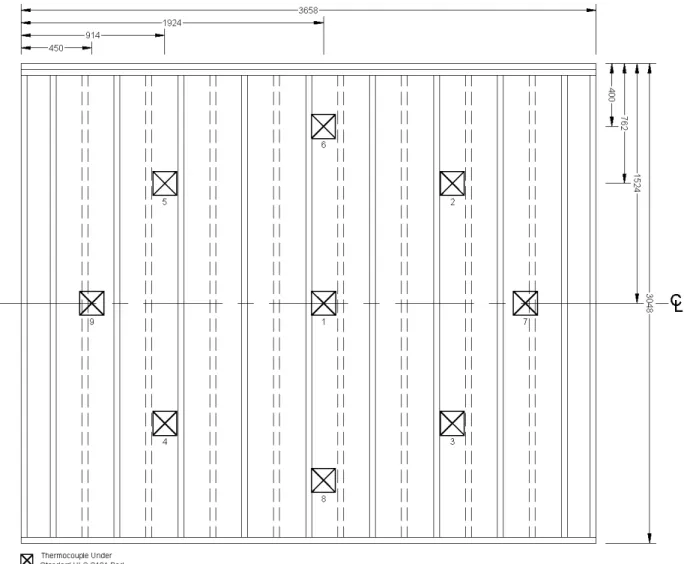
Figure 8 and Figure 9 show nine deflection gauges and nine padded thermocouples installed on the unexposed surface of the wall assembly. In addition, a set of 80 thermocouples were embedded at various interfaces across the wall assembly as shown in Figure 10, including gypsum board-gypsum board, gypsum board-stud, gypsum board-cavity, stud-cavity, cavity-OSB, stud-OSB and gypsum board-OSB interfaces.
A total superimposed load of 506 kN was applied along the width of the assembly, satisfying a full specified load condition as per CAN/ULC-S101. The side without the shear membrane layer was exposed to the fire.
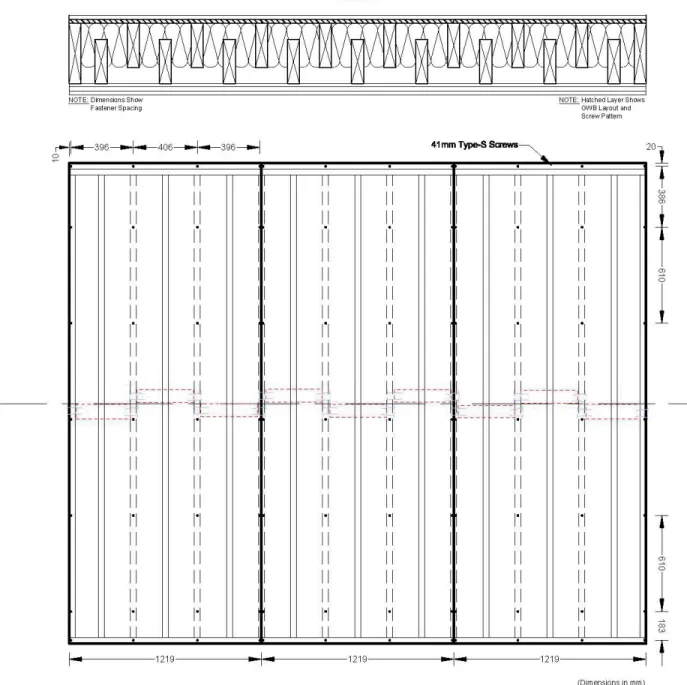
Figure 3. Base layer of gypsum board on exposed side of wall assembly with horizontal blocking at mid-height.
Figure 5. Shear membrane layer of OSB panel on unexposed side of wall assembly with horizontal blocking at mid-height.
RESULTS
Plots showing the data for all the measurements for the wall assembly (Wall Assembly #6) are provided in Appendix A.
Figure 11 shows the average furnace temperature (Furavg) measured during the test. There is a
good comparison between the measured temperature and the temperature specified in CAN/ULC-S101 [2].
Also shown in Figure 11 are the average temperatures measured at the interface between the face and base layers of gypsum board (GB/GB), the interface between the base gypsum board layer and the wall cavity (GB/Cavity), and the interface between the base gypsum board layer and the studs (GB/stud), on the exposed side of the wall assembly.
The average temperature at the interface between the face and base gypsum board layers was < 100C for 11.5 min and was > 300C after 23.5 min. After 11.5 min, there was a continuous increase in temperature until 85 min. After 85 min, the temperature was comparable to the temperature in the furnace. This suggests some of the face layer of gypsum board remained in place until near the end of the test.
Initially, there was a slow temperature increase at the interface between the base layer of gypsum board and the cavity and between the base layer and the studs, with the temperatures < 150C for 43.3 min. Subsequently, there was a more rapid temperature increase at both interfaces, with the fastest increase at the gypsum board-cavity interface. The average temperatures exceeded 300C at the gypsum board-cavity and the gypsum board-stud
interfaces at 49.7 min and 55.5 min, respectively. The temperatures were < 600C for 68.5 min. The average temperature measured at gypsum board-cavity and gypsum board-stud interfaces increased more rapidly after approximately 88 min indicating the base layer of gypsum board was falling off.
Figure 12 shows the average temperatures at the interfaces between the studs and the wall cavity. The measurement locations were: the side of the studs on the exposed side of the wall (Stud Side), the face of the studs on the unexposed side of the wall assembly (Stud Face Unexposed Side), and the face of the studs on the exposed side of the wall assembly (Stud Face Exposed Side). Also shown is the average temperature at the interface between the cavity and the OSB shear membrane layer on the unexposed side of the wall assembly (Cavity/OSB). There was a slow temperature increase on the sides of the studs on the exposed side of the wall assembly. The average temperature was < 100C for 68.5 min and < 300C for 95.0 min. The average temperature measured on the face of the studs on the unexposed side had a slow temperature increase with the average temperature < 100C for 55.7min and < 300C for 80.5 min.
Comparable temperatures were measured on the face of the studs on the exposed side of the wall assembly and at the interface between the cavity and the OSB shear membrane layer on the unexposed side of the wall assembly.
gypsum board layer (OSB/GB), at the interface between the base and face layers of gypsum on the unexposed side (GB/GB (unexposed)), and on the unexposed surface (Unexposed).
There was a gradual temperature increase at all locations beginning at approximately 15 min. The temperatures at all locations were 112.1C or less at the end of the test. The highest temperatures were measured at the interface between OSB shear membrane and the gypsum board base layer.
Figure 14 shows the average and maximum deflections measured during the test. The maximum deflection was measured by Deflection Gauge 5 located at the center of the wall assembly. There was minimal deflection for the initial 60 min. Subsequently, there was a continuous increase in the rate at which the assembly deflected until structural failure. The wall assembly failed structurally at 98 min with the studs deforming perpendicular to the plane of the wall. The addition of the horizontal blocking limited the in-plane deformation of the studs. This resulted in a 17 min increase in the fire endurance period compared with the wall assembly without the blocking (Wall Assembly #5 in Reference [3]).
Time (min) 0 10 20 30 40 50 60 70 80 90 100 T em pe ra tu re ( ºC ) 0 100 200 300 400 500 600 700 800 900 1000 1100 1200 S101 Furavg GB/GB GB/Cavity GB/Stud
Notes: GB/GB is the average of TCs #10-21; GB/Cavity is the average of TCs #22, 25, 27, 28, 30 and 33; GB/Stud is the average of TCs #23, 24, 26, 29, 31 and 32.
Figure 11. Furnace temperatures and average temperatures at interfaces on exposed side of the wall assembly.
Time (min) 0 10 20 30 40 50 60 70 80 90 100 T em p er at ur e (º C ) 0 100 200 300 400 500 600 700 800 Stud Side
Stud Face Unexposed Side Stud Face Exposed Side Cavity/OSB (unexposed side)
Notes: Stud Side is the average of TCs #34-45; Stud Face Unexposed is the average of TCs #46-51;
Time (min) 0 10 20 30 40 50 60 70 80 90 100 T em pe ra tu re ( ºC ) 0 20 40 60 80 100 120 140 160 180 200 Stud/OSB OSB/GB GB/GB (unexposed) Unexposed
Notes: Stud/OSB is the average of TCs #60 and 63; OSB/GB is the average of TCs #66-77; GB/GB (unexposed) is the average of TCs #78-89; Unexposed is the average of TCs #1-9.
Figure 13. Average temperatures on unexposed side of the wall assembly.
0 10 20 30 40 50 60 70 80 90 100 D ef le ct io n (m m ) -100 -90 -80 -70 -60 -50 -40 -30 -20 -10 0 10 Average Deflection Maximum Deflection
SUMMARY
This report documents the results of a full-scale furnace test conducted to investigate the
standard fire resistance performance of a generic wall assembly (Wall Assembly #6). Staggered studs were used for the wall assembly, a shear membrane layer of 11.1 mm thick OSB was attached to the unexposed side of the framing, and both sides of the assembly were protected using two layers of 12.7 mm thick Type X gypsum board.
The framing for the wall assembly was the same as that used for Wall Assembly #5 in
Reference 2. However, horizontal blocking was added at the mid-height of the assembly to limit the deformation of the studs in the plane of the wall assembly. The fire endurance period for the wall assembly was 98 min compared with 81 min for the wall assembly without horizontal blocking.
ACKNOWLEDGMENTS
Financial and in-kind support for the project provided by the Canadian Wood Council is
gratefully acknowledged. Extensive technical input by Ineke Van Zeeland and Peggy Lepper is also gratefully acknowledged.
REFERENCES
1. 2010 NBC, National Building Code of Canada, National Research Council, Ottawa, Ontario, 2010.
2. CAN/ULC-S101, Standard Methods of Fire Endurance Tests of Building Construction and Materials Underwriters Laboratories of Canada, Ottawa, Ontario, 2007.
3. Lafrance, P-S, Berzins, R., Leroux, P., Su, J.Z., Lougheed, G.D. and Bénichou, N.,
Alternative Solution for Mid-Rise Wood Construction: Full-Scale Standard Fire Resistance Tests of Wall Assemblies for Use in Lower Storeys of Mid-Rise Buildings, CLIENT REPORT A1-100035-01.8, National Research Council, Ottawa, Ontario, 2013.
APPENDIX A- DATA FOR WALL ASSEMBLY #6
A series of plots showing the results of the measurements for Wall Assembly #6 are provided. The plots are:
1. Figures A-1 and A-2 show the temperatures measured at the interface between the face and base layers of gypsum board on the exposed side of the wall assembly at the ¼ and ¾ heights from the top of assembly, respectively.
2. Figure A-3 shows the temperatures measured at the interface between the base layer of gypsum board and the studs on the exposed side of the wall assembly.
3. Figure A-4 shows the temperatures measured at the interface between the base layer of gypsum board and the wall cavity on the exposed side of the wall assembly.
4. Figures A-5 and A-6 show the temperatures measured on the sides of the studs on the exposed side of the wall assembly at the ¼ and ¾ heights from the top of assembly, respectively.
5. Figures A-7 and A-8 show the temperatures measured on the face of the studs on the unexposed and exposed side of the wall assembly, respectively.
6. Figures A-9 and A-10 show the temperatures measured at the interface between the wall cavity and the OSB shear membrane layer and between the stud and the OSB shear membrane layer, respectively.
7. Figures A-11 and A-12 show the temperatures measured at the interface between the OSB shear membrane layer and the base gypsum board layer on the unexposed side of the wall assembly at the ¼ and ¾ heights from the top of assembly, respectively.
8. Figures A-13 and A-14 show the temperatures measured at the interface between the base and face gypsum board layers on the unexposed side of the wall assembly at the ¼ and ¾ heights from the top of assembly, respectively.
9. Figure A-15 shows the temperatures measured on the unexposed side of the wall assembly.
10. Figure A-16 shows the average furnace temperature measured during the test. 11. Figures A-17, A-18 and A-19 show the deflections measured at the ¼, mid- and ¾
Time (min) 0 10 20 30 40 50 60 70 80 90 100 T em pe ra tu re ( ºC ) 0 100 200 300 400 500 600 700 800 900 1000 1100 1200 TC 10 TC 11 TC 12 TC 13 TC 14 TC 15
Figure A-1. Temperatures measured at interface between face and base gypsum board layers at ¼ height from top on exposed side of wall assembly.
Time (min) 0 10 20 30 40 50 60 70 80 90 100 T em pe ra tu re ( ºC ) 0 100 200 300 400 500 600 700 800 900 1000 1100 1200 TC 16 TC 17 TC 18 TC 19 TC 20 TC 21
Notes: TCs#16 and 17 measured extreme temperature decreases towards the end of the test, which could be
Time (min) 0 10 20 30 40 50 60 70 80 90 100 T em pe ra tu re ( ºC ) 0 100 200 300 400 500 600 700 800 900 1000 1100 TC 23 TC 24 TC 26 TC 29 TC 31 TC 32
Figure A-3. Temperatures measured at interface between base gypsum board layer and studs on exposed side of wall assembly.
T em pe ra tu re ( ºC ) 0 100 200 300 400 500 600 700 800 900 1000 1100 TC 22 TC 25 TC 27 TC 28 TC 30 TC 33
Time (min) 0 10 20 30 40 50 60 70 80 90 100 110 T em pe ra tu re ( ºC ) 0 100 200 300 400 500 600 700 800 900 1000 1100 TC 34 TC 35 TC 36 TC 37 TC 38 TC 39
Figure A-5. Temperatures measured on sides of studs on exposed side at ¼ height from top of wall assembly.
Time (min) 0 10 20 30 40 50 60 70 80 90 100 110 T em pe ra tu re ( ºC ) 0 100 200 300 400 500 600 700 800 900 1000 1100 TC 40 TC 41 TC 42 TC 43 TC 44 TC 45
Time (min) 0 10 20 30 40 50 60 70 80 90 100 T em pe ra tu re ( ºC ) 0 100 200 300 400 500 600 700 800 900 1000 1100 TC 46 TC 47 TC 48 TC 49 TC 50 TC 51
Figure A-7. Temperatures measured on face of studs on unexposed side of wall assembly. T em pe ra tu re ( ºC ) 0 100 200 300 400 500 600 700 800 900 1000 1100 TC 52 TC 53 TC 54 TC 55 TC 56 TC 57
Time (min) 0 10 20 30 40 50 60 70 80 90 100 T em pe ra tu re ( ºC ) 0 100 200 300 400 500 600 700 800 900 1000 1100 TC 58 TC 59 TC 61 TC 62 TC 64 TC 65
Figure A-9. Temperatures measured at interface between wall cavity and OSB shear membrane layer on unexposed side of wall assembly.
Time (min) 0 10 20 30 40 50 60 70 80 90 100 T em pe ra tu re ( ºC ) 0 100 200 300 400 500 600 700 800 900 1000 1100 TC 60 TC 63
Time (min) 0 10 20 30 40 50 60 70 80 90 100 T em pe ra tu re ( ºC ) 0 50 100 150 200 250 300 350 400 450 500 TC 66 TC 67 TC 68 TC 69 TC 70 TC 71
Figure A-11. Temperatures measured at interface between OSB shear membrane layer and gypsum board base layer at ¼ height from top on unexposed side of wall assembly. 0 10 20 30 40 50 60 70 80 90 100 T em pe ra tu re ( ºC ) 0 50 100 150 200 250 300 350 400 450 500 TC 72 TC 73 TC 74 TC 75 TC 76 TC 77
Time (min) 0 10 20 30 40 50 60 70 80 90 100 T em pe ra tu re ( ºC ) 0 20 40 60 80 100 120 140 160 180 200 TC 78 TC 79 TC 80 TC 81 TC 82 TC 83
Figure A-13. Temperatures measured at interface between base and face gypsum board layers at ¼ height from top on unexposed side of wall assembly.
Time (min) 0 10 20 30 40 50 60 70 80 90 100 T em pe ra tu re ( ºC ) 0 20 40 60 80 100 120 140 160 180 200 TC 84 TC 85 TC 86 TC 87 TC 88 TC 89
Time (min) 0 10 20 30 40 50 60 70 80 90 100 T em pe ra tu re ( ºC ) 0 20 40 60 80 100 120 140 160 180 200 TC 1 TC 2 TC 3 TC 4 TC 5 TC 6 TC 7 TC 8 TC 9
Figure A-15. Temperatures measured on unexposed side of wall assembly.
0 10 20 30 40 50 60 70 80 90 100 T em pe ra tu re ( ºC ) 0 100 200 300 400 500 600 700 800 900 1000 1100 1200 S101 Furavg
Time (min) 0 10 20 30 40 50 60 70 80 90 100 D ef le ct io n (m m ) -100 -90 -80 -70 -60 -50 -40 -30 -20 -10 0 10 DFL-01 DFL-02 DFL-03
Figure A-17. Deflections measured at ¼ height from top of wall assembly.
Time (min) 0 10 20 30 40 50 60 70 80 90 100 D ef le ct io n (m m ) -100 -90 -80 -70 -60 -50 -40 -30 -20 -10 0 10 DFL-04 DFL-05 DFL-06
Time (min) 0 10 20 30 40 50 60 70 80 90 100 D ef le ct io n (m m ) -100 -90 -80 -70 -60 -50 -40 -30 -20 -10 0 10 DFL-07 DFL-08 DFL-09