https://doi.org/10.1038/s41396-017-0033-5 A R T I C L E
Corallivory and the microbial debacle in two branching
scleractinians
Yvan Bettarel1●Sébastien Halary2●Jean-Christophe Auguet1●Thanh Chi Mai3●Ngoc Van Bui3●Thierry Bouvier1● Patrice Got1●Corinne Bouvier1●Sonia Monteil-Bouchard2●Desnues Christelle2
Received: 30 May 2017 / Revised: 21 November 2017 / Accepted: 1 December 2017 / Published online: 16 January 2018 © International Society for Microbial Ecology 2018
Abstract
The grazing activity by specific marine organisms represents a growing threat to the survival of many scleractinian species. For example, the recent proliferation of the corallivorous gastropod Drupella now constitutes a critical case in all South-East Asian waters. If the damaging effects caused by this marine snail on coral polyps are relatively well known, the indirect incidence of predation on coral microbial associates is still obscure and might also potentially impair coral health. In this study, we compared the main ecological traits of coral-associated bacterial and viral communities living in the mucus layer of Acropora formosa and Acropora millepora, of healthy and predated individuals (i.e., colonized by Drupella rugosa), in the Bay of Van Phong (Vietnam). Our results show a substantial impact of the gastropod on a variety of microbiological markers. Colonized corals harbored much more abundant and active epibiotic bacteria whose community composition shifted toward more pathogenic taxa (belonging to the Vibrionales, Clostridiales, Campylobacterales, and Alteromonadales orders), together with their specific phages. Viral epibionts were also greatly influenced by Drupella corallivory with spectacular modifications in their concentrations, life strategies, genotype richness, and diversity. Novel and abundant circular Rep-encoding ssDNA viruses (CRESS-DNA viruses) were detected and characterized in grazed corals and we propose that their occurrence may serve as indicator of the coral health status. Finally, our results reveal that corallivory can cause severe dysbiosis by altering virus–bacteria interactions in the mucus layer, and ultimately favoring the development of local opportunistic infections.
Introduction
Coral reefs are certainly one of the most diverse and complex ecosystems in the global ocean, with considerable economic, societal, and ecological values [1,2]. Yet, they are facing
massive decline due to local (i.e., infectious diseases, over-fishing, pollution, storms, and predation) and global threats (i.e., warming and acidification of the oceans) [3,4]. Among the known corallivorous organisms, the crown-of-thorns starfish is certainly one of the most emblematic in the lit-erature [5]. However, corals are also preyed upon by a variety of other macro-consumers, includingfish, polychaete worms, crabs, and gastropods [6–10]. Regarding the latter, the case of the marine snail Drupella (Gastropoda: Mur-icidae) is interesting and has attracted increasing attention over the last few years, with numbers of reports showing their worrying proliferation in the Indo Pacific region [11– 13]. Indeed this gastropod has the potential to devastate wide areas of coral reefs when occurring at high densities [14]. This has been observed on several occasions since the 1980s, where large aggregations of Drupella populations were reported in Western Australia, Japan, Hong Kong, Thailand and the Red Sea, and in some cases, coral cover was reduced by up to 75% [11,12, show,15–19]. Drupella prefers to feed on fast-growing species with complex, branching forms such * Yvan Bettarel
1 UMR MARBEC IRD-CNRS-IFREMER-Université Montpellier,
Montpellier, France
2 Aix-Marseille Université, CNRS 7278, IRD 198, INSERM 1095,
Assistance-Publique des Hôpitaux de Marseille, Unité de Recherche sur les Maladies Infectieuses Tropicales Emergentes (URMITE), IHU Méditerranée Infection, Marseille, France
3 Institute of Biotechnology (IBT) of Hanoi, Vietnam Academy of
Science and Technology (VAST), Hanoi, Vietnam
Electronic supplementary material The online version of this article (https://doi.org/10.1038/s41396-017-0033-5) contains supplementary material, which is available to authorized users.
123456789
as Acropora and Pocillopora [11,20], but can potentially feed on most corals in the absence of their preferred species [21]. By rasping the live tissue from coral skeletons with their specialised radula [22], Drupella, produces grazing scars, which can significantly alter the growth rate and fitness of corals. However, it is still unclear whether damaged or diseased corals attract Drupella, or whether Drupella out-breaks promote coral disease.
The predation activity by Drupella raises numbers of other underlying issues for coral health, including its collateral impact on coral-associated microbial communities, which could be an additional source of perturbation for corals [13,23]. Indeed, we know that bacterial and viral associates within the coral holobiont play many crucial functions for scleractinians (reviewed in references [24–27]). Bacteria, for example, can provide protection against pathogens through their ability to synthesize antimicrobial compounds, such as peptides and antibiotics [28–31], and they also ensure corals some of their essential nutritional needs [32]. Regarding viruses, their contribution to the immune system of corals has been also theorized with the Bacteriophage adherence to mucus concept, which postulates that viruses could serve as a lytic shield against bacterial pathogens [33]. In addition, the large occurrence of temperate viruses (reproducing via lysogenic pathways) within the coral holobiont may also paradoxically be able to strengthen the protection of sym-biotic bacterial hosts by immunizing them against other viral infections [34,35].
Finally, all these different beneficial–detrimental inter-actions between viruses, bacteria, and corals are complex and fragile, and any modifications of the equilibrium within this triangular relationship could have major consequences for the survival of corals [27,36]. Thus, shifts in bacterial and/or viral composition often coincide with the appearance of signs of coral diseases, thus suggesting strong links between microbes, coral health, and stability of reef eco-systems [37–41].
In this line, coral predators are suspected to promote disease transmission either by acting as vectors of pathogens or stressors on coral microbiota [42,43]. Thus, the presence of Drupella has been correlated with various coral patholo-gies, including the white syndrome [44], the skeletal eroding band disease and black band disease [23], and the brown band disease [13]. However, so far, the microbiome composition of corals colonized by marine gastropods still remains poorly documented [42], and so is the nature of interactions between the predators, coral’s bacterial associates and the surrounding pathogens. Furthermore, the identification and role of coral-associated viruses (potentially regulating both bacterial symbionts and ambient pathogens) in grazed corals are, to our knowledge also totally unknown. As both viral (mostly represented by phages) and bac-terial communities are intimately linked within the coral
holobiont, understanding the overall impact of Drupella on coral microbiota (and therefore its implications for their health) requires a thorough and simultaneous examination of their respective composition. In this study, such high-resolution analyses were conducted from mucus samples of both colonized and ungrazed healthy corals. We investi-gated whether the presence of this snail can potentially modify the growth, activity, and life strategies (lytic and lysogenic) of viral and bacterial associates. The comparison of such ecological traits (i.e., abundance, activity, and diversity) was made between predated and preserved indi-viduals belonging to two Drupella-sensitive species of the Acroporidae family (i.e., Acropora millepora and Acropora formosa), which were collected in the Van Phong Bay (Vietnam). We hypothesize that the injuries caused by the action of the gastropod can destabilize the growth and functions of epibiotic viruses and bacteria, and their inter-actions. We also discuss whether such shifts are capable of facilitating the entry or development of certain pathogens into compromised coral tissue, either by inhibiting certain species or stimulating others.
Materials and methods
Study site and sample collection
Samples were collected in April 2016 in the shallow coral reef of Whale Island (12°39.1’N, 109°23.9’E), which is located in the Van Phong Bay, 100 km North of Nha Trang city (South-Vietnam; Fig. 1). Corals in this Bay are sub-jected to strong chemical perturbations (organic pollution, massive use of antibiotic, etc.) caused by the local presence of highly concentratedfloating marine farms [45].
Sampling coral mucus, ambient water, and
Drupella
’s gut
Coral mucus
Coral samples were collected between 2 and 4 m depth by scuba diving within an approximate area of 50× 300 m, from three different scleractinian species: Acropora formosa (FOR), Acropora millepora (MIL), and Fungia repanda (FUN). The two Acroporidae were heavily colonized by D. rugosa, whereas the free-living F. repanda did not show any sign of predation by the snail. Ten fragments/nubbins (15–20 cm) of healthy (H) and grazed (G) Acroporids (i.e., harboring at least 5–10 individuals of D. rugosa) were collected in three different location of the Bay. At each site, nubbins were taken out of the water and exposed to air for 3 min. This desiccation stress triggered the mucus secretion, long gel-like threads dripping from the coral surface. The first 20 s of
mucus production were discarded to prevent contamination and dilution by seawater. At each of the triplicate site, the mucus collected from the different nubbins was pooled and homogenized to get afinal volume of approximately 30 ml for both healthy and grazed corals. Two ml were then dis-tributed in cryotubes, immediatelyfixed with formaldehyde (final concentration 3% v/v), and stored at −80 °C until their utilization for estimating viral and bacterial concentrations (see below). The remaining volume was discarded in poly-carbonate tubes and immediately processed for the different other analyses detailed below (i.e., bacterial respiring activ-ity, DNA extraction, viral life strategies, etc.).
Water (WAT)
Triplicate seawater samples were also collected in the water column at approximately 1 m above corals, using 15 ml Falcon tubes, fixed and stored as described for mucus samples, and processed for the all the different analyses described below.
Drupella’s gut (GUT)
At each site, the shell of six individual of D. rugosa were wiped with 70% ethanol and then removed aseptically from
the animals. Snails were washed with sterile physiological solution and were dissected in vivo in sterile Petri dishes, under aerobic conditions. The whole intestinal tract (eso-phagus to rectum) was aseptically handled to avoid con-tamination from external surface of the snail’s body. The six individual snail intestines were then homogenized using sterile mortar and pestle in 5 ml of 0.02μm-filtrated 1X phosphate-buffered saline solution [46, 47]. Samples were then clarified in a microcentrifuge tube at 1500 g for 10 min and used for analyses of viral and bacterial community composition (see below).
Counts of viruses and bacteria
The formaldehyde-fixed mucus samples were processed for viral and bacterial extraction by using the potassium citrate method [48] adapted from Williamson et al. [49]. Briefly, a total of 100μl of fixed mucus was eluted into 900 μl of 0.02-μm-pore-size-filtered solution of 1% citrate potassium (10 g potassium citrate, 1.44 g Na2HPO4· 7H2O, and 0.24 g KH2PO4per liter). All tubes were then vortexed at a mod-erate speed for 5 min before particles were stained and enumerated. The number of viruses and bacteria contained in healthy and grazed corals in each triplicate mucus sam-ples (one replicate at each site) were determined after Fig. 1 Location of the sampling site in the Van Phong Bay (Vietnam)
retention of the particles onto 0.02μm pore-size membranes (Anodisc) and staining with SYBR Gold [50]. On each slide, 1000–2000 bacteria and viruses were counted with an Olympus BX53 epifluorescence microscope in 20 fields at ×100, under blue light excitation (488 nm). For planktonic viruses and bacteria in the surrounding water, as the extraction procedure was not necessary, we only applied the staining protocol as described above, by using a volume of 300–500 μl of seawater at each sampling site (n = 3).
Fraction of lysogenic bacteria
We used the method of Jiang and Paul [51] to initiate prophage induction in mucosal and planktonic bacteria. Mitomycin-C (final concentration: 1 µg ml−1, Sigma Aldrich) was added to triplicate (one replicate at each site) 5 ml of mucus and water. Duplicate untreated samples served as the control. All samples were formalinfixed (final concentration 3% v/v) after being incubated for 10 h, in the dark, at in situ temperature (see Nguyen-Kim et al. [52]). Prophage induction was calculated as the difference in viral abundance (epifluorescence counts, see above) between mitomycin-C treated (Vm) and control incubations (Vc). The fraction of lysogenic bacterial cells (FLC) was calculated as: FLC(%)= 100 × (Vm−Vc)/BSxBAt0, where BS is the burst size (virus per bacteria) and BAto is the prokaryote abundance at the start of the experiment, that is, before adding mitomycin-C [53]. As no burst size from infected mucus-associated bacteria has been published so far, we used burst size of 24, which is an average value calculated from the range of different studied marine environments [54,55].
Viral lytic production
The decay, that is, the decrease in the viral concentration over time, was recorded after inhibition of new viral lytic pro-duction (VP) by the addition of potassium cyanide (KCN; final concentration of 2 mM) in both mucus and water samples [56]. All incubations for decay experiments were performed in triplicate (one replicate per sampling site) at in situ temperature, for 12 h [52]. Incubations were stopped after addition of formaldehyde (3%final concentration). Viral abundance was determined in KCN-treated and -untreated water and coral mucus, by using SYBR Gold and epi-fluorescence microscopy (see above). The difference between the abundance of viruses with and without KCN allows the estimation of VP [57].
Bacterial respiring activity
The proportion of respiring bacteria that have high rates of metabolism was determined using 5-cyano-2,3-ditolyl
tetrazolium chloride (CTC), an indicator of the respiratory electron transport system activity [58]. A stock solution of 50 mmol l−1 CTC (tebu-bio SAS) was prepared daily, fil-tered through 0.02µm filters and kept in the dark at 4 °C until use. CTC stock solution was then added to 0.45 ml of both duplicate fresh mucus and water samples (5 mmol l−1 final CTC concentration) and incubated for 1.5 h at room temperature in the dark. Formaldehyde (3% final con-centration) was used to stop the CTC reaction. Samples were flash frozen in liquid nitrogen and stored at −80 °C freezer untilflow cytometer analysis. The red fluorescence of CTC (FL3) and the light scatter Side-scattered light were used to discriminate the CTC+ cells from other cells or weak fluorescent particles [59]. The percentage of CTC+ cells, based on triplicate analyses (one replicate at each site), was calculated relative to the total bacterial counts obtained by epifluorescence microscopy.
Bacterial DNA extraction, ampli
fication, and
sequencing
Bacterial DNA was extracted from 500µl of the different coral mucus samples (n= 15) and from the entire gut homogenates (n= 3). Bacterial DNA from the surrounding water (n= 3) was obtained by filtration of 500 ml on a 0.2-µm-pore polycarbonate membrane (47 mm diameter, Nuclepore). DNA extractions were achieved using the PowerSoil®DNA Isolation Kit (MoBio Laboratories, Solana Beach, CA, USA) following the manufacturer instructions. DNA was quantified by fluorescence using the Qubit dsDNA BR Assay kit (Invitrogen, Carlsbad, USA) and the Qubit 3.0 Fluorometer. Concentrations averaged 25.4 ngμl−1(±13.8, n = 36). DNA quality was assessed by spectrophotometry (Nanodrop 1000, Wilmington, USA). Values of A260nm/A280nm and A260nm/A230nm averaged 1.73 (±0.28) and 1.74 (±0.35), respectively. All DNAs were diluted to 10 ngµl−1 for subsequent molecular analyses.
The universal bacterial primer set 343F (S-D-Bact-0343-a-S-15, 5′-ACGGRAGGCAGCAG-3′) and 802 R (5′-TACCAGGGTATCTAATCCT-3′) were used to amplify a ~460-bp fragment corresponding to the V3–V4 region of the 16S rRNA gene [60]. The reaction mixture included 1µl of each primer at 10µM, 25 µl of Amplitaq Gold 360 master mix (Thermo Fisher Scientific), 10 ng of DNA template, and sterilized milliQ water to give a 50µl final volume. PCR amplifications were performed in a GeneAmp PCR system 9700 (Applied Biosystems, Foster City, CA, USA) as follows: initial denaturation at 94 °C for 1 min, followed by 30 cycles of 94 °C for 60 s, 65 °C for 60 s, and 72 °C for 60 s, ending with afinal extension at 72 °C for 10 min.
Eighteen of the 21 samples were successfully amplified. The amplicons were mixed in equal amounts of DNA, and
subsequently the 16S rRNA gene was sequenced on an Illumina platform using the 2× 250 bp MiSeq chemistry. We obtained a total of 732,151 (>400 bp) reads from the 18 samples. The complete data set was deposited in the NCBI Sequence Read Archive database under study accession no. SRP116049.
Bacterial sequence processing, taxonomic
af
filiation, and phylogenetic analyses
Raw reads were independently quality based, trimmed, and paired of reads were assembled in contigs using the Mothur software. Contigs were then aligned on the SILVA 123 database [61]. Chimeric sequences were identified using the Uchime tool (de novo chimera detection) [62] followed by their removal from the data set. Sequences matching “Chloroplast” and “Mitochondria” were identified using classify.seqs and subsequently removed from the data set. OTUs were clustered at a 97% identity threshold following the Mothur Illumina Standard Operating Procedure [63]. Sequence clustering resulted in a contingency table of 9752 bacterial OTUs. All statistical analyses were performed on a random subsample of 1440 sequences, corresponding to the smaller number of sequences per sample in the data sets, after trimming and quality processing.
Taxonomic classification of each OTU was performed using the SILVA 123 database. A representative sequence (i.e., the closest sequence of all other sequences) for each OTU was selected and a phylogenetic tree was recon-structed using FastTree 2 [64]. The tree was rooted using a set of six bacterial 16S RNA gene sequences obtained from the SILVA 123 database [61]. A chronogram was then adjusted on the phylogenetic tree using the “chronos” function (discrete model, 20 evolution rates) provided in the R package ape [65]. This function provides a dated ultra-metric tree using a maximum-likelihood algorithm and calibration points.
Samples processing for viral genomic analyses
At one single site, ~20 ml of both healthy and grazed corals (n= 5) were first processed using a MicroKros hollow-fiber tangential flow filtration (TFF) portable device equipped with a CO2-E20U-05-N modified polyethesulfone 0.2 µm membrane (Spectrum Laboratories, Los Angeles, CA). Virus particles of the filtrate were then TFF concentrated using a 100 kDa membrane (CO2-E100-05-N, Spectrum Laboratories). For water samples, 2× 250 ml were filtrated onto 0.2µm filters (Merck Millipore, Molsheim, France). Virus particles of the filtrate were then purified and con-centrated using a MicroKros 100 kDa system (Spectrum Laboratories) as described above.One single Drupella’s gut homogenate was used for viral DNA extraction. After the centrifugation process (see above description to generate gut homogenate), the supernatant was serially filtered through 0.8, 0.45, and 0.22 μm filters (Merck Millipore). The resulting filtrate was purified and concentrated using a MicroKros 100 kDa system (Spectrum Laboratories) as described above.
Viral nucleic acids extraction and sequencing
All viral concentrates (n= 7) were then digested 1 h at 37 °C with 5 U TurboDNAse (Life Technologies, Saint Aubin, France) to eliminate any residual DNA. Viral nucleic acids were extracted in duplicates using the Roche High Pure Viral Nucleic acids extraction kit (Roche Diagnostics, Meylan, France) according to the manufacturer’s protocols, stored at−20 °C and transported frozen to the lab for further processing. Extracted nucleic acids were pooled and con-centrated using Agencourt AMPure beads (Beckman-Coul-ter, Villepinte, France) in a final volume of 20 μl. Nucleic acid concentration was quantified with the Quanti-it Pico-green reagent (Life Technologies). Nucleic acids were ran-domly amplified using a Genomiphi V3 kit (GE Healthcare, Vélizy-Villacoublay, France) in two independent reactions. Amplification products were pooled and purified with Agencourt AMPure Beads (Beckman-Coulter) according to the manufacturer’s protocol, eluted to a final volume of 20 μl and sequenced using MiSeq Technology with the paired-end and barcode strategies according to a Nextera XT library kit in a 2× 300-bp format (Illumina Inc., San Diego, USA).Sequence treatment and analysis
Reads were quality trimmed and filtered using FASTX-Toolkit and perl script, following methodology described in Arumugam et al. [66]. Assembly offiltered reads, mapping, and scaffolding were performed using CLCworkbench7. Reads were aligned against nr database using DIAMOND (blastx, E-value≤ 1E-05) [67] and taxonomical annotations were determined using MEGAN [68]. Read that were tax-onomically assigned at the species level were merged by families. Scaffolds were aligned against nt using MEGA-BLAST (E-value≤ 1E-05) [69]. Viral origin and annotation of the scaffolds were assigned using VirSorter [70], PHA-STER [71] and an in-house procedure used to improve the characterization of short scaffolds. In details, protein Open Reading Frame (ORF) sequences were predicted on scaffolds by MetaGeneMark [72] and aligned against nr database using BLASTP (blastp, E-value≤ 1E-05). An ORF is considered from viral origin following the Best Blast Hit (BBH) anno-tation or, in the case of bacteriophage, if there is a hit in the top 25 list with a phage protein or a bacterial protein with one
of the following phage-related functions: tail, coat, head/ capsid, terminase, portal protein. Genotypes are considered viral when>25% of the annotated ORFs are of viral origin, the closest viral homolog in a protein database that gathers all sequenced viral genomes being used for annotation.
CRESS-DNA virus survey in other coral viromes
Montastraea cavernosa tissue viromes from Soffer et al. [73] were downloaded from the Metavir server (http://meta vir-meb.univ-bpclermont.fr). Reads of each data set (Healthy (n= 2), Diseased (n = 6), Diseased and Bleached (n= 7), and Bleached (n = 4) corals) were annotated as described above. Viral reads were then aligned using blastx (E-value<=1E-05) against a database gathering all viral protein available in NCBI and proteins from the four circular REP encoding single-stranded DNA (CRESS-DNA) genotypes described in this study. Reads displaying a BBH against CRESS-DNA genotypes were considered as closest homologs and relative coverage were calculated.Similarity network analysis
In the aim to detect homologous genotypes inside and between metaviromes regardless of any annotation status, a similarity network was constructed with scaffolds longer than 500 bp and their best first hit in NT using EGN with the following parameters: megablast, E-value≤ 1E-05, minimal identity of the smallest sequence≥ 95% [74], following the similarity threshold used by International Committee on Taxonomy of Viruses to classify bacteriophage genera. In this network, nodes (scaffold or reference genomes) are linked when they share a similarity>95% of the smallest sequence into connected components (CC). CC generally gather broadly overlapping sequences, which are then considered originating from the same viral genotype. An identity threshold of 95% gathers in a same cluster, genomic frag-ments of bacteriophages from the same species. For eukar-yotic viruses, the clustering level depends on their viral families. Unlinked scaffolds are called singletons, and repre-sent unique sequence in all metagenomes without homolog in nt database. Network was visualized in Cytoscape 3.2.1 [75]. Reads of each virome were mapped against all scaffolds using MEGABLAST and hits with E-value≤ 1E-05 and identity ≥ 90% of the read length were used to calculate read abundance corresponding to a CC/Singleton [69]. Because metagenome assembly algorithms may fail to assemble sequences from rare genomes in a sample, reads were also mapped against genotype represented by singletons. Classification and anno-tation of network nodes (scaffolds) and singletons of interest were performed as described above in the“sequence treatment and analysis” section.
Statistical analyses
All statistical analyses were run with Rstudio software (R version 3.2.5) [76]. Viral, bacterial abundances, percentage of CTC+ cells, fraction of lysogenic bacterial, and viral lytic production were tested for differences between healthy and grazed mucus samples by using the non-parametric Kruskal–Wallis one-way analysis of variance test (alpha level= 0.05). Statistical significance was assumed when p < 0.05.
Bacterial genomic data
The OTU contingency table, taxonomy file, and phyloge-netic tree were merged into a single R object using “phy-loseq” package [77]. Bacterial community similarity was represented by a heatmap and a dendrogram using Bray–Curtis dissimilarities calculated on the OTU con-tingency table and the Ward hierarchical clustering method. To test whether community composition was different between healthy and grazed corals, we used Permutational analysis of variance (PERMANOVA) based on 1000 per-mutations [78]. In order to evaluate if the ‘grazed’ com-munities are more dissimilar to each other compared with the‘ungrazed’ communities, pairwise beta diversities within grazed and healthy corals were calculated using the betapart package [79] and significant differences in beta diversity were then tested using a Mann–Whitney test. Statistical differences in OTU abundance between healthy and grazed corals were calculated with Wilcoxon rank sum tests and corrected for multiple hypotheses with a Bonferroni correction.
Alpha diversity was described by two complementary indices, describing taxonomic compositional diversity (i.e., taxonomic richness based on presence/absence of OTUs), and taxonomic structural diversity (i.e., taking account of relative abundances of OTUs). Taxonomic compositional diversity (TCD) was assessed as the number of different OTUs in each simple, whereas taxonomic structural diver-sity (TSD) was assessed using Shannon alpha diverdiver-sity [80]. Taking into account the phylogenetic facet of diversity for alpha, diversity did not change significantly the results. Hence, only results obtained for the taxonomical facet of diversity (TCD) are presented in this study.
Viral genomic data
Genotypes present in at least two viromes with a mini-mum of 20 reads in one virome were used to construct a matrix of abundances. Relative coverage matrix and diversity calculation were obtained and normalized using vegan library [81]. Hierarchical clustering and heatmap were performed using heatmap.2 function of gplots
package [82]. Genotypes specifically/statistically asso-ciated with grazed coral mucus and Drupella’s gut, or healthy corals and seawater, were characterized using multipatt function of indicspecies package (999 permu-tations, p≤ 0.05) [83].
Results
Occurrence of D. rugosa
Among the large diversity of scleractinian species found in this area [84], only two of them belonging to the branching coral family of Acroporidae (i.e., Acropora formosa and Acropora millepora) were found to be colonized by D. rugosa (Fig. 2). Direct evidences of colonization were observed in 5–10% percent of the total coral cover. The marine snail was found in partially bleached corals, forming patches of 2–30 individuals, and agglomerated at the interface of live and dead parts of the corallites (see Fig.2).
Viral and bacterial abundances
Both parameters exhibited the exact same trend character-ized by significantly higher concentrations of viral and bacterial epibionts in D. rugosa-colonized corals compared with their healthy counterparts, whatever the species
considered (Kruskal–Wallis, p < 0.05; Figs. 3a, b). Quan-titatively, viral abundance in mucus was, on average 1.4-and 5.9-fold higher in grazed than healthy corals, for A. millepora and A. formosa, respectively (Kruskal–Wallis, p< 0.01). The same was for bacteria, which were 1.8 and 3.0 times more abundant in corals harboring D. rugosa (Kruskal–Wallis, p < 0.05). On average, the three healthy corals species (i.e., A. millepora, A. formosa, and F. repanda) also exhibited significantly higher viral and bac-terial concentrations that those measured in the surrounding water body (Kruskal–Wallis, p < 0.05; Figs.3a, b).
Bacterial respiring activity
Together with viral and bacterial abundances, the propor-tion of active respiring CTC+ cells was also much higher in grazed than healthy corals, for both species (Kruskal–Wallis, p < 0.05; Fig. 3c). For A. millepora, the percentage of active cells reached 6.5% and 15.0% in healthy and predated corals, respectively. Even larger dif-ferences were observed with A. formosa where CTC+ cells represented 2.1% and 21.3% of the total bacterial counts in healthy and grazed individuals, respectively (Kruskal–Wallis, p < 0.05). The average proportion of active cells (from the three species) was significantly higher in mucus than water samples (Kruskal–Wallis, p < 0.05; Fig. 3c).
Fig. 2 The scleractinian corals Acropora formosa a, b and Acropora millepora c, d colonized by the marine gastropod Drupella rugosa in the Van Phong Bay, Vietnam
Viral life strategies: lytic versus lysogenic infection
The presence of D. rugosa strongly impacted viral life strategies, as shown by the two opposite patterns for viral lytic and lysogenic infection rates (Figs. 3d, e). For both Acroporids (A. formosa and A. millepora), viral lytic production was significantly enhanced in grazed compared with healthy corals (4.4- and 8.4-fold for A. millepora and A. formosa, respectively). On the contrary, the FLCs, which was, respectively, 10.2%, 11.6% and 20.8% in healthy A. formosa, A. millepora and F. repanda, became almost undetectable (i.e.,<0.3%) in the two grazed Acroporidae (Kruskal–Wallis, p < 0.05). FLC measured in the sur-rounding water was consistently and significantly lower than that of all healthy mucus samples (Kruskal–Wallis, p< 0.05; Figs.3d, e).Patterns of bacterial community composition and
diversity in healthy and grazed corals
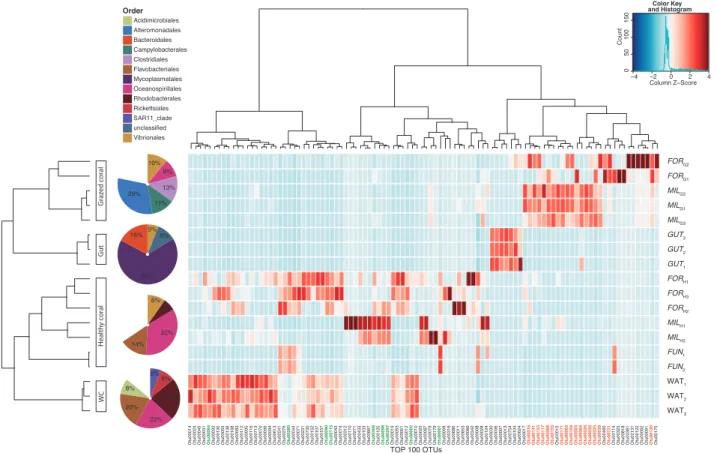
Based on the result of the hierarchical classification illu-strated in the heatmap, the samples could be significantly separated into four distinct groups explaining 44% of the variance in the OTU contingency table (p< 0.05, PERMANOVA; Fig. 4). No significant differences were found between healthy and grazed coral-associated bacterial communities for β-diversity metrics (p > 0.05, Mann–Whitney test), thus indicating no differences in the dispersion of bacterial communities within each condition. Bacterial communities from the mucus of healthy corals clustered together and were more similar to communities originating from the water column. They were dominated by bacteria belonging to the Oceanospirillales (entirely Fig. 3 Comparison of different microbiological traits between grazed,
healthy (ungrazed) corals, and surrounding water in the Bay of Van Phong (Vietnam), * significant differences, Kruskal–Wallis, p < 0.05.
Viral abundance a, bacterial abundance b, proportion of active CTC+ cells c, viral lytic production d and proportion of lysogenic bacteria e
represented by the Endozoicomonas genus) and Flavo-bacteriales orders, which represented almost half of the sequences in these samples (Fig.4). The Endozoicomonas genus was particularly dominant within the mucus of Fungia (FUNH) compared with Acropora formosa (FORH) and Acropora millepora (MILH), accounting for 91%, 12% and 15% of the total bacterial community, respectively. The two healthy Acroporids corals shared only 201 OTUs (2% of the community) with those found in the mucus of their grazed counterparts, which were more similar to Drupella’s gut communities (GUT). Bacterial communities in the two grazed Acropora corals (FORGand MILG) were nonetheless quite distant from the GUT communities (only 18 common OTUs) and were dominated by bacteria from the Vibrio-nales, Clostridiales, Campylobacterales, and Alteromona-dales orders.
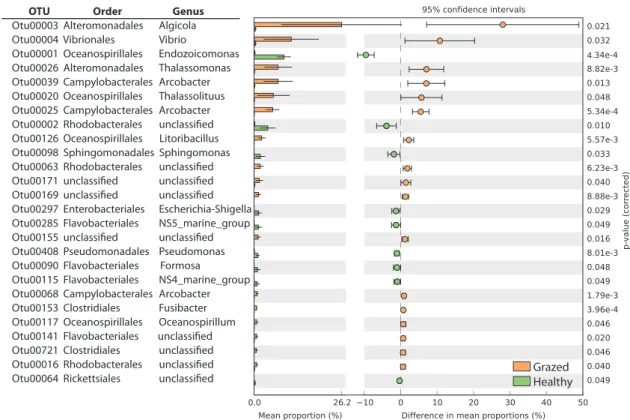
Investigating the OTUs responsible for such differences, we found that 26 OTUs (among the 100 most abundant OTUs) were not common to both healthy and grazed corals (Fig.5). Six of the seven most relevant OTUs were enriched
in grazed corals and belonged to the Campylobacterales, Alteromonadales, Vibrionales, and Oceanospirillales orders. The over-representation of such coral pathogen taxa in grazed corals and the decline of typical healthy coral OTUs (e.g., belonging to the genus Endozoicomonas and the orders Rhodobacterales, Flavobacteriales, and Pseu-domonales, see Fig.5) was accompanied by a decrease in the Shannon diversity index and in richness, albeit only statistically significant for Shannon diversity (Supplemen-tary Figure 1).
Sequencing data and annotated viral sequences
Sequencing yields varied between 1,020,366 (FORG) and 2,985,764 (MILH) paired reads by sample (mean= 2,223,053 and standard deviation= 774,630), the lowest read yields being retrieved for mucus samples of grazed corals (Supplementary Figure 2). From the paired reads that successfully passed through quality control, unannotated reads (unknown) represented from 64.8% (MILG) to 91.2%Fig. 4 Heatmap of bacterial 16S rRNA gene OTU 97% obtained from the mucus of healthy (H) (Acropora millepora, MIL; Acropora
for-mosa, FOR; and Fungia sp., FUN) and grazed (G) corals (Acropora
millepora and Acropora formosa), from Drupella’s gut (GUT) and from the surrounding water column (WAT). Independent biological replicates of each type of samples are labeled sequentially. Dendro-gram distances are based upon OTU relative abundances within the data matrix. Only the 100 most abundant OTUs are shown in the
figure. The left and top dendrogram are based on Bray–Curtis dis-tances and Ward hierarchical clustering method. Colors correspond to normalized relative abundances of a bacterial OTU (column) in a sample (row), from blue (low abundances) to red (high). Pie charts represent the community composition at the order level averaged for all the healthy and grazed corals, GUT and WAT. Differentially abundant OTUs detected in healthy or grazed Acropora corals are indicated in green and orange, respectively
(GUT) of the data sets. Most of the sequences with known homologs in nr database, most (85.4± 8.9%) were anno-tated as viral (Supplementary Figure 2). Among annoanno-tated reads, the majority (>40%) belongs to uncultured Medi-terranean phage uvMed, independently of the sample or the condition (Fig.6a). Remaining reads were distributed into phage families (Myo-, Podo-, Sipho-, and Microviridae), unclassified double-stranded (ds)DNA phages and uncul-tured (marine) viruses. Only few read related to eukaryotic dsDNA, single-stranded (ss)DNA, and RNA virus families were detected and these families accounted each for less than 1% of the virome (Supplementary Table 1). uvMED phage abundances were lowest in grazed corals and gut samples, to the benefit of other families such as Podoviridae and Microviridae in FORG, Siphoviridae in FORGand GUT or unclassified dsDNA phages in MILG and GUT. An attempt of reads annotation at deeper taxonomical level (Fig. 6b) showed that, in addition of uncultured marine viruses, Synechococcus (Myoviridae) and Puniceispirillum (Podoviridae) phage taxa were common and abundant in all samples. No phage taxa were identified as specific of healthy corals. In contrast, Salicola phage CGphi29 (unclassified dsDNA phage) was enriched in MILG and GUT. FORG sample showed enrichment in EPBR
podovirus 3, Vibriophages VP16T and VP16C (Myovir-idae), Thalassomonas phage BA3 (Podoviridae) and Pseudomonas phage PaMx25 (Siphoviridae). This last was also highly covered in GUT, along with two other Vibrio phages (Podoviridae VpKK5 and unclassified dsDNA phage VBM1).
Scaffolding and similarity network analysis
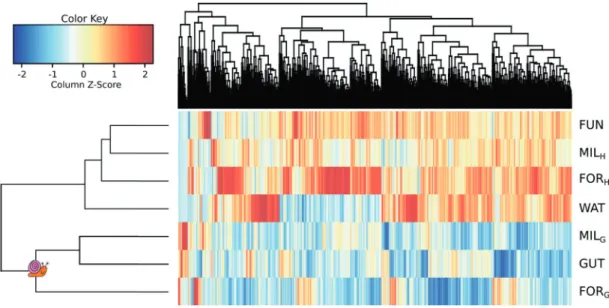
Assembly and scaffolding of each data set resulted in the construction of 1,930,495 scaffolds (137,961± 55,563 by sample) reflecting the high diversity of genomic content. These scaffolds gathered between 66.8% (FORH) to 91.1% (FORG) of the reads (average of 79.4± 9.2%). Only 3.7% (MILH) to 10.3% (MILG) of the scaffolds had homologs in nt. A total of 170,972 scaffolds longer than 500 bp and their first hit in nt were used to construct a sequence similarity network. This network contained 9655 CCs, gathering 38,646 nodes. Only 53 reference genomes were part of the network, distributed in 40 CCs. The relative coverage of CCs, as well as of singletons were represented as a heatmap in Fig.7, where each row corresponds to a sample and each column to a genotype. Hierarchical clustering of the cov-erage matrix clustered viromes from healthy corals near to
OTU Order Genus
Otu00003 Alteromonadales Algicola
Otu00004 Vibrionales Vibrio
Otu00001 Oceanospirillales Endozoicomonas
Otu00026 Alteromonadales Thalassomonas
Otu00039 Campylobacterales Arcobacter
Otu00020 Oceanospirillales Thalassolituus
Otu00025 Campylobacterales Arcobacter Otu00126 Oceanospirillales Litoribacillus Otu00098 Sphingomonadales Sphingomonas
Otu00297 Enterobacteriales Escherichia-Shigella Otu00285 Flavobacteriales NS5_marine_group Otu00408 Pseudomonadales Pseudomonas Otu00090 Flavobacteriales Formosa Otu00115 Flavobacteriales NS4_marine_group Otu00068 Campylobacterales Arcobacter Otu00153 Clostridiales Fusibacter Otu00117 Oceanospirillales Oceanospirillum
Grazed Healthy
Fig. 5 Bacterial OTUs showing significant differences in abundance between healthy (in green) and grazed (in orange) corals. The bar plots on the left side display the mean proportion of OTU belonging to each order. The dot plots display the difference in mean proportions between the healthy and grazed corals with the associated p-value of
the t-test statistic (Bonferroni corrected). Error bars on both the bar and dot plots represent the 95% confidence intervals. Taxonomy was assigned to OTU representatives using Mothur with the Silva 123 database
the seawater virome. In contrast, virome from grazed corals clustered with viromes from Drupella’s gut (GUT). Vir-omes from grazed corals and GUT were characterized by lower coverage of viral genotypes and fewer common taxa. This was also correlated with a lower diversity compared with that in healthy corals and seawater (mean comparison test, p< 0.05).
Healthy vs grazed corals and Drupella
’s gut viromes
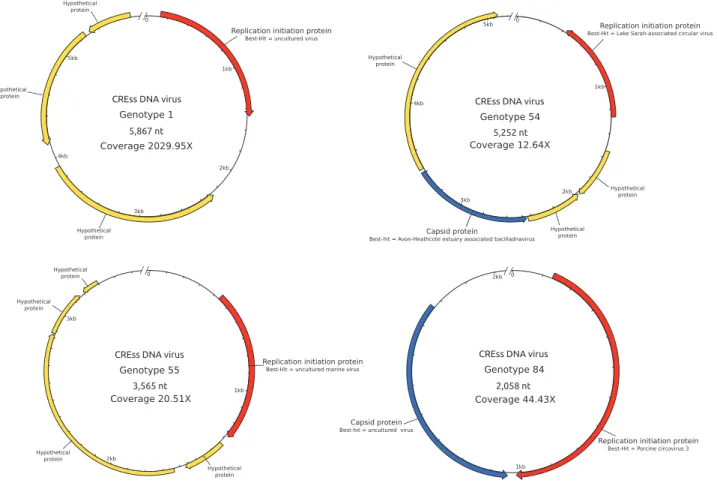
Indicator species analysis confirmed that a large proportion of genotypes (6302) were specifically associated with healthy corals and seawater (Fig.7) and only 244 genotypes were specific to grazed corals (SGC) (Supplementary Table 2) including 119 also found in GUT. Only 11 and 14 Fig. 6 a Relative coverage of major viral families in annotated reads by sample (≥1% in one sample). b Relative abundance of major viral genera —or the deepest taxonomic level available—by samplegenotypes could be classified as viral using PHASTER and VirSorter, respectively (data not shown). Using less strin-gent parameters, annotation was reached for 167 genotypes (Supplementary Table 2). The most covered SGC genotype (genotype 1) possessed a protein homologous with the replication initiation protein (REP) specific to the poorly characterized CRESS-DNA viruses (Fig.8), and has been annotated accordingly. This CRESS-DNA virus represented >2.8% of the total grazed corals-associated viromes and >20% of the viral SGC reads, but was not retrieved in the Drupella’s gut (Supplementary Table 2). Three other CRESS-DNA viruses (genotypes 54, 55, and 84) were also characterized only in grazed corals using the same criteria. These partial genomes were assembled with high coverages (from 12.64X to 2029.95X). Genotypes 1 and 55 have all ORFs except the REP proteins without homologs in public databases, and the REP-encoding proteins have uncultured viruses for Best-Hits (with 24.1% and 33.3% identity, respectively), hampering their classification into a known group of CRESS-DNA viruses. Genotype 84 harbored a genomic structure similar to that of Circoviruses, with two genes coding for REP (39.7% identity) and capsid (40.9% identity) proteins, on both strands, and a genome size of ~2 kb. The BBH of the REP sequence (Porcine circovirus 3) supported this hypothesis. The last one, genotype 54, pos-sessed a capsid-encoding gene closed to Bacilladnaviruses (30.2% identity), known to infect unicellular algae (Fig.8). However, differences in the REP protein annotation (uncharacterized Lake Sarah-associated circular virus, 43.6% identity), the ORFs number (five against three for known Bacilladnaviruses) and their orientation, suggested
this genotype was not a member of the Bacilladnavirus clade. Given the identity threshold of 95% used to construct the similarity network, these CRESS-DNA viruses likely represent novel genera.
The presence and the relative coverage of these four CRESS-DNA genotypes were also surveyed in viromes from healthy coral mucus, coral tissue with white plague disease, bleached or not, and bleached corals [73]. These genotypes were completely absent from the healthy coral mucus viromes (Supplementary Table 3). Only one sample from bleached and one from disease and bleached coral mucus possessed 0.02% and 0.01% of viral reads closely related to the genotype 84, respectively. In contrast, the genotype 84 was detected in all viromes of diseased coral mucus, with relative coverage ranging from 0.01 and 1.10% (0.27+ −0.004%). The three other CRESS-DNA viruses (genotypes 1, 54, and 55) were not detected in the viromes of [73].
Most of the SGC genotypes (163) were classified as bacteriophages, as at least 25 % of their successfully annotated ORFs were homologous to phage proteins, with 146 of them harboring>50 % of bacteriophage homologous proteins. Among the 16 most abundant genotypes (>1%) gathering 80.9% of viral SGC reads, 14 were closed to bacteriophages with known hosts, including phages infecting Flavobacteriales, Vibrionales, Pasteurellales, Burkholderiales, Bacillales, Rhizobiales, Alteromonadales, Thermoanaerobacterales, Enterobacterales, Synecho-coccales, Rhodobacterales, and Lactobacillales. Finally, 77 genotypes failed to get any annotation (uncharacterized), 1 of them belonging to the 16first more covered genotypes. Fig. 7 Heatmap of viral genotypes relative coverage by sample, with the hierarchical clustering resulting in the grouping of all healthy corals (FUN, FORH, MILH), with the water sample (WAT), and both grazed corals (FORGand MILG) with GUT (clade indicated by the snail icon)
Discussion
The only two coral species affected by D. rugosa in our study site belonged to the Acroporidae, which confirms that members of this family are among the preferred prey of corallivorous organisms in this region, including the crown-of-thorns starfish Acanthaster planci [85,86] and Drupella snails [87]. Acroporids typically allocate most of their energy for growth and propagation rather than for defense and preservation, which could explain their weaker resis-tance to diseases and predation [88,89].
In the Van Phong Bay, the most obvious manifestation of Drupella grazing pressure was the development of paled or partially whitened areas on coral branches (Fig. 2). These signs of morbidity are of uncertain origin as they could be either caused by the direct removal of coral tissues and polyps, and/or the collateral development of microbial diseases with bleaching-like symptoms and white appearance, including the skeletal eroding band disease, the white plague, the white band disease, etc. To clarify the presence of such symptoms, we conducted a micro-biological and genomic examination of the mucus of grazed corals to understand the role of epibiotic bacteria and viruses and how they can respond/adapt to predation
pressure and potentially play a mediating role in coral immune response.
Drupella-mediated dysbiosis in colonized corals
All the different microbiological parameters examined in this study showed spectacular and significant shifts in both corals species, which were colonized by Drupella (e.g., A. formosa and A. millepora). For example, the mucus of grazed taxa harbored much more abundant and active bac-teria than the preserved ones (Fig. 3). Several hypotheses can be advanced to explain this: (i) the additional supply of active cells carried by the gastropods (via their feces, shell, etc.) and deposited onto the coral superficial layer, but such direct cell relocation is unlikely to explain this level of bacterial enrichment in mucus; (ii) the grazing activity of Drupella could stimulate the growth of specific bacterial symbionts, or more radically induce a replacement of the commensals by highly active opportunistic cells (rather dedicated to growth) from the water column and/or Dru-pella’s microbiome; (iii) the excess or alternative production of mucus compounds or metabolites by the host upon wounding [43], and/or (iv) the liberation of free nutrients into the local niche area via snail grazing.The side to side comparison of bacterial OTUs between healthy and grazed corals revealed large differences in their respective community composition (Fig. 4). The two ungrazed Acroporids corals harbored a bacterial community dominated by bacterial lineages (e.g., belonging to the genus Endozoicomonas), which are typically found in the mucus of healthy scleractinians [90–93] and to a lower extent to the orders Rhodobacterales, Flavobacteriales, and Pseudomonadales [94,95]. Although the functional role of these lineages is not completely understood, they all seem to be part of the BMC group (beneficial microorganisms for corals, see Peixoto et al. [96]) promoting coral health by various mechanisms including the cycling of nutrients and the biological control of pathogens [97]. For example, some bacteria of the genus Endozoicomonas have been recog-nized for their antimicrobial activity [98,99], and may also contribute to the sulfur cycle [100]. Hence, the decline of these presumably beneficial lineages in corals infested by the marine snail may explain the prevalence of opportunistic and pathogenic bacteria belonging to the Vibrionales, Clostridiales, Campylobacterales, and Alteromonadales orders (Fig.5). Interestingly, such pathogen-like taxa have been also detected in other predated corals [42,43] or corals affected by the white band disease [73, 101–103]. The relatively low number of common OTUs shared by the mucus of grazed corals, and the snail’s gut and the water suggests that a direct bacterial contamination by the gas-tropod feces and/or the surrounding plankton is possible but probably limited.
Overall, one can suspect that Drupella corallivory, through the formation of feeding scars and the alteration of the superficial mucus layer may be responsible for the disruption of coral’s microbiological balance by compromising the antimicrobial activity of the bacterial epibionts [98], and thus facilitating the prolifera-tion of pathogens causing diseases [104]. This scenario has been already evoked after the observation of microbial diseases in corals grazed by marine snails [13, 42] or other corallivorous organisms, including fishes [105–108] or the crown-of-thorns starfish A. plancii [109, 110]. However, none of these studies carried out a simultaneous 16 ribosomal DNA barcoding examination of bacterial community composition to confirm the grazing-induced dysbiosis.
Impact of corallivory on viral associates
Together with an active and abundant bacterial consortium, both predated corals species also harbored a much higher density of viruses in their mucus layer. Intuitively, such levels of viral concentrations could be justified by a massive predation-mediated prophage induction of lysogenic bac-teria, which are typically important in coral mucus [27,34,
35,52]. Although the potential inducing effect of predation on coral associates has never been evaluated, one could suspect that the resulting alteration of mucus, acting like other environmental shifts (temperature, ultraviolet, etc.) may also trigger the bacterial SOS stress response in lyso-genized cells, resulting in a massive release of viruses [111]. This hypothesis is supported by the spectacular drop in the frequency of lysogenic cells in colonized corals compared with their healthy counterparts, which may be simply inferred from their activation, rendering them no longer detectable. The concomitant augmentation of lytic produc-tion rates in grazed corals also illustrates the suspected switch from lysogenic to lytic pathways, following induc-tion events (Fig. 3).
The examination of the viral communities in healthy, grazed corals, and Drupella’s gut showed that a large majority of reads lacks confident annotation. Based on the annotated sequences, only few differences could be observed at the family or phage taxa levels, most of these concerning grazed A. formosa. Indeed, both grazed corals and Drupella’s gut were depleted in sequences matching uncultured uvMed phage, whereas A. formosa was enriched with Podo-, Sipho-, and Microviridae families (Fig. 6a), including sequences belonging to phage taxa infecting Vibrio and Thalassomonas species, the coral pathogens, which are also significantly enriched in the bacterial fraction of the grazed corals (Fig.6b). Each of all other viral families detected represented <1% of the viromes (Supplementary Table 1). The few number of sequences related to families of dsDNA large eukaryotic viruses such as Phycodnavir-idae, MimivirPhycodnavir-idae, or Herpesviridae could either reflect real depletion of members of these families or be explained by our experimental procedure that excluded viral particles with a diameter above 0.2 um.
The reads annotation strategy did not allow obtaining a comprehensive overview of viral diversity. In addition to the low proportion of annotated reads, most belonged to uvMED phages [112], uncultured marine viruses [113], or Puniceispirillum phage HMO-2011 [114] groups that gather numerous diverse bacteriophages potentially infecting var-ious hosts. We thus further used a viral genotypes network approach that clusters together sequences from similar genotypes independently of the annotation [115]. Similarly to the bacterial community study, the abundances analysis of these genotypes showed that grazed corals and Dru-pella’s gut formed a statistically separated cluster compared with healthy corals and seawater and that grazing was accompanied by a decrease of viral genotype richness and diversity (Fig. 7). Viral genotypes that infect Vibrionales and Alteromonadales could be characterized among the most abundant bacteriophages by this approach confirming the enrichment of these bacterial orders in grazed corals (Fig.6b). Other major genotypes infecting Flavobacterales,
Pasteurellales, or Burkholderiales were characterized in grazed corals, whereas corresponding bacterial orders were not retrieved by 16S amplicon strategy. These differences observed between viral and bacterial community structures could be explained by phage persistence after their host population decay, this hypothesis further supporting the role that the viruses may play in the coral pathogen defence [33]. However, this genotype classification by host should be considered with caution as the annotation protocol used in this study is only based on BBH results against nr, in contrast with other tools like PHASTER or VirSorter, which use more refined metrics.
Four novel genotypes belonging to circular Rep-encoding ssDNA viruses (CRESS-DNA) viruses were identified in the mucus of grazed corals (Fig. 8). One of these four was by far the most highly covered genotype in grazed corals although the use of multiple displacement amplification may have introduced bias toward ssDNA viral genomes. CRESS-DNA viruses have been recently descri-bed by metagenomics [116] in a broad range of aquatic ecosystems [117] and animals [118, 119], including gas-tropods [120]. It has also been reported that Montastraea cavernosa showing signs of white plague-like disease contained abundant and unique CRESS-DNA viruses, whereas bleached M. cavernosa did not [73]. Close relatives of the CRESS-DNA virus genotype 84 were detected in the tissue viromes of all disease M. cavernosa whereas totally absent from healthy corals (Supplementary Table 3), further confirming the tropism of these viruses for disease corals. The presence of CRESS-DNA viruses in grazed corals could then either reflect recent and active infections, mediated or not by Drupella, or reactivation of latent infections of coral or algal symbiont cells due to impaired immunity of the host.
Finally, this study demonstrates that the presence of Drupella snails can reduce the overallfitness of their coral preys, not only through their direct detrimental effects on their polyps and dinoflagellate symbionts, but also more insidiously by destructuring their bacteriome and virome. The effective replacement of the bacterial and viral associates in favour of pathogenic taxa also confirms that grazing represents a powerful promoting agent of opportu-nistic infections for corals. Further investigations with other corallivorous organisms will help elucidate whether the nature and intensity of the dysbiosis is rather dependent on the predator type or on the coral species and its specific microbiome.
The detection of novel CRESS-DNA viruses in grazed scleractinians also raises a number of questions about the occurrence and role of this newly discovered viral group in reef ecosystems, which could represent a useful diagnostic tool of the coral health status in the future.
Acknowledgements We thank the TOTAL Foundation (Project PATRICIA) and the Hoa Sen Lotus Program (Project DALIDA) for theirfinancial support. We are grateful to Yen Hoang Thi, Thu Pham The, Sheila Santander, Sharon Nunal, Cristy Acabado, and Hanh Nguyen-Kim for their scientific support and assistance during sam-pling. We also sincerely thank Alexandre Portier, the manager of the Whale Island Resort who was of great logistical help during our stay.
Compliance with ethical standards
Conflict of interest The authors declare that they have no conflict of interest.
References
1. Hoegh-Guldberg O. The future of coral reefs. Science. 2011;334:1494–6.
2. Pandolfi JM, Connolly SR, Marschall DJ, Cohen AL. Projecting coral reef futures under global warming and ocean acidification. Science. 2011;333:418–22.
3. Hughes TP, Baird AH, Bellwood DR, Card M, Connolly SR, Folke C, Grosberg R, Hoegh-Guldberg O, Jackson J, Kleypas J. Climate change, human impacts, and the resilience of coral reefs. Science. 2003;301:929–33.
4. Maynard J, Van Hooindonk, Eakin CM, Puotinen M, Garren M, Willimans G, et al. Projections of climate conditions that increase coral disease susceptibility and pathogen abundance and viru-lence. Nature Clim Change. 2015;5:688–94.
5. De’ath G, Fabricius KE, Sweatman H, Puotinen M. The 27–year decline of coral cover on the Great Barrier Reef and its causes. PNAS. 2012;109:17995–9.
6. Aeby GS, Santavy DL. Factors affecting susceptibility of the coral Montastraea faveolata to black-band disease. Mar Ecol Prog Ser. 2006;318:103–10.
7. Sussman M, Loya Y, Fine M, Rosenberg E. The marine fire-worm Hermodice carunculata is a winter reservoir and spring-summer vector for the coral-bleaching pathogen Vibrio shiloi. Environ Microbiol. 2003;5:250–5.
8. Williams DE, Miller MW. Coral disease outbreak: pattern, pre-valence and transmission in Acropora cervicornis. Mar Ecol Prog Ser. 2005;301:119–28.
9. Cole AJ, Pratchett MS, Jones GP. Diversity and functional importance of coral-feedingfishes on tropical coral reefs. Fish Fish. 2008;9:286–307.
10. Dalton SJ, Godwin S. Progressive coral tissue mortality fol-lowing predation by a corallivorous nudibranch (Phestilla sp.). Coral Reefs. 2006;25:529.
11. Cumming RL. Populations outbreaks and large aggregations of Drupella on the Great Barrier Reef. Great Barrier Reef Mar Park Authority Res Publ. 2009;96:1–26.
12. Hoeksema BW, Scott C, True JD. Dietary shift in corallivorous Drupella snails following a major bleaching event at Koh Tao, Gulf of Thailand. Coral Reefs. 2013;32:423–8.
13. Nicolet KJ, Hoogenboom MO, Gardiner NM, Pratchett MS, Willis BL. The corallivorous invertebrate Drupella aids in transmission of brown band disease on the Great Barrier Reef. Coral Reefs. 2013;32:585–95.
14. Turner SJ. Spatial variability in the abundance of the cor-allivorous gastropod Drupella cornus. Coral Reefs. 1994;13:41–48.
15. Turner SJ. The early life history of Drupella cornus. In: Turner S, (ed). Drupella cornus a synopsis. 3. Western Australia: Department of Conservation and Land Management; 1992. p. 63–69. Occas Pap
16. Claremont M, Reid DG, Williams ST. Evolution of corallivory in the gastropod genus Drupella. Coral Reefs. 2011;30:977–90. 17. Cumming RL, McCorry D. Corallivorous gastropods in Hong
Kong. Coral reefs. 1998;17:178.
18. Schoepf V, Herler J, Zuschin M. Microhabitat use and prey selection of the coral-feeding snail Drupella cornus in the Northern Red Sea. Hydrobiologia. 2010;641:45–57.
19. Shafir S, Gur O, Rinkevich B. A Drupella cornus outbreak in the northern Gulf of Eilat and changes in coral prey. Coral Reefs. 2008;27:379.
20. Al-Horani FA, Hamdi M, Al-Rousan SA. Prey selection and feeding rates of Drupella cornus (Gastropoda: Muricidae) on corals from the Jordanian coast of the Gulf of Aqaba, Red Sea. Jordan J Biol Sci. 2011;4:191–8.
21. McClanahan TR. Coral-eating snail Drupella cornus population increases in Kenyan coral reef lagoons. Mar Ecol Prog Ser. 1994;115:131–137.
22. Fujioka Y, Yamazato K. Host selection of some Okinawan coral associated gastropods belonging to the genera Drupella, Cor-alliophila and Quoyula. Galaxea. 1983;2:59–73.
23. Onton K, Page CA, Wilson SK, Neale S, Armstrong S. Dis-tribution and drivers of coral disease at Ningaloo reef, Indian Ocean. Mar Ecol Prog Ser. 2011;433:75–84.
24. Rosenberg E, Kushmaro A, Kramarsky-Winter E, Banin E, Yossi L. The role of microorganisms in coral bleaching. ISME J. 2009;3:139–46.
25. van Oppen MJH, Leong JA, Gates RD. Coral-virus interactions: A double-edged sword? Symbiosis. 2009;47:1–8.
26. Bourne DG, Morrow KM, Webster NS. Insights into the coral microbiome: underpinning the health and resilience of reef ecosystems. Annual Rev Microbiol. 2016;70:317–40.
27. Vega Thurber RL, Payet JP, Thurber AR, Correa AMS. Virus-host interactions and their roles in coral reef health and disease. Nature Rev Microbiol. 2017;15:205–16.
28. Shnit-Orland M, Sivan A, Kushmaro A. Antibacterial Activity of Pseudoalteromonas in the Coral Holobiont. Microb Ecol. 2012;64:851–9.
29. Kvennefors ECE, Sampayo E, Kerr C, Vieira G, Roff G, Barnes AC. Regulation of bacterial communities through antimicrobial activity by the coral holobiont. Microb Ecol. 2012;63:605–18. 30. Raina J-B, Tapiolas D, Motti CA, Foret S, Seemann T, Tebben J,
et al. Isolation of an antimicrobial compound produced by bac-teria associated with reef-building corals. PeerJ. 2016;4:e2275
https://doi.org/10.7717/peerj.2275
31. Rypien KL, Ward JR, Azam F. Antagonistic interactions among coral-associated Bacteria. Environ Microbiol. 2010;12:28–39. 32. Kushmaro A, Kramarsky-Winter E. Bacteria as a source of coral
nutrition. In: Rosenberg E, Loya Y, (eds). Coral health and disease. Berlin/Heidelberg: Springer; 2004.
33. Barr JJ, Auro R, Furlan M, Whiteson KL, Erb ML, Pogliano J, et al. Bacteriophage adhering to mucus provide a non-host-derived immunity. PNAS. 2013;110:10771–6.
34. Bettarel Y, Bouvier T, Nguyen-Kim H, Pham TT. The versatile nature of coral-associated viruses. Environ Microbiol. 2015;17:3433–9.
35. Knowles B, Silveira CB, Bailey BA, Barott K, Cantu VA, Cobián-Güemes AG, et al. Lytic to temperate switching of viral communities. Nature. 2016;531:466–70.
36. Zaneveld JR, Burkepile DE, Shantz AA, Pritchard CE, McMinds R, Payet JP, et al. Overfishing, nutrient pollution, and thermal stress interact to disrupt coral reefs down to microbial scales. Nature Com. 2016;7:11833.
37. Soffer N, Zaneveld J, Vega Thurber RL. Phage-bacteria network analysis and its implication for the understanding of coral dis-ease. Environ Microbiol. 2015;17:1203–18.
38. Vega-Thurber RL, Willner-Hall D, Rodriguez-Mueller B, Des-nues C, Edwards RA, Angly F, et al. Metagenomic analysis of stressed coral holobionts. Environ Microbiol. 2009;11:2148–63. 39. Bourne DG, Lida Y, Uthicke S, Smith-Keune C. Changes in coral-associated microbial communities during a bleaching event. ISME J. 2008;2:350–63.
40. Correa AMS, Ainsworth TD, Rosales S, Thurber A, Butler CR, Vega Thurber RL. Cryptic outbreak in corals driven by an in situ bleaching event: atypical herpes-like viruses and a new Mega-virus infecting. Symbiodinium. Frontiers Microbiol. 2016;7:127. 41. Krediet CJ, Ritchie KB, Alagely A, Teplitski M. Members of native coral microbiota inhibit glycosidases and thwart coloni-zation of coral mucus by an opportunistic pathogen. ISME J. 2013;7:980–90.
42. Shaver EC, Shantz AA, McMinds R, Burkepile DE, Vega Thurber RL, Silliman BR. Effects of predation and nutrient enrichment on the success and microbiome of a foundational coral. Ecology. 2017;98:830–9.
43. Welsh RM, Rosales SM, Zaneveld JR, Payet JP, McMinds R, Hubbs SL, et al. Alien vs. predator: bacterial challenge alters coral microbiomes unless controlled by Halobacteriovorax pre-dators. Peer J. 2017;5:e3315.
44. Antonius A, Riegl B. Coral diseases and Drupella cornus invasion in the Red Sea. Coral Reefs. 1998;17:48.
45. Latypov YY, Selin NI. Some data on spatio-temporal stability and variability of coral reefs en Khanh Hoa Province (Vietnam). Environ Ecol Manag. 2013;2:1–16.
46. Cardoso AM, Cavalcante JJ, Vieira RP, Lima JL, Grieco MA, Clementino MM, et al. Gut bacterial communities in the giant land snail Achatina fulica and their modification by sugarcane-based diet. PLoS ONE. 2012;7:e33440.
47. Koleva Z, Dedov I, Kizheva J, Lipovanska R, Moncheva P, Hristova P. Lactic acid microflora of the gut of snail Cornu aspersum. Biotechnol Biotechnol Equip. 2014;28:627–34. 48. Leruste A, Bouvier T, Bettarel Y. Enumerating viruses in coral
mucus. Appl Environ Microbiol. 2012;78:6377–9.
49. Williamson KE, Wommack KE, Radosevich M. Sampling nat-ural viral communities from soil for culture-independent ana-lyses. Appl Environ Microbiol. 2003;69:6628–6633.
50. Patel A, Noble RT, Steele JA, Schwalbach MS, Hewson I, Fuhrman JA. Virus and prokaryote enumeration from planktonic aquatic environments by epifluorescence microscopy with SYBR Green I. Nature Prot. 2007;2:269–76.
51. Jiang SC, Paul JH. Occurrence of lysogenic bacteria in marine microbial communities as determined by prophage induction. Mar Ecol Prog Ser. 1996;142:27–38.
52. Nguyen-Kim H, Bettarel Y, Bouvier T, Bouvier C, Doan-Nhu H, Nguyen-Ngoc L, et al. Coral mucus is a hot spot for viral infections. Appl Environ Microbiol. 2015;81:5773–83. 53. Paul JH, Weinbauer MG. Detection of lysogeny in marine
environments. In: Suttle C, Wilhelm SW, Weinbauer MG, ed. Manual of aquatic viral ecology. Waco, TX.: American Society of Limnology and Oceanography; 2010. p. 30–33.
54. Wommack KE, Colwell RR. Virioplankton: Viruses in aquatic ecosystems. Microbiol Mol Biol Rev. 2000;64:69–114. 55. Parada V, Herndl GJ, Weinbauer MG. Viral burst size of
het-erotrophic prokaryotes in aquatic systems. J Mar Biol Ass UK. 2006;86:613–21.
56. Fischer UR, Weisz W, Wieltschnig C, Kirschner AKT, Veli-mirov B. Benthic and pelagic viral decay experiments: a model-based analysis and its applicability. Appl Environ Microbiol. 2004;70:6706–13.
57. Heldal M, Bratbak G. Production and decay of viruses in aquatic environments. Mar Ecol Prog Ser. 1991;71:205–212.
58. Sherr BF, del Giorgio P, Sherr EB. Estimating abundance and single-cell characteristics of respiring bacteria via the redox dye CTC. Aquat Microb Ecol. 1999;18:117–31.
59. Nguyen-Kim H, Bouvier T, Bouvier C, Doan NH, Nguyen NL, Rochelle-Newall E, et al. High occurence of viruses in the mucus layer of scleractinian corals. Environ Microbiol Rep. 2014;6:675–82.
60. Klindworth A, Pruesse E, Schweer T, Peplies J, Quast C, Horn M, et al. Evaluation ofgeneral 16S ribosomal RNA gene PCR primers for classical and next-generation sequencing-based diversity studies. Nucl Acids Res. 2013;41:1–11.
61. Quast C, Pruesse E, Yilmaz P, Gerken J, Schweer T, Yarza P, et al. The SILVA ribosomal RNA gene database project: improved data processing and web-based tools. Nucleic Acids Res. 2013;41:D590–D596.
62. Edgar RC, Haas BJ, Clemente JC, Quince C, Knight R. UCHIME improves sensitivity and speed of chimera detection. Bioinformatics. 2011;27:2194–2200.
63. Schloss PD, Gevers D, Westcott SL. Reducing the effects of PCR amplification and sequencing artifacts on 16S rRNA-based studies. PLoS One. 2011;6:e27310.
64. Price MN, Dehal PS, Arkin AP. FastTree 2 – approximately maximum-likelihood trees for large alignments. PLoS One. 2010;5:e9490.
65. Paradis E, Claude J, Strimmer K. APE: Analyses of phyloge-netics and evolution in R language. Bioinformatics. 2004;20:289–90.
66. Arumugam M, Raes J, Pelletier E, Le Pastier D, Yamada, et al. Enterotypes of the human gut microbiome. Nature. 2011;473:174–80.
67. Buchfink B, Xie C, Huson DH. Fast and sensitive protein alignment using DIAMOND. Nat Methods. 2015;12:59–60. 68. Huson DH, Beier S, Flade I, Gorska A, El-Hadidi M, Mitra S,
et al. MEGAN Community Edition - Interactive exploration and analysis of large scale microbiome sequencing data. PLOS Comput Biol. 2016;12:e1004957.
69. Altschul S, Gish W, Miller W, Myers E, Lipman D. Basic local alignment search tool. J Mol Biol. 1990;215:403–10.
70. Roux S, Enault F, Hurwitz BL, Sullivan MB. VirSorter: mining viral signal from microbial genomic data. PeerJ. 2015;3:e985. 71. Arndt D, Grant JR, Marcu A, Sajed T, Pon A, Liang Y, Wishart
DS. PHASTER: a better, faster version of the PHAST phage search tool. Nucleic Acids Res. 2016;44:W16–W21.
72. Ismail WM, Ye Y, Tang H. Genefinding in metatranscriptomic sequences. BMC Bioinformatics. 2014;15:S8. Suppl 9 73. Soffer N, Brandt ME, Correa AMS, Smith TB, Vega Thurber
RL. Potential role of viruses in white plague coral disease. The ISME J. 2014;8:271–83.
74. Halary S, McInerney JO, Lopez P, Bapteste E. EGN: a wizard for construction of gene and genome similarity networks. BMC Evol Biol. 2013;13:146.
75. Shannon P, Markeil A, Ozier O, Baliga NS, Wang JT, Ramage D, et al. Cytoscape: a software environment for integrated models of biomolecular interaction networks. Genome Res. 2003;13:2498–504.
76. R Development Core Team. (2008). R: a language and envir-onment for statistical computing. R Foundation for Statistical Computing, Vienna, Austria. ISBN 3-900051-07-0, URLhttp:// www.R-project.org.
77. McMurdie PJ, Holmes S. phyloseq: an R package for repro-ducible interactive analysis and graphics of microbiome census data. PLoS One. 2013;8:e61217.
78. Anderson MJ. A new method for non-parametric multivariate analysis of variance. Austral Ecol. 2001;26:32–46.
79. Baselga A, Orme CDL. betapart: and R package for the study of beta diversity. Methods Ecol Evol. 2012;3:808–12.
80. Shannon CE. A mathematical theory of communication. Bell Syst Tech J. 1948;27:379–423.
81. Oksanen J, Blanchet G, Friendly M, Kindt R, Legendre P, McGlinn D et al. Vegan: Community Ecology Package. R package version 2.4-1.2016; https://CRAN.R-project.org/packa ge=vegan.
82. Warnes GR, Bolker B, Bonebakker L, Gentleman R, Huber W, Liaw A et al. gplots: various R programming tools for plotting data. R package version 3.0.1 2016;https://CRAN.R-project.org/ package=gplots
83. De Caceres M, Legendre P. Associations between species and groups of sites: indices and statistical inference. Ecology. 2009;12:3566–74.
84. Vo ST, De Vantier LM, Nguyen VL, Hua TT, Nguyen XH. Coral reefs of the Hon Mun Marine Protected Area, Nha Trang Bay, Vietnam, 2002: Species composition, community structure, status and management recommendations. Proc Sci Conf“Bien Dong 2002”, Nha Trang 16-19 September 2002 649-90 2004. 85. De’ath G, Moran PJ. Factors affecting the behaviour of
crown-of-thorns starfish (Acanthaster planci L.) on the Great Barrier Reef: 2: Feeding preferences. J Exp Mar Biol Ecol. 1998;220:107–26. 86. Pratchett M. Dietary selection by coral-feeding butterflyfishes (Chaetodontidae) on the Great Barrier Reef, Australia. Raffles Bull Zool Suppl. 2007;14:171–6.
87. Cumming RL. Predation on reef-building corals: multiscale variation in the density of three corallivorous gastropods, Dru-pella spp. Coral Reefs. 1999;18:147–57.
88. Willis BL, Page CA, Dinsdale EA. Coral disease on the Great Barrier Reef. In: Rosenberg E, Loya Y, (eds). Coral health and disease. Berlin: Springer; 2004. p. 69–104.
89. Hobbs J-PA, Frisch AJ. Coral disease in the Indian Ocean: prevalence and distribution of white syndrome on remote coral reefs. Dis Aquat Org. 2010;89:1–8.
90. Ainsworth TD, Krause L, Bridge T, Torda G, Raina J-B, Zakr-zewski M, et al. The coral core microbiome identifies rare bac-terial taxa as ubiquitous endosymbionts. ISME J. 2015;9:2261–74.
91. Morrow KM, Bromhall K, Motti CA, Munn CB, Bourne DG. Allelochemicals produced by the brown macroalga, Lobophora sp., are active against coral larvae and associated bacteria, sup-porting pathogenic shifts to Vibrio-dominance. Appl Environ Microbiol. 2016;83:e02391–16. https://doi.org/10.1128/AEM. 02391-16. AEM.02391-16
92. Neave MJ, Apprill A, Ferrier-Pagès C, Voolstra CR. Diversity and function of prevalent symbiotic marine bacteria in the genus Endozoicomonas. Appl Microbiol Biotechnol. 2016;100:8315–24.
93. Pogoreutz C, Rädecker N, Cárdenas A, Gärdes A, Voolstra CR, Wild C. Sugar enrichment provides evidence for a role of nitrogen fixation in coral bleaching. Glob Chang Biol. 2017;23:3838–48.https://doi.org/10.1111/gcb.13695
94. Glasl B, Herndl GJ, Frade PR. The microbiome of coral surface mucus has a key role in mediating holobiont health and survival upon disturbance. ISME J. 2016;10:1–13.
95. Meron D, Atias E, Iasur Kruh L, Elifantz H, Minz D, Fine M, et al. The impact of reduced pH on the microbial community of the coral Acropora eurystoma. ISME J. 2011;5:51–60. 96. Peixoto R, Rosado P, Leite D, Rosado AS, Bourne D. Beneficial
Microorganisms for Corals (BMC): proposed mechanisms for coral health and resilience. Front Microbiol. 2017;8:1–16. 97. Rosenberg E, Koren O, Reshef L, Efrony R, Zilber-Rosenberg I.
The role of microorganisms in coral health, disease and evolu-tion. Nat Rev Microbiol. 2007;5:355–62.
98. Ritchie KB. Regulation of microbial populations by coral surface mucus and mucus-associated bacteria. Mar Ecol Prog Ser. 2006;322:1–14.