Publisher’s version / Version de l'éditeur:
Proceedings of the 22nd IAHR Internation Symposium on Ice, Singapore, August 2014, 2014-08
READ THESE TERMS AND CONDITIONS CAREFULLY BEFORE USING THIS WEBSITE.
https://nrc-publications.canada.ca/eng/copyright
Vous avez des questions? Nous pouvons vous aider. Pour communiquer directement avec un auteur, consultez la
première page de la revue dans laquelle son article a été publié afin de trouver ses coordonnées. Si vous n’arrivez pas à les repérer, communiquez avec nous à PublicationsArchive-ArchivesPublications@nrc-cnrc.gc.ca.
Questions? Contact the NRC Publications Archive team at
PublicationsArchive-ArchivesPublications@nrc-cnrc.gc.ca. If you wish to email the authors directly, please see the first page of the publication for their contact information.
NRC Publications Archive
Archives des publications du CNRC
This publication could be one of several versions: author’s original, accepted manuscript or the publisher’s version. / La version de cette publication peut être l’une des suivantes : la version prépublication de l’auteur, la version acceptée du manuscrit ou la version de l’éditeur.
Access and use of this website and the material on it are subject to the Terms and Conditions set forth at
Re-analysis of load and pressure data acquired from ice impacts during the CCGS Louis St-Laurent 1994 Arctic voyage
Gagnon, Robert
https://publications-cnrc.canada.ca/fra/droits
L’accès à ce site Web et l’utilisation de son contenu sont assujettis aux conditions présentées dans le site LISEZ CES CONDITIONS ATTENTIVEMENT AVANT D’UTILISER CE SITE WEB.
NRC Publications Record / Notice d'Archives des publications de CNRC: https://nrc-publications.canada.ca/eng/view/object/?id=13dd7872-fbf5-42b6-b7a3-26ce8516033f https://publications-cnrc.canada.ca/fra/voir/objet/?id=13dd7872-fbf5-42b6-b7a3-26ce8516033f
22
ndIAHR International Symposium on Ice
Singapore, August 11 to 15, 2014
Re-analysis of Load and Pressure Data Acquired from Ice Impacts
During the CCGS Louis St-Laurent 1994 Arctic Voyage
R. Gagnon
Ocean, Coastal and River Engineering National Research Council of Canada
St. John’s, NL, Canada robert.gagnon@nrc-cnrc.gc.ca
Ice load and pressure data from the 1994 CCGS Louis St-Laurent trip through the Arctic were re-analyzed using a different method than was used for the original report. The impact events that were chosen for re-analysis spanned a variety of ship speeds, ice thicknesses and concentrations. For any given impact event all sub-panel segments (cells) of the strain-gauged hull panel for which a signal registered above the deemed noise level were considered to be subjected to ice load. Consequently all of the ice contact area, and associated ice load, was taken into account regardless of whether the ice contact consisted of a single area or multiple non-contiguous areas on the impacted panel. The data from a total of 51 randomly selected events covering a range of ice contact areas from 1.4 m2 to 16.8 m2 were initially analyzed to yield load and pressure distribution at the time of peak load for each event. Then further analysis was conducted to identify well-behaved events where the loaded areas were more contained on the panel and less concentrated at its edges. The effects of using this selection strategy are shown. For the data from the well-behaved events the pressure-area relationship was essentially flat with an average value 0.49 MPa over the stated range of contact area. Another set of 12 impact events were also analyzed, for which the full time-series of pressure on each of the 30 cells that comprise the panel were available from the original reduction of data. An analysis of load and contact area from these events demonstrated the effect of having oversized cells on ice impact panels, that leads to overestimates of ice contact area and underestimates of average pressure. The analysis suggested that the best estimates of actual ice contact area and average pressure, though still not fully accurate, are obtained when the contact area is the greatest, i.e. usually at peak load.
1. Introduction
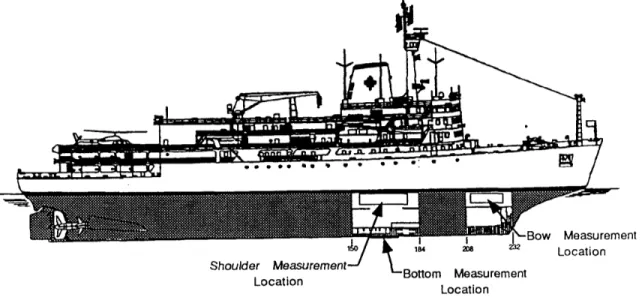
In 1994 the CCGS Louis St-Laurent accompanied by the United States Coast Guard Cutter (USCGC) Polar Sea, made an Arctic transit and collected ice impact data throughout most of the voyage. Following damage to one of the Polar Sea’s propellers in heavy ice near the North Pole the vessels were assisted by the Russian nuclear ice breaker Yamal that happened to be at the Pole at that time. Details of the Louis St-Laurent vessel and voyage can be found in Ritch et al. (1997; 1999). Three portions of the inner hull of the ship (bow, shoulder and bottom) were instrumented with strain gauges so that impact loads and pressure distributions could be determined. This paper deals with data that were collected on the bow instrumented area. The locations of the instrumented segments (panels) are shown in Figure 1. While there is an ongoing need to improve codes and rules for operations in Arctic regions there have been no significant field experiments in the past decade. Hence, until the needed (and expensive) experiments are performed the best that can be done in the interim is to get the most useful information possible from data sets acquired from earlier field programs. The Louis St-Laurent 1994 program was a major endeavor and the data acquired very extensive and rich. These data have not been published widely in the literature, and as we shall see, there is room to glean further, possibly improved, insights into ice impact behavior than have already been reported by applying analysis methods that are more suited to reveal ice behavior.
2. Analysis Method
In this paper we are focusing only on ice impact events on the bow panel. Due to the layout of the strain gauges on the bow panel segment of the hull and the finite element model used to analyze the strain information Ritch et a1. (1997) were able to represent the panel as a 6 x 5 array of cells similar to the schematics of the panel shown in Figure 2. There were some small variations in the areas of the cells from the top to the bottom row, where the average cell size was 0.676 m2. Hence the total measurement area of the panel was ~ 20.3 m2.
There are three aspects of the present data analysis method that vary from the method used in the original analysis. One aspect is that the present method takes into account all of the ice contact area on the bow panel at the time of peak load regardless of whether the contact consists of one or multiple areas whereas the former analysis only considered contact areas that were contiguous. Another aspect is that in the present method the 'zeroing' technique used for each cell during impact events was somewhat more rigorous than the original analysis, when it was feasible to use. That is, a 'zero' value of average pressure was selected for each of the cells at a suitable time segment just prior to or just after each analyzed impact. Note that we are ‘zeroing’ data that has already been processed, as available in the report (Ritch et al., 1997). In the cases where this was not feasible the ‘zero’ value was assumed to be 0.0 kPa. Also a level of noise (50 kPa) was roughly estimated from the typical jitter in the data before impacts occurred which a signal had to exceed, as measured from its zero value, before it was considered to be a real signal. These analysis aspects tended to reduce the effect of miscounting (usually over counting) the number of cells experiencing ice contact that arises simply from noise in the signals and inaccurate zero values, and furthermore reduced the effect of under counting that would occur due to counting only contiguous cells that were experiencing load.
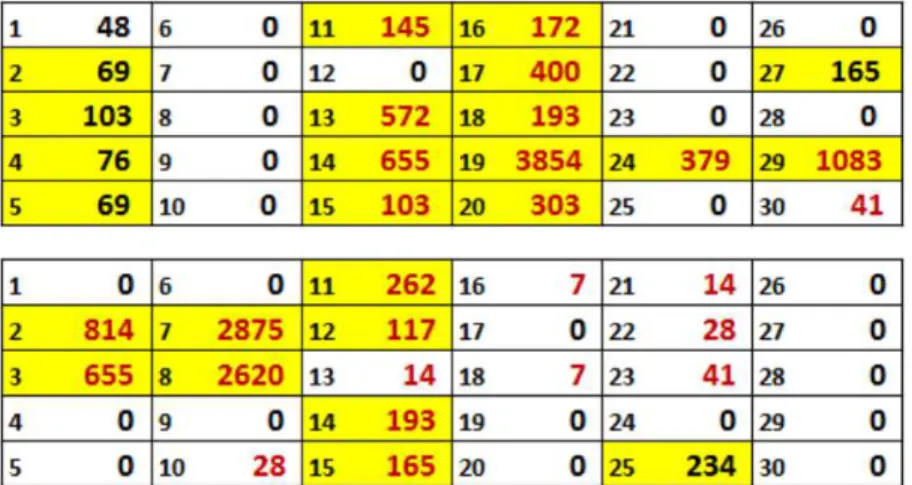
As examples we will look at the load patterns at the time of peak load on a representation of the 30 cells of the bow panel for two typical impact events (Figure 2). The numbers at the inside right of each cell are the average pressure on that particular cell at the time of peak load. As mentioned above, in the present analysis all of the cells showing an average pressure that exceeds the noise level, as measured from the zero value, are considered to be experiencing load from ice contact (cells highlighted in yellow, Figure 2). Hence in the case of the top schematic in Figure 2 a total of 16 cells are counted. In contrast, the former method would have counted the cell showing the highest pressure (cell # 19) and those cells contiguous to it, for a total of 12, i.e.
Figure 2. Two schematics of the horizontal bow panel showing the 30 individuals cells that comprise it. The schematics show the pressure signals over the whole panel for two different impact events at the time of peak load. The small black number at the inside left of each cell is the cell number. The number (black or red) at the inside right of each cell is the average pressure (kPa) on the cell. Cells highlighted in yellow correspond to those that are counted when using the present analysis method. Cells with pressure values in red text correspond to those that are counted when using the original analysis method. The top schematic is an example of the original analysis method under counting the number of cells experiencing ice contact compared to the present method. The bottom schematic is an example of over counting. In both schematics the aft of the vessel is at the right.
the cells showing pressure in red text. The bottom schematic in Figure 2 is an example of where the former analysis method would over count the number of cells experiencing load from ice. That is, the former method would have counted 15 cells (pressure in red text) compared to the present method that counted 9 cells (highlighted in yellow).
Since the focus of the present analysis is to enhance our understanding of the ice behavior during impact and crushing events we deem it important to include all the ice contact during impact events. This strategy recognizes that field impact experiments of the 1994 Arctic transit type are often very different from laboratory and controlled field ice crushing or impact experiments, where tests start with ice that has simple and well-defined shapes, e.g. pyramid or wedge shaped ice specimens. Ice that would have been impacted by the Louis St-Laurent would in most cases likely have had jagged edges (i.e. very rough at large scales). Multiple simultaneous contact areas from such ice surfaces would have been the norm. Furthermore, some movement/rotation of the smaller ice pieces in the horizontal plane could occur in broken ice floes or channels during impacts. Similarly, downward motion of the contacted edge, due to the slope of the hull at the bow panel location, could occur for existing ice pieces or ones created during the impacts. 3. Analysis Results
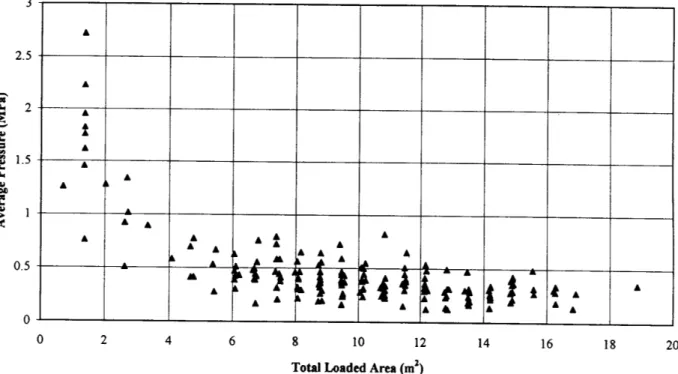
We will now look at the data from 51 randomly chosen impact events covering a range of ice contact areas from 1.4 m2 to 16.8 m2. We recall that the data set from the original analysis method, corresponding to events that were centered and fairly well contained on the panel, yielded the pressure-area curve shown in Figure 3 (Ritch et al., 1997). Figure 4 shows a plot of the data from the 51 randomly chosen events using the original analysis. Not surprisingly Figure 4 is similar to Figure 3 since many of the data points are the same and the trend in Figure 3 is roughly followed even by events that are not so well-centered on the panel. If we perform the
Figure 3. Average pressure over loaded area versus loaded area at time of peak force for events centered in the panel and edge pressures less than 10% of peak pressure. (From Ritch et al. (1997))
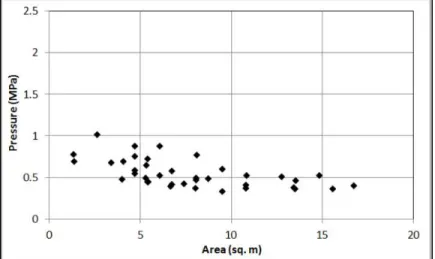
present analysis on the impacts shown in Figure 4 we obtain a pressure–area chart as shown in Figure 5. We note it looks quite different than Figure 4. If we refine our selection of events and use only the ones from the initial 51 events that Ritch et al. (1997) determined were well-behaved, i.e. more centered and contained on the impact panel, we obtain Figure 6, which represents 38 events. If we refine the selection criteria even more by specifying that the pressure on the cell with the highest pressure must always be greater than 3.57 times the pressure on any perimeter
cell then the number of data points reduces further to 17 and the plot becomes that shown in Figure 7. Statistically speaking it is reasonable to say from this exercise that for the well-behaved events the pressure-area relationship was essentially flat with an average value of 0.49 MPa over the stated range of contact area. It is noteworthy that we have seen a similar trend of roughly constant pressure with increasing contact area during indentation experiments on multiyear sea ice at Hobson’s Choice Ice Island. Frederking and Sudom (2008) plotted average pressure versus nominal contact area for tests TFR-2 and TFR-3 and observed the trend, ignoring the cyclic sawtooth pattern over-riding the pressure data. Similarly, the present author independently performed the same exercise for test TFR-4 and observed the trend. Additionally, numerical simulations of growler impacts, using a validated ice model, have also shown this trend (Gagnon, 2007). The tacit assumption in comparing the pressure-area trend from these exercises with the Louis St-Laurent pressure-area trend is that the actual ice contact area is roughly a constant fraction of the nominal contact area, an arguably reasonable assumption.
4. Effect of the Bow Panel Cell Size
The original data provide the full time series pressure outputs for all 30 cells comprising the bow panel for a class of impact events considered as ‘glancing blows’. These files are in the directory
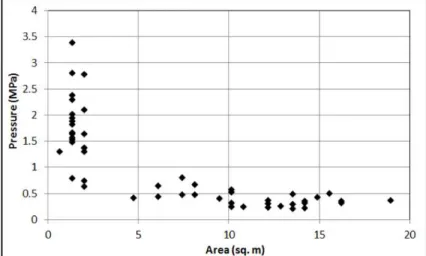
Figure 4. Average pressure over loaded area versus loaded area at time of peak force for 51 randomly selected impact events. (Data from Ritch et al. (1997))
Figure 5. Average pressure over loaded area versus loaded area at time of peak force for 51 randomly selected impact events (present analysis method).
called ‘SELECT’ in the digital data that is associated with the basic report. The basic report is available from R. Frederking at OCRE-NRC, Ottawa, Canada. A glancing blow event, as determined by the authors, is one where the first ice edge contact is with the bow panel, that is, there is no bow-stem ice contact first followed by the ice contact then sliding onto the bow panel.
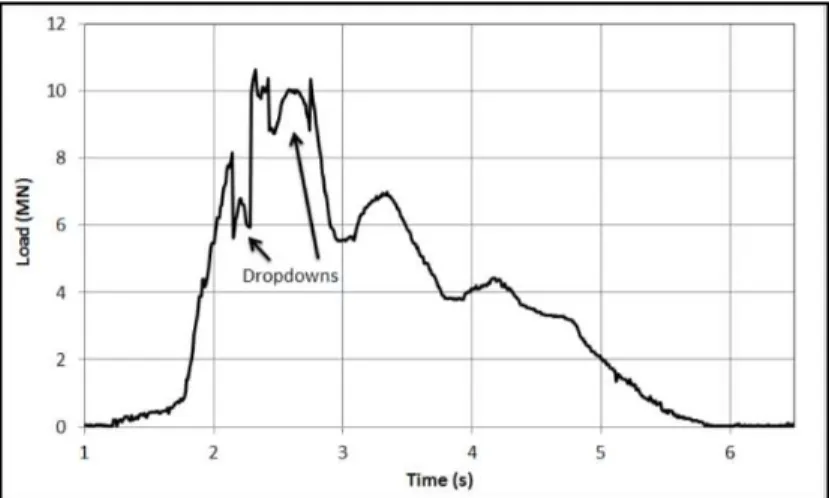
We note that the present analysis method, involving a further level of zeroing than was originally used and compensation for noise in the cell pressure data, tended to ‘clean up’ the time series plots of contact area for the events we analyzed compared to what the original plots looked like. That is, the tallies of the full contact areas in the original analysis usually included or excluded the counting of some cell areas as the result of spurious signals associated with noise and zeroing. The early segment of the contact area plot of Figure 9 in Ritch et al. (1999) is an example of this. Substantial contact area is indicated before any substantial load or average pressure is evident. Additionally the method of only counting contiguous contact areas, employed by the original authors, leads to discontinuities in the load, contact area and average pressure time series. For example, the load data shown in Figure 9 in Ritch et al. (1999), reproduced here in Figure 8, exhibits discontinuities that appear as abrupt dropdowns. A dropdown occurs when a region of the ice contact area abruptly (within one time step) becomes non-contiguous with the main contact region and then reestablishes contiguity several time steps later. The unrealistic effects caused by excluding the non-contiguous contact areas we deem as one of the important reasons for using the present method of data analysis for understanding the actual ice behavior.
Figure 6. Average pressure over loaded area versus loaded area at time of peak force for the 38 well-behaved events from the initial set of 51 randomly selected impact events (present analysis method).
Figure 7. Average pressure over loaded area versus loaded area at time of peak force for the more stringently defined 17 well-centered and contained events from the initial set of 51 randomly selected impact events (present analysis method).
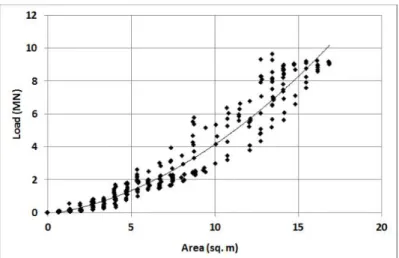
We have investigated the spatial and temporal nature of the ice contact and its influence on the loads and pressure distributions on the panel through analysis of 12 of the SELECT events, but space is not adequate here to discuss that so it will be included in a future publication. We can, however, include one observation from that analysis that relates to the influence of the bow panel cell size. If we look at the time series plots of contact area and load from a typical impact event from the SELECT events we note that the traces are similar, as expected, but that the low magnitude regions of features in the contact area traces are somewhat exaggerated compared to the corresponding features on the load traces. For example, in Figure 9 the magnitudes of the bumps on either side of the central load peak have certain heights relative to the central peak. On the corresponding contact area time series trace the bumps are higher relative to the central peak. This effect may also be observed as an upward curvature (i.e. increasing slope) in plots of load versus contact area (e.g. Figure 10, same event as Figure 9). This effect reflects the lack of spatial resolution in the pressure distribution measurement device, that is, only small portions of some of the panel’s cells are actually contacted by ice at any instant in time during an impact event but the whole areas of these cells are counted when tallying the total ice contact area. As the load becomes higher and the general area of actual ice contact becomes larger during an impact event the effect of the large cell size becomes less pronounced. To reiterate, this is solely the effect of oversized pressure measurement cells. This discussion emphasizes the need for higher spatial resolution impact panels in general for studies of impact and crushing behavior of ice. From these considerations the best estimates of ice contact area and average pressure from data acquired using impact panels with oversized cells, while still lacking full accuracy, would be obtained at the time where the actual ice contact areas are the greatest (i.e. usually at the peak loads).
Figure 8. Total load versus time for impact event K3400520. The data are from Ritch et al. (1997).
5. Conclusions
A method has been used for analysis of data from the Louis St-Laurent 1994 Arctic voyage that sheds new light on the behavior of the ice during the impact events. The method differs from the original analysis technique in that all areas of ice contact on the impact panel are included during the events. The present method also uses an additional level of zeroing, where possible, for the original cell pressure time series data and compensates for a certain level of noise. These analysis refinements generally provide cleaner and more complete records of load, contact area and average pressure for the events. An analysis of load and ice contact area showed the effect of having oversized cells on impact panels and suggested that the best estimates of actual ice contact area are obtained when the contact area is the greatest, i.e. usually at peak load. 51 randomly selected impact events were initially analyzed to yield load and pressure distribution at the time of peak load for each event. Then a smaller subset of well-behaved events were identified where the loaded areas were more contained on the panel. For the data from the well-behaved events the pressure-area relationship was essentially flat with an average value of ~ 0.49 MPa over the stated range of contact area.
6. Acknowledgements
I would like to thank Bob Frederking for suggesting this study and for providing the original report and data from the OCRE-NRC Ottawa archives. I am very grateful to Ron Ritch for providing ancillary data and for patiently discussing details of the original study with me. I am also grateful to Transport Canada for providing access to the data and NRC for its support.
7. References
Frederking, R. and Sudom, D. 2008. Local Ice Pressure Distributions during 1990 Hobson’s Choice Ice Island Multi-Year Ice Indentation Tests. Proc. 19th IAHR International Symposium on Ice, Vol. 2, 815-827.
Gagnon, R. 2007. Results of Numerical Simulations of Growler Impact Tests. Cold Regions Science and Technology 49 (2007) 206–214.
Ritch, R., St. John, J. and Browne, R. 1997. Ice Load Impact Measurements on the CCGS Louis S. St-Laurent during the 1994 Arctic Ocean Crossing – Analysis and Conclusions. Transport Canada File No. T8080-4-6051, Final Report, July, 1997.
Ritch, R., St. John, J., Browne, R. and Sheinberg, R. 1999. Ice Load Impact Measurements on the CCGS Louis S. St-Laurent during the 1994 Arctic Ocean Crossing. Proc. 19th International Conference on Offshore Mechanics and Arctic Engineering – OMAE 99, Paper number OMAE99-1141.