Publisher’s version / Version de l'éditeur:
Vous avez des questions? Nous pouvons vous aider. Pour communiquer directement avec un auteur, consultez la première page de la revue dans laquelle son article a été publié afin de trouver ses coordonnées. Si vous n’arrivez Questions? Contact the NRC Publications Archive team at
[email protected]. If you wish to email the authors directly, please see the first page of the publication for their contact information.
https://publications-cnrc.canada.ca/fra/droits
L’accès à ce site Web et l’utilisation de son contenu sont assujettis aux conditions présentées dans le site LISEZ CES CONDITIONS ATTENTIVEMENT AVANT D’UTILISER CE SITE WEB.
Student Report; no. SR-2010-18, 2010-08-01
READ THESE TERMS AND CONDITIONS CAREFULLY BEFORE USING THIS WEBSITE.
https://nrc-publications.canada.ca/eng/copyright
NRC Publications Archive Record / Notice des Archives des publications du CNRC :
https://nrc-publications.canada.ca/eng/view/object/?id=8d961dc6-64f8-462a-bf51-4d662f308e2b https://publications-cnrc.canada.ca/fra/voir/objet/?id=8d961dc6-64f8-462a-bf51-4d662f308e2b
NRC Publications Archive
Archives des publications du CNRC
For the publisher’s version, please access the DOI link below./ Pour consulter la version de l’éditeur, utilisez le lien DOI ci-dessous.
https://doi.org/10.4224/17210705
Access and use of this website and the material on it are subject to the Terms and Conditions set forth at
VAST Field Trials – Phase 1
DOCUMENTATION PAGE
REPORT NUMBER
SR-2010-18
NRC REPORT NUMBER DATE
August 2010
REPORT SECURITY CLASSIFICATION
Unclassified
DISTRIBUTION
Unlimited
TITLE
VAST Field Trials – Phase 1
AUTHOR (S)
Jonathan Mesh
CORPORATE AUTHOR (S)/PERFORMING AGENCY (S)
Institute for Ocean Technology, National Research Council, St. John’s, NL
PUBLICATION
SPONSORING AGENCY(S)
IOT PROJECT NUMBER NRC FILE NUMBER KEY WORDS
VAST, lifeboat, field trials
PAGES iv, 25 FIGS. 13 TABLES 2 SUMMARY
The Institute for Ocean Technology along with the Memorial University of Newfoundland completed phase 1 of Validation and Accreditation of Simulator Training (VAST) field trails. The field trails were completed in May 2010 in Holyrood, Newfoundland, Canada.
Although simulation training in many other areas has existed for many years, it has only recently become a part of marine safety and therefore very little research has been done in this area. The VAST study proposed to examine how simulated lifeboat navigation training may improve
performance in emergency evacuation situations involving ice covered waters, compared to those trained under standard training regimes.
19 Naive Participants were recruited, trained, and completed a series of tests, which involved operating a totally enclosed motor propelled safety craft through a simulated ice field. The 19 participants were divided into threes groups which each received a different form of training.
Participants from groups 1 and 2 received a traditional form of training, where as the participants from group 3 were trained solely using a davit launched lifeboat simulator.
The preliminary results for the performance data for one participant in each of three groups will be presented in this report. The human data acquired from the trials is not yet in a form capable of being analyzed.
Thus far all the preliminary results from rudder executions, DGPS lifeboat paths and impacts indicate that group 3 appears to have more control over the movement and responsiveness of the lifeboat. Therefore they are able to completed manoeuvres that ultimately avoid major impacts and potential damage to the lifeboat.
ADDRESS National Research Council
Institute for Ocean Technology Arctic Avenue, P. O. Box 12093 St. John's, NL A1B 3T5
National Research Council Conseil national de recherches Canada Canada Institute for Ocean Institut des technologies
Technology océaniques
VAST Field Trials – Phase 1
SR-2010-18
Jonathan Mesh August 2010
SUMMARY
The Institute for Ocean Technology along with the Memorial University of Newfoundland completed phase 1 of Validation and Accreditation of Simulator Training (VAST) field trails. The field trails were completed in May 2010 in Holyrood, Newfoundland, Canada.
Although simulation training in many other areas has existed for many years, it has only recently become a part of marine safety and therefore very little
research has been done in this area. The VAST study proposed to examine how simulated lifeboat navigation training may improve performance in emergency evacuation situations involving ice covered waters, compared to those trained under standard training regimes.
19 Naive Participants were recruited, trained, and completed a series of tests, which involved operating a totally enclosed motor propelled safety craft through a simulated ice field. The 19 participants were divided into threes groups which each received a different form of training. Participants from groups 1 and 2 received a traditional form of training, where as the participants from group 3 were trained solely using a davit launched lifeboat simulator.
The preliminary results for the performance data for one participant in each of three groups will be presented in this report. The human data acquired from the trials is not yet in a form capable of being analyzed.
Thus far all the preliminary results from rudder executions, DGPS lifeboat paths and impacts indicate that group 3 appears to have more control over the movement and responsiveness of the lifeboat. Therefore they are able to completed manoeuvres that ultimately avoid major impacts and potential damage to the lifeboat.
TABLE OF CONTENTS 1 INTRODUCTION ... 1 1.1 Background Information ... 1 1.2 Testing... 2 2 PLANNING... 3 2.1 Fieldwork Location ... 3 2.2 Recruitment ... 3 2.3 Training ... 4 2.3.1 Group 1... 4 2.3.2 Group 2... 4 2.3.3 Group 3... 5
2.4 Simulated Ice Field... 5
2.4.1 Ice field design... 5
2.4.2 Ice field fabrication and installation ... 7
2.5 Lifeboat Modifications... 8 3 TESTING ... 9 3.1 Test Procedure... 9 3.2 Test Matrix... 10 3.3 Data Acquisition ... 11 3.4 Testing Delays... 12 4 DATA ANALYSIS... 13 5 PRELIMINARY RESULTS ... 14 5.1 Group 1 Results ... 14 5.2 Group 2 Results ... 17 5.3 Group 3 Results ... 19 5.4 Comparison ... 21 6 CONCLUSION... 24 7 REFERENCES ... 24
1 INTRODUCTION
1.1 Background Information
Shipping and offshore industries are migrating towards operations in ice-covered waters as gateways to operating in Arctic environments. With this move, there is an increased need for equipment, procedures, and training to operate in cold and harsh environments. Currently, no training exists for lifeboats coxswain charged with navigating lifeboats in ice-covered water during emergency evacuation situations. This research study sets out to examine simulator training in
comparison with traditional Standard Training, Certification and Watchkeeping (STCW) training to observe performance differences in a simulated ice field. These findings will inform manufacturers, trainers and regulators regarding the demands associated with lifeboat navigation in ice-infested waters.
Although simulation research and training in many domains have existed for many years, it has only recently become a part of maritime studies. Simulation training can potentially be used as a safe alternative to traditional training (Yuan et al., 2007, Veitch et al., 2008, Edmonds, D., 1992). The benefits of simulation training have not yet been substantiated empirically, yet in studies in the field of medical research have reported that possible benefits include transfer of skills, improvement in psychomotor skills (Kewman et. al, 1985) and time to
performance proficiency (Aggarwal et.al, 2006 ).
In 2009 the Memorial University of Newfoundland and the Institute for Ocean Technology (IOT) of the National Research Council of Canada (NRC) entered into a collaborative agreement aiming at establishing the operational
performance of simulator training. The study proposed to examine how simulated lifeboat navigation training may improve performance in emergency evacuation situations involving ice covered waters, compared to those trained under
The project involved full-scale field trials, which were conducted in Holyrood, NL on May 11-17, 2010. Nineteen naive participants, between the ages of 20 to 26, were recruited and randomly divided into three groups. Groups 1 and 2 received a traditional form of standard, where as group 3 were trained solely using
simulation methods. During trials the participants had to navigate the lifeboat through a simulated ice field, designed to represent 1/10 nominal ice covered waters. Performance Data such as change in rudder angles (deg), DGPS (lat-long), global impacts (N) and rates and accelerations (g) was recorded.
1.2 Testing
All testing is complete for phase 1, however only preliminary data analysis has been completed. The preliminary data analysis focuses only the performance data because the human data is not yet in a format capable to be analyzed. During testing there were a total of 114 runs completed through the simulated ice field that evaluated the effects of simulator training. Also, an additional 38 runs were completed during testing to obtain environmental data such as weather and sea conditions.
2 PLANNING
Before the necessary testing could begin for the Validation and Accreditation of Simulator Training (VAST) field trails, a large amount of planning and deliberation had to first be completed. This included project meetings, where personnel
involved could discuss milestones and incomplete tasks. The planning phase of the project also included the selection of possible site locations for field-testing, recruitment and training of participants, unique design and construction of the simulated ice course and preparation of the modified lifeboat.
2.1 Fieldwork Location
Before field trails could begin a site location had to be chosen and many options had to be considered such as accessibility, availability, and proximity to town. Accessibility was very important during field trails because of the large amount of equipment that had to be transported, prepared and stored. This equipment included the Lifeboat, FRC and NRC trailer, which was used to store equipment such as computers, floater suits, wireless data receivers and tools. Since all of the participants had to be transported to and from the test site, the proximity to town was also very important. The location chosen to perform the VAST field trials was the Marine Institute installations in Holyrood, NL. The Marine Institute was chosen because of its available facility, which was ideal for storing
equipment and sheltering participants. The Marine Institute also provided access to a private wharf, making it much easier to access the lifeboat during trials.
2.2 Recruitment
For the VAST field trails project 19 healthy individuals (8 females and 11 males) were recruited. The recruitment process consisted of posting project
advertisements throughout the memorial university campus. The posting briefly explained the VAST project and also any requirements needed to participate. One major requirement was that the participant must be naive meaning that they must have had no previous experience with lifeboats. The chosen participants received 50 dollars for the training aspect and 50 dollars for the testing. The total
time the each participant would have to commit to the project would be between 14-16 hours. Once the participants were chosen they were given a consent form, which described the project more in-depth and also outlined any risks associated with the project. After all participants had given informed consent, they were randomly assigned to three groups. Six Participants were assigned to the control group (group 1), seven to experimental group A (group 2) and six to experimental group B (Group 3). These three groups received three different types of training (outlined in training section) before the testing phase had begun.
2.3 Training
The participants took part in two training sections. The first training session was completed by all 19 participants and consisted of a Pleasure Craft Operator Course (PCOC). The PCOC is a course administered by the Canadian Power and Sail Association to familiarize people with the operations of small pleasure crafts. Upon completion of the PCOC the participants were randomly assigned to one of the three groups mentioned earlier (group 1, group 2 or group 3).
2.3.1 Group 1
Six participants were randomly assigned to group 1, which was considered the control group. The participants assigned to group 1 were given the least amount of training of all three groups. Group 1’s training consisted of the Standard Training Certification and Watchkeeping (STCW), which focused on lifeboat standard operating procedures and manoeuvring in open water. During this training process each of the six participants were allotted thirty minutes to manoeuvre the lifeboat in calm, open water. The STCW training was the only lifeboat training received by group 1 participants before testing.
2.3.2 Group 2
Seven participants were randomly assigned to group 2, which was experimental group A. The participants in Group 2 were given the same STCW training as the group 1 participants, along with additional classroom training. The classroom training was primarily based on manoeuvring in ice-covered waters.
2.3.3 Group 3
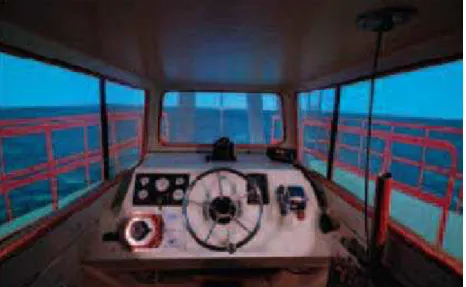
Group 3, which was experimental group B, consisted of the remaining six participants. The participants assigned to group 3 were trained solely using simulation technologies. The participants were given 30 minutes each in the simulator and encountered two of the following conditions. First, each participant assigned to group 3 completed a simulated version of the STCW training criteria. Once STCW training was complete, a simulation was started that required the participant to navigate through ice-covered waters mixed with increasingly worse weather conditions. Group 3 simulator training was performed in a davit launched lifeboat simulator, which was designed by Virtual Marine Technology (VMT). The simulator consists of four 32-inch LCD monitors representing bow, stern, port and starboard views. The throttle and steering wheel position was similar to that of the lifeboat used in the actual field trails. Figure 1 shows an image of the davit launched lifeboat simulator.
Figure 1 – Davit launched lifeboat simulator design by VMT
2.4 Simulated Ice Field 2.4.1 Ice field design
The simulated ice field was designed to represent nominal ice coverage that forces the participants to execute several avoidance manoeuvres. The ice field was designed to have a length of 10 lifeboat lengths (53m) and a width of 10
lifeboat beams (22m). Forty 3-barrel objects and six aluminium frames were used to give total ice coverage of approximately 10%. Each 3-barrel object and
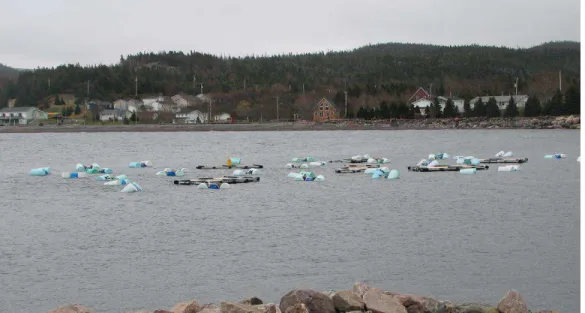
aluminium frame had dimensions of 1.0m x 1.5m and 5.0m x 2.5m respectfully. Figures 2 and 3 show an illustration of the ice field design as well as a picture of the actual ice field used in testing respectfully.
Figure 2 – Design of simulated ice field for VAST trials
2.4.2 Ice field fabrication and installation
To create the simulated ice field forty 3-barrel objects and six aluminium frames were fabricated. The 3-Barrel objects were constructed using three 50 gallon plastic barrels connected together against a yoke and strapped around the perimeter. The six aluminium frames were fabricated by welding a rectangular aluminium frame with two aluminium supports in the centre and 8 floating docks on the inside edge of the frame. Several sheets of plywood were attached to the top of the aluminium frame so that it could be accessed during field trails. Large pieces of rubber were wrapped around the 4 corners of the frame to insure that the sharp aluminium corner would not damage the hull of the lifeboat during impacts. Figure 4 shows a fully fabricated 3-barrel obstacle used in the simulated ice field.
Once fabrication of the barrel objects and aluminium frames was complete they were transported to the field trails site to be installed. To create the simulated ice field, anchors were strategically placed using the ice field illustration and GPS locations as a guide. After the anchors were in place the 3-barrel objects and aluminium frames were tied to the anchors to insure that the ice field would have as little movement as possible. To properly simulate a piece of ice, the 3-barrel objects and aluminium frames were ballasted. The objects were ballasted by filling the barrels and floating docks with water until the desired weight was achieved.
Figure 4 – 3-barrel obstacles used in the simulated ice field
2.5 Lifeboat Modifications
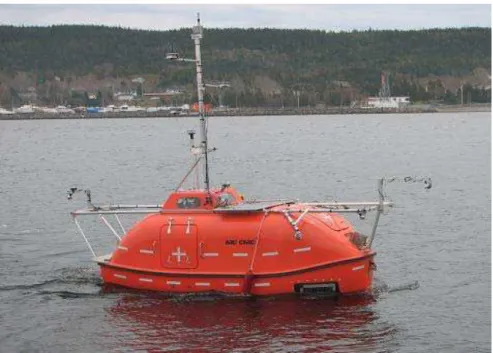
The lifeboat that was used in the VAST field trails was a Totally Enclosed Motor Propelled Safety Craft (TEMPSC), which was manufactured in Beihai Shipyard, China. It is IMO-SOLAS rated for 20 occupants, but has been retrofitted as a research craft. The dimensions of the lifeboat are: length 5.28 m, breadth 2.20m and depth 1.10 m. The lifeboat has undergone many modifications since arriving at IOT in March of 2007. Some of these modifications include two acrylic impact panels located on starboard and port side of the bow. The panels are connected to a six-component dynamometer, located in the bow of the lifeboat, which measures the amplitude of impact force on the panels when a collision occurs. The lifeboat has also been fitted with a data acquisition system capable of
monitoring the over 100 channels. As seen from figure 5 a rectangular aluminum frame has been constructed around the outside of the lifeboat. The aluminum frame is used to mount 6 exterior cameras as well as three solar energy panels. The 6 cameras are located throughout the exterior of the lifeboat as follows: (1) bow looking forward (2) stern looking aft, (3) bow looking down on port side impact panel, (4) bow looking down on starboard side impact panel, (5) bow looking down on hull, and (6) stern looking down on rudder. There are also two
interior cameras equipped on the lifeboat. One of the interior cameras looked out through the port side impact panel and the other observed the coxswains as they operated the lifeboat. The solar panels located on the roof of the lifeboat are used to power the data acquisition system located inside the lifeboat. The lifeboat is also fitted with a large 15-foot aluminum mast that is used to mount the five wireless transmitters. The wireless transmitters relay the monitored data to a remote PC located onshore, where the data can be monitored and stored by IOT personnel. Figure 5 shows the locations of the modified equipment on the
exterior of the lifeboat.
Figure 5 - Lifeboat during VAST field trails showing exterior modifications
3 TESTING
3.1 Test Procedure
The test procedure began with the participant being instrumented with an
electrocardiogram (ECG), which was used to measure heart rate variability. Once the ECG was instrumented the participants were fitted with a full immersion suit. The participant was then asked to stay seated and relax for five minutes before entering the lifeboat so that a baseline heart rate could be recorded. The
participant then walked to the end of the dock and entered the lifeboat, where two trained personnel from the IOT field trials team accompanied them onboard. When all of the hatches were closed and the participant had taken their position in the coxswain seat of the lifeboat, testing could now begin. The testing
consisted of six runs through the simulated ice field followed by and upwind and downwind run. These series of runs would take approximately forty-five minutes to one hour to complete. During the test series any information, such as run directions or hazardous weather conditions, were transmitted to the IOT
personnel inside of the lifeboat via portable radio. Once all runs were completed a trained personnel inside the lifeboat would dock the lifeboat and the participant was able to exit. All instrumentation was removed from the participant and an exit questionnaire about the overall experience of operating the lifeboat was
completed.
3.2 Test Matrix
Each participant was given the instruction to complete six runs through the simulated ice field. Each run through the ice field was oriented in a different direction. The six runs completed were (1) north to south, (2) south to north, (3) east to north, (4) east to south, (5) northwest to southeast and (6) southeast to northwest. The north to south and south to north runs correspond to a straight path lengthwise through the 53 x 22 meter ice field. The east to north and east to south runs force the participant to execute a starboard and port turn, respectfully, after the lifeboat had entered the Ice field. The northwest to southeast and
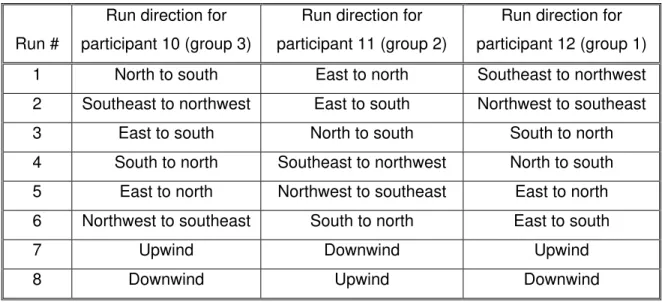
southeast to northwest runs correspond to a diagonal run through the ice field where the participant is required to execute several rudder manoeuvres to avoid any collisions. For each participant a random order of runs was chosen such that no two participants had completed all six runs in the same order. Once all of the six runs were completed an upwind and downwind run were completed so that the speeds and accelerations can be recorded as well as weather conditions such as temperature and wind speed. An example of the text matrix for one participant from each of the 3 groups is given in Table 1.
Run #
Run direction for participant 10 (group 3)
Run direction for participant 11 (group 2)
Run direction for participant 12 (group 1)
1 North to south East to north Southeast to northwest
2 Southeast to northwest East to south Northwest to southeast
3 East to south North to south South to north
4 South to north Southeast to northwest North to south
5 East to north Northwest to southeast East to north
6 Northwest to southeast South to north East to south
7 Upwind Downwind Upwind
8 Downwind Upwind Downwind
Table 1 – Sample of test matrix from day 3 of field trails
A perimeter run was also completed in the morning before testing had begun and also in the afternoon once testing had commenced. A trained personnel from the Institute for Ocean Technology field trails team was responsible for manoeuvring the lifeboat around the outer perimeter of the simulated ice field. The perimeter run was completed to obtain GPS locations of the course at the beginning and end of each test day, making it possible to see how much the course may have shifted throughout that day and also from day to day.
3.3 Data Acquisition
The data for the VAST field trails was collected using the data acquisition system located inside of the lifeboat. The data acquisition system is capable of recording up to 120 channels. However, for the VAST test series the main channels that were collected and used in the data analysis are as follows:
1- Position and Heading [Lat & Long, X-Y] 2- Linear motions [surge, sway and heave] 3- Angular motions [roll, pitch and yaw]
4- Craft accelerations and rates [Longitudinal, transverse and vertical] 5- Craft impact local loads [Port]
7- Occupant (dummy) accelerations and rates [Longitudinal, transverse and vertical]
8- Steering [rudder angle] 9- Throttle control [rpm]
10- Lifeboat internal levels of CO and CO2 [Safety requirements] 11- Noise and temperature levels
12- Environmental conditions: wind speed and direction, external temperature, humidity and wave amplitude if not calm conditions.
A different set of data and video was taken for every run of the Test series. Therefore each participant had eight sets of data that corresponded to their six runs through the course as well as the upwind and downwind runs. Video was also recorded for each of the eight runs for every participant. For each run the six exterior cameras and two interior cameras, that are equipped on the lifeboat, captured video in several different directions.
Environmental conditions such as average wind speed, maximum wind speed, temperature and humidity were recorded throughout the day. All Environmental conditions as well as important issues or problems occurred during testing were recorded in a field trails logbook.
3.4 Testing Delays
During the VAST field trials several issued occured, which caused some minor delays in testing. Increasing wind speeds and wave amplitudes, which lead to unsafe testing conditions, caused the majority of the delays. Two of the five afternoons were postponed due to these worsening weather conditions. There we also a couple of mechanical issues with the lifeboat which delayed the testing procedure. During testing the shear pin, connecting the drive shaft to the
propeller, had failed. Since the lifeboat could no longer operate, testing had to be postponed until the shear pin could be replaced. Another delay occurred when one the participants ran over a buoy, getting it tangled in the propeller. Again testing was postponed until the field trials team could remove the tangled buoy
from the propeller. Although every attempt is made to avoid delays, they are to be expected when performing full-scale field trials in a non-ideal environment.
4 DATA ANALYSIS
The performance data for the VAST field trails was saved in comma separated values (CSV) form. A unique calibration file was then used too import the data from every run into IGOR Pro 6.0, which is a software program used by IOT to analyze data. Once the necessary data was imported into IGOR all of the channels could be displayed, manipulated and analyzed.
A procedure file was used to take the latitude and longitude values from the DGPS data to form two new cannels labelled “Northing” and “Easting”. A
Northing vs. Easting plot was created for the perimeter run showing the outline of the course. The northing and easting data for each of the participant’s six runs were appended to the perimeter graph. This graph showed the path of the lifeboat through the course as well as the location the participant entered and exited the simulated ice field for each run.
A plot was also created for Rudder Angle vs. Time, that showed the changes in rudder angle and the amount of rudder executions performed during the time the lifeboat was in the simulated ice field. Cursors were placed on points between each spike in the data to obtain the change in rudder angle for each rudder execution. The data obtained was then manually inserted into a Microsoft Excel spreadsheet, which calculated the average rudder change for each of the six runs for each participant.
The number of front and side impacts was also measured for each run and the severity of the impacts was recorded in an excel spreadsheet. The video taken during each run of the bow of the lifeboat was used to determine when the impact occurred. The impact loads on the port panel and the craft global loads
were both plotted against time to also determine the locations and severity of impacts.
5 PRELIMINARY RESULTS
The preliminary results for the VAST field trails were obtained using only three participants, one from each of the three groups. The three sets of Data used were from participant 10 (group 3), participant 11 (group 2) and participant 12 (group 1). To keep the assumptions due to weather and waves consistent, the participants chosen to analyze had all completed the course consecutively in the same day. The preliminary results are only based on the performance data of the participants. The human data has not yet been calibrated and converted to a form suitable for analysis.
5.1 Group 1 Results
The preliminary results for group 1 were obtained using the data from participant 12. The DGPS data was used to plot a Nothing vs. Easting graph of the
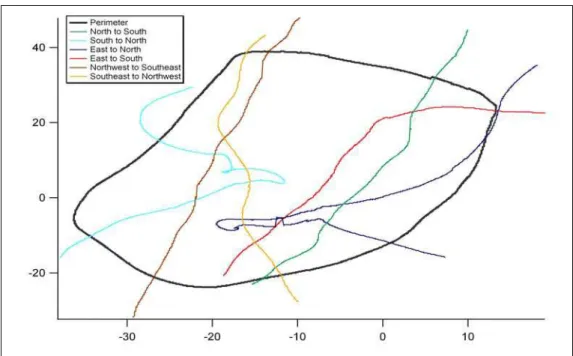
perimeter run completed just before testing. All six runs for participant 12 were appended to the perimeter graph to show the paths taken through the simulated ice field. Figure 6 shows the six paths taken by Participant 12.
Figure 6 –Northing vs. Easting graph of all six runs for Participant 12
It can be seen from the graph that Participant 12 exited the course early on two separate occasions, which is considered to be a fail. The participant exited the course early through the west side during the south to north run, represented by the aqua coloured line on the graph. They also exited the course prematurely through the east side, during the east to north run, shown as the dark blue line on the graph. There are also several spikes and quick direction changes in the east to north and south to north runs. These abrupt changes indicate that the lifeboat had become stuck in one of the obstacles, forcing the coxswain to complete a 180-degree turn to free the lifeboat.
A Rudder Angle vs. Time graph was created to show the changes in rudder angle, per rudder execution, and also the number of rudder executions
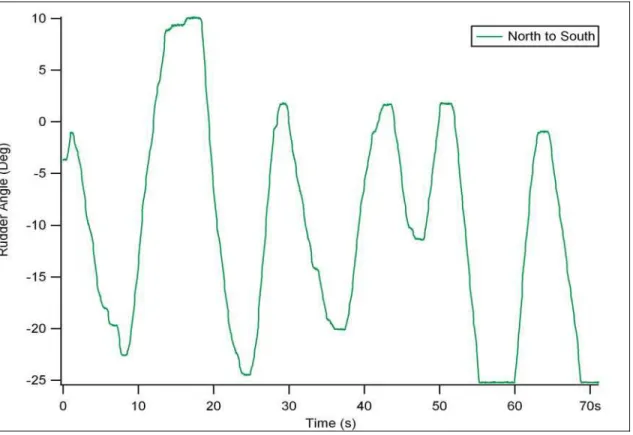
completed during each run. Figure 7 illustrates a Rudder Angle vs. Time graph for a north to south run completed by participant 12.
Figure 7 – Rudder Angle vs. Time graph for Participant 12
The Rudder Angle vs. Time graph illustrates that the participant had completed 11 rudder executions in a 70 second time period. This is a high amount of rudder executions, however the change in rudder angle per execution is quite small, ranging from 12.99 to 33.91 degrees. The majority of the angle changes
completed fall within the 20 to 25 deg range, which is rather low considering the lifeboat has a full range of motion of approximately 40 degrees (20 degrees to port and 20 degrees to starboard). As seen in the graph, there are also no pauses between rudder executions, meaning that the steering wheel was turned from one direction to the other very quickly. These abrupt changes are significant because the lifeboat could not responded fully to one rotation of the steering wheel before another rotation was made in the opposite direction. Therefore in this case, the lifeboat had travelled through the simulated ice field in a relatively straight path although there were many rudder executions completed. The green line in figure 6 displays the path of the lifeboat for the north to south run.
5.2 Group 2 Results
The preliminary results for group 2 were obtained using the performance data from participant 11. The DGPS data was used to plot a Nothing vs. Easting graph of the perimeter run completed prior to testing. All six runs for participant 11 were appended to the perimeter graph to show the paths taken through the simulated ice field. Figure 8 shows the six paths taken by Participant 11.
Figure 8 – Northing vs. Easting graph of all six runs for participant 11
It can be seen from the graph that Participant 11 exited the course through the wrong location during the southeast to northwest run, which is indicated by the orange line. The point of exit should have been on the top left corner of the perimeter, however the participant made a starboard manoeuvre and exited through the top right corner. There are also several spikes and quick direction changes in the east to south run, indicated by the red line on the graph. These abrupt changes indicate that the lifeboat had become stuck in one of the obstacles after impact, forcing the coxswain to complete a 180-degree turn to free the lifeboat. Upon analysis of the remaining runs no other significant impacts
had occurred and the paths of the lifeboat show that more precise rudder executions were completed.
A Rudder Angle vs. Time graph was created to show the changes in rudder angle, per rudder execution, and also the number of rudder executions
completed during each run. Figure 9 illustrates a Rudder Angle vs. Time graph for a north to south run completed by participant 11.
Figure 9 – Rudder Angle vs. Time graph for Participant 11
The Rudder Angle vs. Time graph illustrates that the participant had completed 7 rudder executions in a 70 second time period. The change in rudder angle per execution fluctuates from large changes to small changes, ranging from 10.17 to 40.91 degrees. The majority of the angle changes completed are less than 30 degrees, which is rather low considering the lifeboat has a full range of motion of approximately 40 degrees (20 degrees to port and 20 degrees to starboard). As seen in the graph, there are several short pauses between rudder executions, meaning that the steering wheel was kept steady in one direction for several
seconds before another manoeuvre was executed. The small pauses between rudder executions provided the time needed for the lifeboat to partially respond to the steering change. In this case the lifeboats path through the course consisted of several rudder executions, however the amplitudes of these executions are somewhat small. The green line in figure 8 displays the path of the lifeboat for the north to south run.
5.3 Group 3 Results
The preliminary results for group 3 were obtained using the data from participant 10. The DGPS data was used to plot a Nothing vs. Easting graph of the
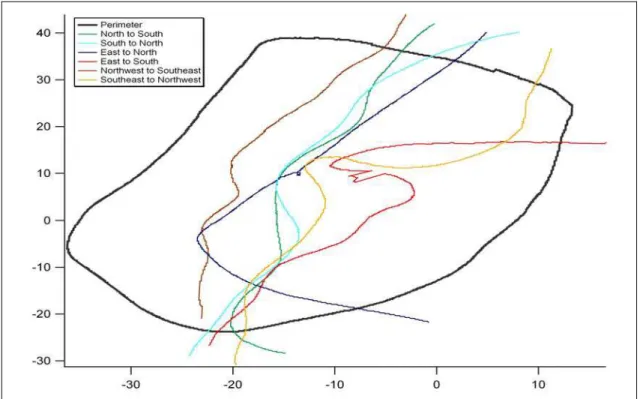
perimeter run completed prior to testing. All six runs for participant 10 were appended to the perimeter graph to show the paths taken through the simulated ice field. Figure 10 shows the six paths taken by Participant 10.
Figure 10 – Northing vs. Easting graph of all six runs for participant 10
The Southeast to northwest run, indicated by the orange line in the northing vs. easting graph, shows that the participant exited the course in the incorrect
location. There are very few straight paths through the simulated ice field
meaning that the participant had made many large rudder executions throughout the six runs. Also, there are no sudden peaks or abrupt turns in the data to signify that there were any large impacts where the lifeboat would get stuck. A Rudder Angle vs. Time graph was created to show the changes in rudder angle, per rudder execution, and also the number of rudder executions
completed during each run. Figure 11 illustrates a Rudder Angle vs. Time graph for a north to south run completed by participant 10.
Figure 11 – Rudder Angle vs. Time graph for Participant 10
The Rudder Angle vs. Time graph indicates that participant 10 completed 6 rudder executions during the 70 seconds the lifeboat spent in the simulated ice field. There are long pauses between almost every rudder execution meaning that lifeboat had time to fully respond to each different turn of the steering wheel. This is important because the lifeboat was able to manoeuvre around obstacles in the simulated ice field and therefore avoid any major collisions. The majority of the rudder angle changes completed are greater than 35 degrees, with exception
to one, which occurred at approximately 55 seconds. It is possible that this small rudder execution is a correction due to an over steer from the previous, much larger rudder execution.
5.4 Comparison
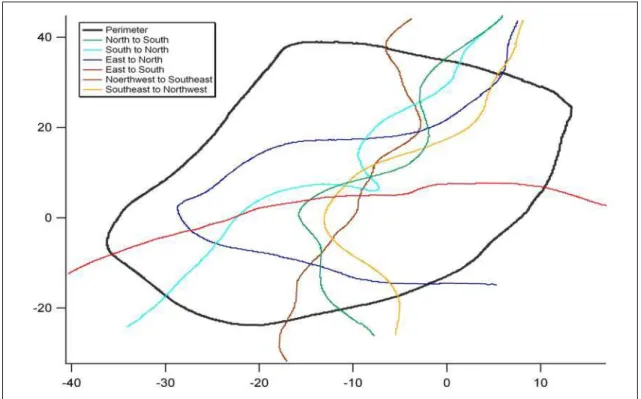
The performance data for a north to south run for participants 10, 11 and 12 were compared to show any major differences between the runs. First a northing vs. Easting graph was created using the DGPS data to append the north to south run for each participant to the perimeter run. Figure 12 shows the north to south runs for participants 10, 11, and 12.
Figure 12 – Northing vs. Easting graph for north to south run
The northing vs. Easting graph, for the north to south runs for each participant, shows some interesting results. The paths taken by the lifeboat through the simulated ice field were slightly different. Also, the movement of the lifeboat for each run was significantly different. The participant from group 1, indicated by the
solid green line, had practically a straight path through the simulated ice field. The participant from group 2, indicated by the dotted blue line, completed several manoeuvres, which were wide and had a large radius. The participant from group 3, indicated by the dashed red line, completed many manoeuvres while in the simulated ice field. The manoeuvres were more precise meaning they had a much smaller radius. The results from this analysis show that the simulator training may have taught the group 3 participants how to properly manoeuvre the lifeboat. The simulator training may have also given them a better feel of how the lifeboat responds to rudder changes.
A rudder Angle vs. Time graph, with data from all three participants, was created to show any major differences between each run. Figure 13 shows the changes in rudder angle for each participant during a north to south run.
The Rudder Angle vs. Time graph shows the number of rudder executions, as well as the change in rudder angle per execution, for all three participants. The participant from group 1 has the most rudder executions, however they also have the smallest average change in rudder angle at only 23.53 degrees. The
participant from group 2 has fewer rudder executions with 7 in total. This participant also has an increase in average rudder angle change compared to that of group 1. Participant 11 has a average rudder angle change of 25.71 degrees which is slightly higher (approximately 2 degrees) than the 23.53
degrees obtained from group 1. The participant from group 3 shows has the least amount of rudder executions, out of all three of the participants, with 6. However the average change in rudder angle per execution has increased significantly compared to the previous groups. The participant achieved an average rudder angle change of 32.91 degrees, which is approximately 7 to 9 degrees higher than groups 1 and 2. Table 2 shows the number of rudder executions and the average change in rudder angle for a north to south run for all three participants.
Change in Rudder Angle Number of Rudder
Executions Group 3 Group 2 Group 1
1 33.87 12.19 21.5 2 43.15 31.16 31.97 3 42.93 38.54 33.91 4 42.97 25.35 26.23 5 4.03 21.66 21.77 6 30.53 40.91 21.67 7 10.17 12.99 8 13.14 9 27.05 10 24.34 11 24.31 Average 32.91 25.71 23.53
6 CONCLUSION
Preliminary examination of the data has shown that there could be possible correlations made between training and the magnitude of impacts while
navigating through the simulated ice field. In future studies, it will be proposed that those who undergo simulation training are less likely to sustain damage to the lifeboat in ice-covered waters. This study has given proof of concept to the examination of simulation training for lifeboat coxswain training. Limitations will be addressed in Phase two, to be completed in Winter 2011, which will include creating a larger field and real ice targets for more realistic impacts. Also,
expanding the training time would be recommended for Phase two. It is expected that with longer training times for both control and simulator groups, participants will have more time to become acquainted with the lifeboat and more
accustomed to the feel and behaviour of the lifeboat. It is hoped that future research will further demonstrate that those who undergo simulator training attempt to navigate more diligently through ice fields.
7 REFERENCES
Aggarwal, R., Black, S.A., Hance, J.R., Darzi, A., & Cheshire, N.J.W. (2006). Virtual Reality Simulation Training can improve Inexperienced Surgeons’ Endovascular Skills. European Journal Vascular Endovascular Surgery, 31, 588-593.
Kewman, D.G., Seigerman, C., Kintner, H., Shu, S., Henson, D., & Reeder, C.(1985). Simulation Training of Psychomotor Skills: Teaching the Brain Injured to drive. Rehabilitation Psychology, 30, 11-27.
Edmonds, D. (1992) Bridging the Gap: The Role of Low-Cost PC Simulators. Lloyd’s Ship Manager Conference: New Manning and Training Strategies.
Patterson, A. (2007) Lifeboat Simulation – The Safe Alternative. Proceedings of the Company of Master Mariners of Canada.
Veitch, B., Billard, R., & Patterson, A. (2008). Evacuation Training Using Immersive Simulators. ISOPE.
Yuan, D., Jin, X., Zhang, J., & Han, D. (2007) Applying Open Source Game Engine for Building Visual Simulation Training System of Fire Fighting. AsiaSim. P. 365-374.