Publisher’s version / Version de l'éditeur:
Vous avez des questions? Nous pouvons vous aider. Pour communiquer directement avec un auteur, consultez la
première page de la revue dans laquelle son article a été publié afin de trouver ses coordonnées. Si vous n’arrivez
Questions? Contact the NRC Publications Archive team at
[email protected]. If you wish to email the authors directly, please see the first page of the publication for their contact information.
https://publications-cnrc.canada.ca/fra/droits
L’accès à ce site Web et l’utilisation de son contenu sont assujettis aux conditions présentées dans le site
LISEZ CES CONDITIONS ATTENTIVEMENT AVANT D’UTILISER CE SITE WEB. Student Report; no. SR-2011-05, 2011-04
READ THESE TERMS AND CONDITIONS CAREFULLY BEFORE USING THIS WEBSITE.
https://nrc-publications.canada.ca/eng/copyright
NRC Publications Archive Record / Notice des Archives des publications du CNRC :
https://nrc-publications.canada.ca/eng/view/object/?id=4847c0f5-7134-4ac0-afc5-b5796ddf63b9 https://publications-cnrc.canada.ca/fra/voir/objet/?id=4847c0f5-7134-4ac0-afc5-b5796ddf63b9
NRC Publications Archive
Archives des publications du CNRC
For the publisher’s version, please access the DOI link below./ Pour consulter la version de l’éditeur, utilisez le lien DOI ci-dessous.
https://doi.org/10.4224/19541698
Access and use of this website and the material on it are subject to the Terms and Conditions set forth at Inertial Measurement Unit (IMU) testing procedure
DOCUMENTATION PAGE REPORT NUMBER
SR-2011-05
NRC REPORT NUMBER DATE
April 2011
REPORT SECURITY CLASSIFICATION
Unclassified
DISTRIBUTION
Unlimited
TITLE
Inertial Measurement Unit (IMU) Testing Procedure AUTHOR (S)
Mitchell Chaulk
CORPORATE AUTHOR (S)/PERFORMING AGENCY (S)
Institute for Ocean Technology, National Research Council, St. John’s, NL
PUBLICATION
SPONSORING AGENCY(S)
IOT PROJECT NUMBER
42-2364-26
NRC FILE NUMBER KEY WORDS
Inertial Measurement Unit (IMU), simultaneous testing, pendulum apparatus PAGES vi, 6, App. A-G FIGS. 4 TABLES SUMMARY
Inertial Measurement Units (IMUs) are electronic devices that return a craft’s angular velocities and translational accelerations. They are used in many industries, such as underwater and aviation robotics.
There is a large variation in IMU cost, and when considering the dependability of different IMUs, generally their manufacturers provide completely different metrics to quantify their performance. Because of this, it is very difficult to decide which sensor has a more reasonable cost-to-performance ratio for any particular project.
To solve this dilemma, research and experimentation at IOT began. First a specialized apparatus was created to mount all IMUs to the same rigid body. MATLAB applications were then written to simultaneously record data from all of the IMUs, while they were experiencing motion. Unfortunately a series of issues continued to occur, and after many trials, it was decided that a solution other than these MATLAB applications had to be designed.
The Data Logger application is data acquisition software written in Java and is designed to be as lightweight and robust as possible. This application was created as a solution to the issues experienced with the formerly mentioned MATLAB applications. Once Data Logger was finished, experimentation was much more simple and the testing could begin again.
ADDRESS National Research Council
Institute for Ocean Technology Arctic Avenue, P. O. Box 12093 St. John's, NL A1B 3T5
National Research Council Conseil national de recherches Canada Canada Institute for Ocean Institut des technologies Technology océaniques
Inertial Measurement Unit (IMU) Testing Procedure
SR-2011-05Mitchell Chaulk April 2011
EXECUTIVE SUMMARY
Inertial Measurement Units (IMUs) are electronic devices that return a craft’s angular velocities and translational accelerations. They are used in many industries, such as underwater and aviation robotics.
There is a large variation in IMU cost, and when considering the dependability of different IMUs, generally their manufacturers provide completely different metrics to quantify their performance. Because of this, it is very difficult to decide which sensor has a more reasonable cost-to-performance ratio for any particular project.
To solve this dilemma, research and experimentation at IOT began. First a specialized apparatus was created to mount all IMUs to the same rigid body. MATLAB
applications were then written to simultaneously record data from all of the IMUs, while they were experiencing motion. Unfortunately a series of issues continued to occur, and after many trials, it was decided that a solution other than these MATLAB applications had to be designed.
The Data Logger application is data acquisition software written in Java and is designed to be as lightweight and robust as possible. This application was created as a solution to the issues experienced with the formerly mentioned MATLAB applications. Once
Data Logger was finished, experimentation was much more simple and the testing could
TABLE OF CONTENTS
LIST OF FIGURES...V
1.0 INTRODUCTION... 1
2.0 TESTING PROCEDURE... 1
2.1 The Pendulum Apparatus ... 1
2.2 Static Tests ... 4
2.3 Dynamic Tests ... 4
2.4 Data Acquisition... 4
2.5 Data Interpretation ... 4
3.0 DATA LOGGING SOFTWARE... 5
3.1 The Data Logger Application ... 5
4.0 CONCLUSIONS AND RECOMMENDATIONS ... 5
5.0 ACKNOWLEDGEMENTS ... 6
LIST OF FIGURES
FIGURE 2-1. THE PENDULUM APPARATUS DESIGN... 1
FIGURE 2-2. THE PENDULUM APPARATUS... 2
FIGURE 2-3. IMUS MOUNTED ON THE RIGID PLATFORM... 3
LIST OF APPENDICES Appendix A: Test Procedure Forms
Appendix B: MATLAB Application Input File Appendix C: MotionPak II Data Sheet Appendix D: 3DM_GX1 Data Sheet Appendix E: AHRS-E304 Data Sheet Appendix F: PHINS Data Sheet Appendix G: MTi Data Sheet
1.0 INTRODUCTION
IMUs (Inertial Measurement Units) can cost anywhere between 10,000$ to 100,000$, and as such it is crucial to find a reliable method for comparing their performance-to- cost ratio. Unfortunately, IMU manufacturers all provide different metrics for
performance. To resolve this issue, IOT has designed their own IMU testing equipment, software, and procedures.
2.0 TESTING PROCEDURE
The basic concept of the IMU testing procedure is to simultaneously record IMU data from all sensors attached to the same rigid platform. These sets of data will be acquired while the platform is stationary (static tests), and while the platform is in motion
(dynamic tests). To perform these tests, the Pendulum Apparatus was created. To see the forms that were used to detail test observations, see Appendix A.
2.1 The Pendulum Apparatus
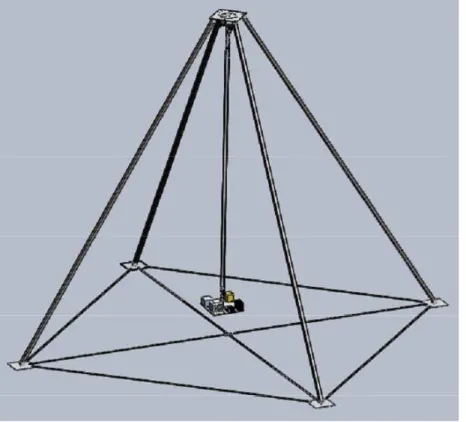
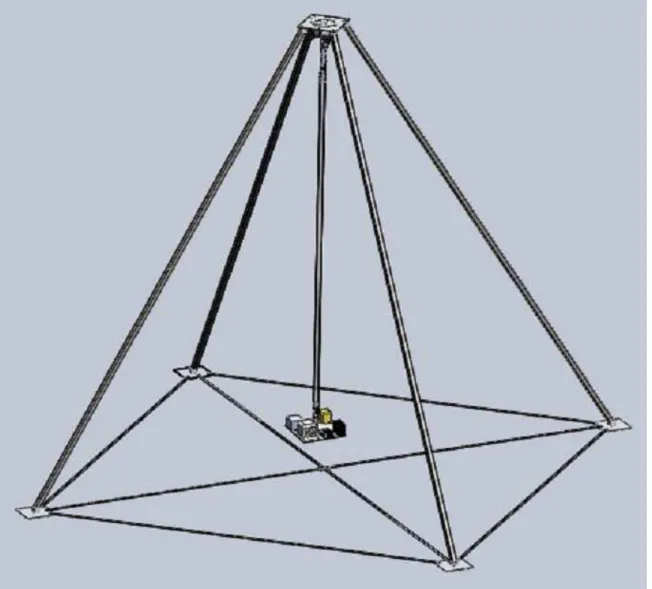
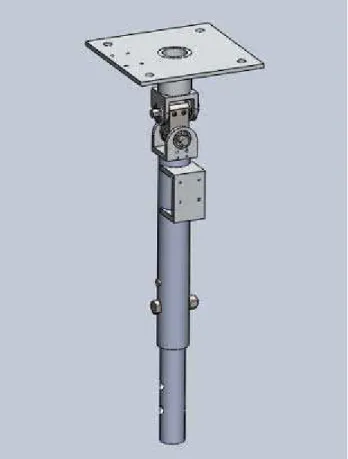
Figure 2-1. The Pendulum Apparatus Design
From Figure 2-1, you can see that the platform, holding all of the IMUs, is located at the base of the pendulum arm. This pendulum has two degrees of freedom, allowing it to swing in the x (surge) and y (sway) directions. Two Trans-Tek angularencoders are located at the top of the arm, accurately measuring the arm’s angle in both directions.
These encoders are used as a means to compare IMU data with the most accurate orientation measurements possible.
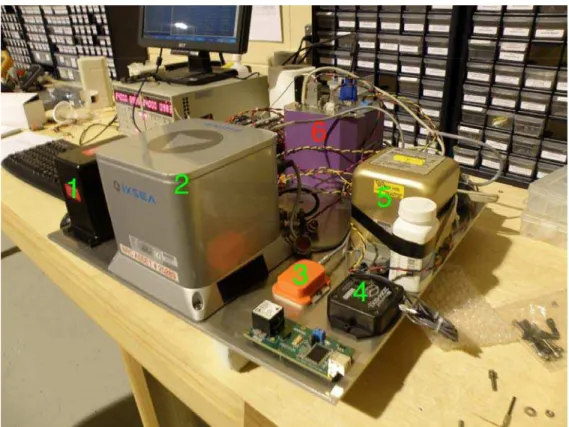
Figure 2-3. IMUs Mounted on the Rigid Platform
Number Manufacturer Model Recorded output
1 Watson AHRS-E304 Seconds, bank, elevation, heading,
translational accelerations, angular velocities, heading rate, magnetometer readings (x, y & z), simulated inclinometer values (x & y), forward velocity, temperature, status bits, and flag bits
2 iXsea PHINS Translational acceleration, angular velocities, roll, pitch, heave, heading, and status
3 Xsens MTi Preamble, bin, mid, length, temperature, translational accelerations, angular velocities, magnetometer readings (x, y & z), roll, pitch, yaw, status, sample, and checksum
4 Microstrain 3DM-GX1 Seconds, roll, pitch, yaw, translational accelerations, rotational velocities, magnetometer readings (x, y & z), and temperature
5 Systron Donner
Inertial
MotionPak II Translational accelerations, rotational velocities, and temperature.
6 Data acquisition computer
Figure 2-3 shows all of the tested IMUs (numbered in green) and the data acquisition computer (numbered in red) mounted on the same rigid body. This is the platform that is attached to the bottom of pendulum arm.
Figure 2-4 defines the labeled IMUs from Figure 2-3. It also makes note of the parameters that were recorded from each IMU during testing. For more information regarding an individual IMU, please see Appendices C – G.
2.2 Static Tests
To perform static tests, the pendulum arm is held stationary for an allotted amount of time. These tests are meant to be longer in duration (between 1 and 8 hours). Their primary purpose is to test for the base drift rates for all of the IMUs. An IMU drift rate describes the rate at which a value returned by an IMU deviates over time, due to some internal error.
2.3 Dynamic Tests
Dynamic tests are done with the pendulum in motion. The platform is raised to a
recorded height, and allowed to swing in an appropriate direction. The tests will stop once the motion of the pendulum is close to being stopped. Since these tests will be shorter in duration, it is important to repeat them once or twice to have sample sizes that are comparable to the static tests. The primary purpose of dynamic tests is to see if the frequency and amplitude of motion has any effect on the drift rate or the output signals which are produced by the IMU.
2.4 Data Acquisition
To simultaneously record data from all of the IMUs, a PC-104 type data acquisition computer is also mounted on the platform. All of the IMUs are attached to the PC via serial ports. Data acquisition applications were originally written for each sensor in MATLAB, but many complications arose and a new piece of software was written in Java. See section 3.0 for details.
The data acquisition applications were designed so that while the tests were being performed, the applications would communicate with each IMU, and record all of the returned data.
2.5 Data Interpretation
Once all of the tests have been performed, and all data has been successfully recorded, it is then necessary to process the information to determine any trends and conclusions. Since each IMU may internally reference a separate direction for x and y, it is necessary to write software capable of rotating each data set to a set of common reference axes. Data will also have to be calibrated to reference the same point of origin. This is to assure a valid comparison of some recorded values, such as translational acceleration
vectors. MATLAB code has been started to handle some of these calibrations, as well as to graph and compare the data sets. Unfortunately this code has not yet been verified for functionality, and is not complete. It may be a good idea to continue developing this application in the future (see section SECTION#).
3.0 DATA LOGGING SOFTWARE
Originally, data acquisition was handled with MATLAB applications that were written for each individual IMU. Independently, these applications generally functioned fine.
However, once all were running simultaneously, they dramatically affected the
performance of the CPU; applications began to crash, and there were communication failures with the serial ports (serial port communication with MATLAB has known issues). A new solution was needed.
3.1 The Data Logger Application
The Data Logger application is software written in Java and was designed to adhere to all recognized faults and weaknesses of the previously existing software:
It references an input file instead of requiring repetitive user input.
It runs as a single application, instead of one program running for each IMU. It is very lightweight and does not limit the CPU’s performance.
No known serial port communication issues exist.
Data Logger is highly extensible and modular so it can be used for any device that interfaces a serial or parallel port.
Data Logger has also been fully documented in “Data Acquisition Software for Port
Interfacing Devices” (Chaulk, 2011). This report will detail all technical aspects of the work done this term including design, creating new modules, technical errors and solutions, as well as conclusions and recommendations for the future.
4.0 CONCLUSIONS AND RECOMMENDATIONS
Some tests have been performed and recorded using the old MATLAB applications. The data sets, photos, and filled out test forms are available on the CD. However, since these tests were done with the old and unreliable data acquisition software, it is
recommended that the tests be performed once more with Data Logger. For technical recommendations for Data Logger itself, see the previously mentioned report entitled “Data Acquisition Software for Port Interfacing Devices” (Chaulk, 2011).
The unfinished MATLAB application, that has been started to process the experimental data, will also be included on the CD. Note that “Analyzer.m” is the main script of the
application. Unfortunately, this code is not well commented but should still hopefully be readable enough to understand. A large portion of the functionality is already handled in this application, but creating a new application may be the best route to continue.
Currently, the application reads an input file (input.txt) and uses it to find the data sets it needs to read and compare, as well as parameters such as:
Recording Precision – Details on how many significant figures to use when reading and writing numbers to files.
Params – Denotes a common name for a list of parameters that may represent that same property, but have different names in their data set headers. For example, acceleration in the x may be denoted as “acc_x” in one header, but “acc_x1” in another.
To see an example of the Analyzer’s input file, see Appendix B.
To continue with this project, resuming the testing process shouldn’t take too long. The majority of time and attention will be needed for calibrating the recorded data sets so that the performance of all the IMUs can be adequately compared.
5.0 ACKNOWLEDGEMENTS
AJ Smith provided guidance with MATLAB and related reference materials. Matt Robbins and David Shea helped with attaching the platform to the
pendulum, before tests.
Dr. Chris Williams and Mr. David Shea provided guidance and leadership for the project, as well as provided clarification on related science and mathematics that I was not familiar with.
6.0 REFERENCES
[1] Mitchell Chaulk (April 2011), IOT-NRC, “Data Acquisition Software for Port Interfacing Devices”.
[2] Thomas House (December 2010), IOT-NRC, “Testing Apparatus for Comparing The Performance of Inertial Measurements Units”.
Appendix A Test Procedure
IMU Testing Procedure
Testing Description and Observation Tables
Author: Mitchell Chaulk Date: January 26th, 2011
Introduction
The enclosed document contains a detailed testing procedure that will yield comprehensive and organized test results for the contrast and comparison of IMU (inertial measurement unit)
sensors. This document will not contain any information pertaining to how to record sensor data, or how to compare any recorded information.
Discussed will be the recommended methods for which to record data for static and dynamic IMU tests. This means tests for motionless sensors, as well as sensors mounted in the previously fabricated motion driven IMU testing apparatus.
Apparatus:
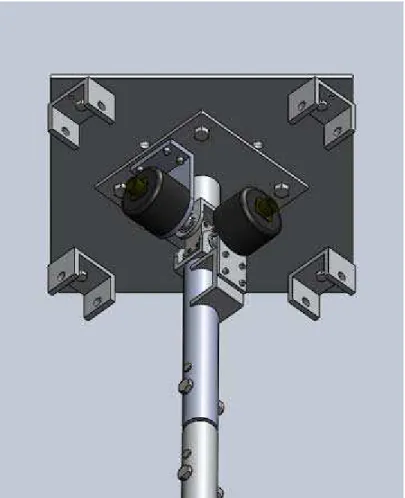
Figure A3. The two-axis pendulum suspension
Figure A4. Layout of the IMUs and data acquisition system
Y-Axis
Notes
An “X Axis” test is defined as the IMU platform swinging along the X axis, as noted in the above diagram. During an “X Axis Test”, the sensor(s) should experience positive acceleration in the X Axis, and negative rotation about the Y Axis (given by the right hand rule). Conversely, as the platform “swings back”, the sensor(s) should experience negative acceleration in the X Axis, and positive rotation about the Y Axis.
Each sensor uses their own naming scheme for axes; pitch, roll, yaw, X, Y, Z, X1, X2, X3, etc. An analysis of the data from each sensor will have to be performed, in order to convert the data from the local “sensor inertial frame” into the “IMU testing frame” (X and Y Axis Acceleration and Rotation)
Platform must have repeatable mounting to the testing apparatus, as “X” and “Y” axis of the pendulum are not the same length, this will ensure repeatability in the testing results. A diagram of the apparatus mounting is shown in the report by Thomas House.
The universal joint design results in different “pendulum arm” lengths for each axis. The X Axis is aligned with the “long arm” of the pendulum The Y-Axis is aligned with the “short arm”.
Therefore, it is expected that the X-Axis Pendulum Period will be longer (in time) than the Y Axis Pendulum Period.
Static Tests
These are "calibration" tests to determine if any sensor experiences a consistent offset, as well as to determine the stability or drift of a sensor’s measurement. Sensors should be placed on the same stationary platform. The tests should have a relatively longer time period than the dynamic tests (around thirty minutes to an hour is recommended).
Dynamic Tests
These tests will demonstrate how each sensor will handle variations in speed and acceleration. They should likely be shorter in duration than the static tests (depending on how long the pendulum will swing), and should perhaps be repeated around 2 or 3 times to
compensate.
Any discrepancies noted from the static tests can, perhaps, be kept in mind while
considering the data logged during the dynamic tests. It is possible that there could be a slightly constant offset for some of the sensors (although not likely). Offsets in IMU data could also exist as some function of the swinging motion's magnitude. This is a reason why dynamic tests should involve a variation in the swinging motion’s amplitude.
File Naming
Naming log files should follow a consistent format so that referencing them can be done as easy as possible. Using italics to indicate a user provided parameter, it is recommended to follow the following naming scheme:
Test-ID-Sensor Name-Current Time-Additional Info For example: Test-001-Xsens-13:15-New potentiometers
*The additional info is merely a suggestion in case there was anything of importance to take note of. It is also recommended that time be indicated using the 24-hour clock.
Static Tests
Test #1
Trial:Test Name: Static Drift Test (short term)
Description: Apparatus is resting “flat” on a rectangular block of blue foam. Data is collected for ~1 hour, in an effort to measure drift rate and noise levels in each sensor. Location: Time Started: Time Stopped: Filename: Photo(s): TestNotes:
Test #2
Trial:Test Name: Fixed Angle Drift Test (x-axis, short term)
Description: Apparatus is resting at ~[ ] degrees in the X Axis on a rectangular block of blue foam. Data is collected for ~1 hour, in an effort to measure drift rate and noise levels in each sensor with a fixed angle.
Location: Time Started: Time Stopped: Filename: Photo(s): TestNotes:
Test #3
Trial:Test Name: Fixed Angle Drift Test (y-axis, short term)
Description: Apparatus is resting at ~[ ] degrees in the Y Axis on a rectangular block of blue foam. Data is collected for ~1 hour, in an effort to measure drift rate and noise levels in each sensor with a fixed angle.
Location: Time Started: Time Stopped: Filename: Photo(s): TestNotes:
Test #4
Trial:Test Name: Static Drift Test (long term)
Description: Apparatus is resting “flat” on a rectangular block of blue foam.. Data is collected for ~8 hours, in an effort to measure drift rate and noise levels in each sensor. Location: Time Started: Time Stopped: Filename: Photo(s): TestNotes:
Test #5
Trial:Test Name: Mounted Horizontal Calibration Test
Description: Apparatus is resting at ~0 degrees in all axis, mounted on the pendulum apparatus. Data is collected for ~1 hour in an effort to measure an offset characteristic of the potentiometers, as well as determine any affect of its environment. Location: Time Started: Time Stopped: Filename: Photo(s): TestNotes:
Test #6
Trial:Test Name: Mounted Fixed Angle Calibration Test
Description: Apparatus is resting at ~[ ] degrees in the [ ] Axis, mounted on the pendulum apparatus. Data is collected for ~1 hour in an effort to measure an offset
characteristic of the potentiometers, as well as determine any affect of its environment. Location: Time Started: Time Stopped: Filename: Photo(s): TestNotes:
Dynamic Tests
Test #7
Trial:Test Name: Sway Test (pendulum swings across the y-axis)
Description: Apparatus is mounted on the pendulum apparatus. Data is collected for ~1 hour, in an effort to compare IMU recordings with more dramatic changes in the recorded information. Any motion in the x-axis should be described in ‘Test Notes’. Location: Drop Height: Time Started: Time Stopped: Filename: Photo(s): Test Notes:
Test #8
Trial:Test Name: Surge Test (pendulum swings across the x-axis)
Description: Apparatus is mounted on the pendulum apparatus. Data is collected for ~1 hour, in an effort to compare IMU recordings with more dramatic changes in the recorded information. Any motion in the y-axis should be described in ‘Test Notes’. Drop Height: Time Started: Time Stopped: Filename: Photo(s): Test Notes:
Appendix B
MotionPak = "C:\Documents and Settings\ChaulkM\Desktop\Tests\test-008-motionpak-936.txt" Phins = "C:\Documents and Settings\ChaulkM\Desktop\Tests\test-008-phins-935.txt"
Watson = "C:\Documents and Settings\ChaulkM\Desktop\Tests\test-008-watson-935.txt" Xsens = "C:\Documents and Settings\ChaulkM\Desktop\Tests\test-008-xsens-934.txt"
Microstrain = "C:\Documents and Settings\ChaulkM\Desktop\Tests\test-008-microstrain-934.txt"
RecordingPrecision = "15"
Params
Time = "timestamp"
MatLabTime = "matlab_time time_matlab timestamp_now" Temp = "Temp temperature"
accX = "acc_x acc_x1" accY = "acc_y acc_x2" accZ = "acc_z acc_x3" gyrX = "gyr_x rot_x" gyrY = "gyr_y rot_y" gyrZ = "gyr_z rot_z" magX = "mag_x" magY = "mag_y" magZ = "mag_z" Roll = "roll inc_x" Pitch = "pitch inc_y" Yaw = "yaw heading"
Appendix C MotionPak II Data Sheet
Appendix D 3DM-GX1 Data Sheet
Appendix E AHRS-E304 Data Sheet
Watson Industries, Inc.
3041 Melby Road Eau Claire, Wisconsin 54703 U.S.A Phone: +1 (715) 839-0628 Fax: +1 (715) 839-8248 e-mail: [email protected] Website: www.watson-gyro.com At t it ude & H ea din g Ref er en c e Syst em
AHRS-E304
D e sc r ipt io n :
The signals from three solid state angular rate sensors are coordinate transformed and then integrated to produce attitude and heading outputs that reflect normal aircraft attitude coordinates. These attitude and heading signals are compared against a triaxial accelerometer and a triaxial fluxgate magnetometer to derive gyro drift error. These errors are filtered over a long time constant and are used to adjust biases in the system so that the long-term
convergence of the system is to the vertical references and the magnetic heading. A velocity input is used to calculate compensations for centrifugal forces and velocity changes on the vertical reference to improve overall stability and accuracy.
This is a microprocessor-based system using a 16 bit A/D converter, a 12 bit D/A converter and an RS-232 interface. The microprocessor has stored parameters for all the sensor inputs to correct bias, scale factor, axis alignment, and others. The analog attitude and heading outputs are updated 71.11 times per second. The serial interface is highly configurable and provides access to almost all operational parameters.
Appl ic a t io n s:
The AHRS-E304 has been used on the land, in the sea and in the air for instrumentation, remote pilot display, stabilization, control and dead-reckoning navigation.
• Solid State, Strap DownSystem
• Low Cost, Low Power • Rugged, High Reliability • VibrationResistant
• Analog and RS-232 Serial Outputs • Interface Software
• PC Heading Calibration
• Display Software
• One Year Limited Warranty • Engineering Support
Appendix F PHINS Data Sheet
Appendix G MTi Data Sheet