Publisher’s version / Version de l'éditeur:
Measurement, 46, 1, pp. 1-15, 2013-01-01
READ THESE TERMS AND CONDITIONS CAREFULLY BEFORE USING THIS WEBSITE. https://nrc-publications.canada.ca/eng/copyright
Vous avez des questions? Nous pouvons vous aider. Pour communiquer directement avec un auteur, consultez la
première page de la revue dans laquelle son article a été publié afin de trouver ses coordonnées. Si vous n’arrivez pas à les repérer, communiquez avec nous à PublicationsArchive-ArchivesPublications@nrc-cnrc.gc.ca.
Questions? Contact the NRC Publications Archive team at
PublicationsArchive-ArchivesPublications@nrc-cnrc.gc.ca. If you wish to email the authors directly, please see the first page of the publication for their contact information.
NRC Publications Archive
Archives des publications du CNRC
This publication could be one of several versions: author’s original, accepted manuscript or the publisher’s version. / La version de cette publication peut être l’une des suivantes : la version prépublication de l’auteur, la version acceptée du manuscrit ou la version de l’éditeur.
For the publisher’s version, please access the DOI link below./ Pour consulter la version de l’éditeur, utilisez le lien DOI ci-dessous.
https://doi.org/10.1016/j.measurement.2012.05.032
Access and use of this website and the material on it are subject to the Terms and Conditions set forth at
State of the art review of inspection technologies for condition
assessment of water pipes
Liu, Zheng; Kleiner, Yehuda
https://publications-cnrc.canada.ca/fra/droits
L’accès à ce site Web et l’utilisation de son contenu sont assujettis aux conditions présentées dans le site LISEZ CES CONDITIONS ATTENTIVEMENT AVANT D’UTILISER CE SITE WEB.
NRC Publications Record / Notice d'Archives des publications de CNRC:
https://nrc-publications.canada.ca/eng/view/object/?id=cc5c29ab-c163-48db-b879-ef23568426b7 https://publications-cnrc.canada.ca/fra/voir/objet/?id=cc5c29ab-c163-48db-b879-ef23568426b7
State of the Art Review of Inspection Technologies for
Condition Assessment of Water Pipes
Zheng Liu1,∗, Yehuda Kleiner
National Research Council Canada
Abstract
This paper reviews the state-of-the-art of inspection techniques and technologies to-wards condition assessment of water distribution and transmission mains. Pipe con-dition assessment is the determination of its current concon-dition, including structural health, impact on water quality, and hydraulic capacity. The collection and analysis of relevant data and information is the first and a paramount step to detect and monitor critical indicators to prevent or mitigate catastrophic failures. The technologies include conventional non-destructive inspection and advanced sensor techniques for condition monitoring. This paper focuses on the inspection techniques and technologies for struc-tural deterioration of water pipes. Technologies like smart pipe, augmented reality, and intelligent robots are also briefly discussed and summarized.
Keywords: Pipe condition assessment, distress indicator, deterioration,
non-destructive inspection.
1. Introduction
The structural deterioration of water mains and their subsequent failure are com-plex processes, which are affected by many factors, both static (e.g., pipe material, size, age, soil type) and dynamic (e.g., climate, cathodic protection, pressure zone changes). Condition assessment is critical to the management and maintenance of water trans-mission and distribution systems. The physical mechanisms that lead to pipe breakage are often very complex and not completely understood. The facts that most pipes are buried, and relatively little data are available about their breakage modes contribute to this incomplete knowledge.
The US EPA defines pipe condition assessment as “the collection of data and infor-mation through direct and/or indirect methods, followed by analysis of the data and information, to make a determination of the current and/or future structural, water
∗Corresponding author
Email addresses: zheng.liu@nrc-cnrc.gc.ca(Zheng Liu), yehuda.kleiner@nrc-cnrc.gc.ca (Yehuda Kleiner)
1Tel: 1 (613) 993-3806, Fax: 1 (613) 993-1866
quality, and hydraulic status of the pipeline”. The assessment of the structural condi-tion of water mains and decision making on pipe renewal involves several elements [1]:
• Inspection of the pipe to discern distress indicators.
• Interpretation of distress indicators to determine pipe condition.
• Empirical/statistical modeling of historical failures (mainly in small-diameter dis-tribution mains).
• Development of pipe deterioration models, which in conjunction with knowledge about pipe current condition will enable the forecast of future failure rates and consequent pipe residual life.
• Physical/mechanistic modeling of the pipe in the soil.
• Understanding of pipe failure modes and their associated frequencies, including observable or measurable signs that point to these modes and to potential exis-tence of deterioration mechanisms.
• Assessment of failure consequences.
• Scheduling pipe renewal so as to minimize life-cycle costs while meeting or ex-ceeding functional objectives of water distribution (quantity, quality, reliability, etc.).
A distress indicator is defined as the observable/measurable physical manifestations of the aging and deterioration process [2]. Each distress indicator provides partial evidence for the condition of specific pipe components, which varies with pipe materials. Distress indicators can be acquired by various means, as described in the following section. An inferential indicator refers to the potential existence of a pipe deterioration mechanism without actual knowledge if this potential has actually been realized. Many of the environmental indicators, such as soil type, groundwater fluctuations, etc., are inferential in nature. The inferential indicators do not provide direct evidence about pipe deterioration but rather indicate the potential thereof. These indicators and means to acquire them are also discussed in the next section.
A review of sensor technologies for buried sewer inspection was published by Duran et al. in 2002 [3] and relevant information is also available in other reports [4, 5, 6]. Our paper reviews the state-of-the-art technologies for water main inspection and detection of structural deficiencies. This paper focuses on pipe inspection technologies, while a companion paper provides a review of advanced sensor technology for pipe condition monitoring [7].
Condition assessment methods can be roughly categorized into direct and indirect methods [8]. Direct methods include automated/manual visual inspection and non-destructive testing. Pipe sampling is also included in this category. Indirect methods include water audit, flow testing, and measurement of soil resistivity, etc. to determine
Table 1: Summary of Condition Assessment Technologies Applicable to Different Pipe Materials (see footnote 1, 2, and 3).
Technology
Metallic Pipes Concrete Pipes Poly Pipes
CI, DI, WS CPP/PCCP, AC GRP, PVC/uPVC, PE Pit depth measurement √ × ×
Visual inspection √ √ ? Electromagnetic inspection √ √ × Acoustic inspection √ √ √ Ultrasonic testing √ × ? Radiographic testing √ × × Thermographic testing √ × × pipe condition assessment from
soil properties
√ ? ?
Other sensor technologies √ √ ?
1√
: available; ?: may/may not work; ×: does not work.
2
CI: cast iron, DI:ductile iron, WS: welded steel, CPP/PCCP: concrete pressure/pre-stressed concrete cylinder, AC: asbestos cement, GRP: glass-fiber reinforced polyester, PVC/uPVC: polyvinyl chloride/un-plasticized PVC, PE: polyethylene.
3
More detailed information about the applicability of each type of sensor for different pipes is not available.
the risk of deterioration. Generally, the direct methods generate the pipe distress indi-cators while the inferential indiindi-cators are obtained by indirect methods. Table 1 shows the potential to apply an inspection technology to different pipe materials. Detailed descriptions of these methods are presented in the following section.
2. Direct Methods for Pipe Inspection
2.1. Visual Inspection
2.1.1. Closed-circuit television (CCTV) inspection
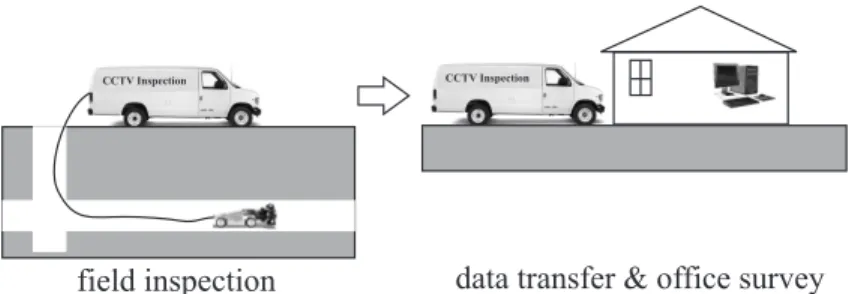
Closed-circuit television is a well-adopted technique for the inspection of the pipe’s inner surface. CCTV inspection is mainly applied to sewers and stormwater pipes. For the inspection of water pipes, CCTV is commonly used for water main rehabilitation. A CCTV system comprises of a CCTV camera and lighting apparatus mounted on a carrier. A winch and pulley system moves the CCTV module through the pipe. Larger modules can use an umbilical cord system, which can supply power and communication to the control center and act as a retrieval device. The basic steps for a CCTV survey include:
• Introduce a carrier with the CCTV camera into the pipe via an access point; • Operate the carrier to travel along the pipe and the camera captures and transmits
the video to ground station (inspection truck);
• Transfer data from inspection truck to office computer; • Do the survey in the office.
The traditional CCTV technique has its own limitations. It needs pan and tilt to see sides and laterals. To ensure an acceptable video quality, the carrier speed is limited to 15 cm/s. The camera has to stop at each location to identify defects.
Figure 1: The work flow of CCTV inspection.
Side scanning evaluation technology (SSET) provides both frontal and 360 degree images of the interior surface of the pipe wall [9]. Two cameras capture a forward view and a perpendicular view of pipeline respectively. The SSET system can travel through a pipeline at a constant speed without stopping to observe defects. Pan or tilt camera is not needed. One key benefit of the SSET is that it allows data comparison from one year to the next.
The PANORAMO optoscanner uses two integrated scanning units, one at the front end and one at the rear end [10]. Each consists of a 186 degree fish-eye lens and a high resolution digital camera. The two units take hemispherical images and create 360 degree spherical images. An unfolded two-dimensional view of the entire section as well as a three-dimensional view of the pipe allow the viewer to pan the angle of view in all directions. This survey can be done off-line in the office without actually operating the camera during the inspection. The operator can pan and rotate a virtual camera like a real one. Another advantage of the PANORAMO system is that it can operate at a higher speed of 30 cm per second.
Several CCTV systems are commercially available. The interpretation of inspection results is currently done manually but in the future machine-vision techniques are likely to be developed. In the office, defects/deficiencies can be coded, assigned scores and aggregated to provide the overall condition of the pipe.
2.1.2. Laser scan
Distance measurement by laser can be done using one of four principles, including triangulation, time-of-flight, pulse-type time-of-flight, and modulated beam systems. In a triangulation system, the detecting element measures the laser spot within its field of view. Usually, this type of laser measurement is used for distances around ten centimeters (a few inches). Time of flight sensors derive range from the time it takes light to travel from the sensor to the target and back [11]. This technology is typically used for relatively long distance measurements. For very long distances, a pulsed laser beam is used. A modulated beam system also uses the time duration for light to travel to the target and back; however, in this case, time is not measured directly. Instead, the strength of the laser is varied to produce a signal that changes over time. The time delay is indirectly discerned by comparing the signal from the laser with the delayed signal returning from the target. Modulated beam sensors are typically used in intermediate range applications.
beam. Such a laser range measurement does not require any special illumination and can be carried out in complete darkness. The speed of spinning, sampling rate, and carrier moving velocity determine the resolution and affect the accuracy of the scanning. The inspection is affected by the roughness as well as the color of the pipe surface.
Another method is based on structured light, which makes use of a ring of laser light projected onto the pipe inner surface [3]. A detecting camera is used to capture the images of this projected ring. The laser device moves with the camera through the pipe. Analysis software extracts the shape of the laser ring from captured images and reconstructs a digital pipe profile. This profile can be easily unfolded or manipulated for review and analysis. The measurement for diameter, perimeter, and cross-sectional area is accurate if both the camera and laser are properly set. However, “depth” information is missing [12].
A portable device, which is a combination of laser and stereo vision, has been demon-strated for fast creation of surface profile with high resolution [13]. By tracking the laser beam (pattern) and positioning targets (marks on the surface to match images), sepa-rate images acquired by the two cameras are stitched together with the help of special software.
Currently available laser profiling systems are only used in de-watered pipes. To date there is no known report on underwater laser profiling for in-service water mains. The laser profiling is accurate, but still needs data processing to compensate for errors introduced during scanning. Report on performance study is not available.
2.2. Electromagnetic Methods 2.2.1. Magnetic flux leakage (MFL)
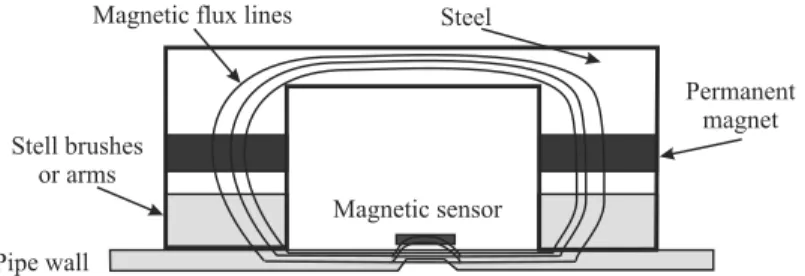
The magnetic flux leakage method uses large magnets to induce a saturated magnetic field around the wall of a ferrous pipe. If the pipe is in good condition, a homogeneous distribution of magnetic flux is obtained. Anomalies such as metal loss will alter the distribution of the magnetic flux. The damaged areas can not support as much magnetic flux as undamaged ares, resulting in an increase of the flux field at the damaged areas [4]. In other words, the damaged areas cause a change in magnetic reluctance in the closed magnetic circuit resulting in a change in the amount of flux leakage into the air. Such flux leakage is recorded by a magnetic sensor as shown in Fig. 2.
Figure 2: The principle of magnetic flux leakage testing.
The MFL test needs to be calibrated to interpret the acquired data for pipe wall thickness measurement. In order to discern defect’s depth in rolled steel water pipeline,
a pulsed excitation for MFL was suggested in [14] because more information is available from the response of a wider frequency band. However, the use of MFL in water industry is limited to cleaned, unlined pipes and also requires accessibility to the pipes’ exterior. The pulsed excitation for MFL has been developed to extract depth information of defects in rolled steel water pipeline [14].
2.2.2. Remote field eddy current (RFEC)
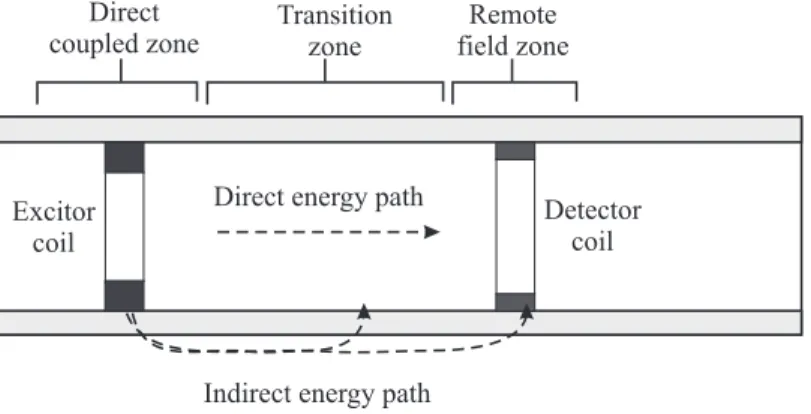
A remote field eddy current system consists of an exciting coil and one or more detectors. The exciting coil is driven by a low-frequency alternating current signal. The interaction region is divided into three zones as shown in Fig.3 [15, 16]:
• Direct coupled zone: magnetic field from the exciting coil interacts with the pipe wall to produce a concentrated field of eddy current;
• Transition zone: there is interaction between the magnet flux from the exciting coil and the flux induced by the eddy current;
• Remote field zone: this is the region in which direct coupling between the exciting coil and the receiver coil is negligible.
Two distinct coupling paths exist between the exciter and detector. The direct elec-tromagnetic field inside the pipe is attenuated rapidly by circumferential eddy currents induced in the conducting pipe wall [16]. The indirect field diffuses radially outward through the pipe wall. This field spreads rapidly along the pipe with little attenuation. These two fields re-diffuse back through the pipe wall and are dominant at the remote field zone. Any discontinuities in the indirect path will cause changes in signal magni-tude and phase. This technology does not require the sensors to be in close contact to the pipe wall.
Figure 3: The principle of remote field eddy current testing.
Prestressed concrete cylinder pipes (PCCP) have two metallic elements, namely a steel cylinder and steel prestressing wire that is wrapped tightly around the core concrete to provide it with resistance to tensile stresses. Both metallic elements interact with the induced magnetic field. The interaction between the indirect transmission path and the prestressing wire is known as transformer coupling (TC). Thus, the received
signal consists of two components, a remote field component and a transformer coupling component. The presence of broken wires will reduce the response of the transformer coupling component, thus allowing their detection. This technique requires a highly skilled person to analyze and interpret the amplitude and phase signals. The amplitude represents the strength of the transmitted signal while the phase represents the time that the signal takes to arrive at the detector [16, 5].
The commercial RFEC/TC and P-Wave systems are widely used for detecting bro-ken wires in prestressed concrete pipes [16, 5]. The See Snake tool is applied to small-diameter ferromagnetic pipes [17]. The PipeDiver RFEC tool can be used to inspect large-diameter ferromagnetic pipes. Proprietors do not publish information about re-liability and performance; however, RFEC seems to be the prevailing technology in the drinking water industry for inspection of ferromagnetic pipes and ferromagnetic components in composite pipes.
2.2.3. Broadband electromagnetic (BEM)
Unlike the conventional eddy current technique, which uses a single frequency for testing, the broadband electromagnetic technique transmits a signal that covers a broad frequency spectrum ranging from 50 Hz to 50 kHz [18]. A transmitter coil passes an alternating current to the pipe surface, which generates an alternating magnetic field. Flux lines from this magnetic field pass through the metallic pipe wall, generating a voltage across it. This voltage produces eddy currents in the pipe wall, which induce a secondary magnetic field. Wall thickness is indirectly estimated by measuring signal attenuation and phase delay of the secondary magnetic field. BEM technology has been primarily used for condition assessment of water mains. It can only be used on ferrous materials to measure wall thickness, quantify graphitization, and locate broken wires in PCCP [19].
Commercial BEM system and hand-held tool based on the same principle is are available from the same technology vendor to measure corrosion pits. The BEM sys-tem is being further modified to facilitate the inspection of pipes exposed in keyhole excavations. This will help acquire information about pipe condition without disrupting service or full access excavations.
2.2.4. Pulsed eddy current (PEC) testing
Pulsed eddy current is a method to determine wall thickness of insulated and non-insulated steel pipelines by external inspection [20]. A rectangular shape eddy current is generated by a transmitter coil. Each cycle consists of one positive and one negative pulse. The strength of the eddy currents is measured at some distance from the pipe wall (e.g., due to lift off or insulation thickness) by quantifying the magnetic reaction field picked up by the receiver coil [20]. The strength is related to wall thickness. The average thickness of the metal is computed by comparing the transient time of certain signal features with similar calibrated signals [20]. The contact between the magnetic field and the inspected component produces a footprint that represents the area inspected for wall thickness calculation. The diameter of the footprint varies between 25 and 150 mm, depending on wall thickness, insulation thickness and sensor size. The inspection tool is compact and can be easily deployed by remotely operated vehicles. Commercial PEC
system has been used for inspection of insulated pipe/vessels in chemical plants and the oil and gas industry [21].
2.2.5. Ground penetrating radar (GPR)
Ground penetrating radar antennae transmit electromagnetic wave pulses into the ground. These pulses propagate through the ground and reflect off sub-surface bound-aries. The reflections are detected by a receiving antenna and subsequently inter-preted [22]. Significant work needs to be done to process GPR data and signals.
Conventional GPR systems are operated from the ground surface. In-pipe GPR systems were also reported [22]. Such systems use two or three antennae with different frequencies to investigate the structure of the surrounding soil, the interface between the soil and pipe, and the structure of the pipe. GPR can potentially identify leaks in buried water pipes either by detecting underground voids created by the leaking water or by detecting anomalies in the depth of the pipe as the radar propagation velocity changes due to soil saturation with leaking water [23]. The GPR technique was also applied to determine the degree of internal leaching of hydroxides in asbestos-cement (AC) pipes [24].
Conventional GPR systems are commercially available. A prototype ground pene-trating imaging radar (GPIR) was recently developed within a European Commission supported project “WATERPIPE” [25]. This high resolution GPIR is designed to de-tect leaks and image damaged regions in pipes. The capabilities of this high resolution GPIR reportedly include:
• Locate water pipe of all types of materials;
• Detect leaks and damages in water pipelines of all types of materials; • Penetrate the ground to a depth of up to 200 cm;
• Achieve an image resolution of less than 50 mm; • Survey velocity at approximately 0.36 km/hour.
The measurement results currently available were obtained in a laboratory environ-ment. The inspection results were used to assess the structural reliability, leakage, and conformity to water quality standards of the pipes [25].
2.2.6. Ultra-wideband (UWB) pulsed radar system: P-Scan
The P-Scan is based on UWB antennae capable of transmitting and receiving elec-tromagnetic pulses in the nano-and pico-second ranges [26, 27]. For the inspection of buried pipes, it is desirable to operate in the picosecond range because pulse widths in this region are equal to or less than the wall thickness of most non-ferrous buried pipes. The pulse repetition frequency (PRF) ranges from thousands to several billion pulses per second. Numerical experiments demonstrated the potential of this technique for pipe condition assessment [26]. The use of ultra-short duration pulses makes it possible to obtain relatively high resolution results. Numerical simulation for P-Scan has been carried out and a pre-commercial prototype is still under development and not available yet.
2.3. Acoustic Methods
2.3.1. Sonar profiling system
Sonar is an acoustic detection technology designed to operate under water. In the pipe inspection field, it has been adapted to provide information about elements in the pipe that are submerged below the water line. These may include submerged debris in the pipe (sewers), grease level (sewers), differential settling and other submerged deformations and defects. A sonar system may consist of an underwater scanner unit, collapsible sonar siphon float, sonar processor/monitor, skid set, and all necessary in-terconnect cables [28]. It typically travels in the pipes at velocities in the range of 0.1 to 0.2 m/s and sends a pulse about every 1.5 s. Each pulse provides an outline of the cross-section of the submerged part of the pipe [28]. Accurate measurements can be performed based on these outlines.
The sonar profiling system can be used with different frequencies to achieve different goals [29]. High frequency sonar can provide a higher resolution scan but a high resolu-tion pulse attenuates quickly and therefore has a relatively low penetraresolu-tion capability. In contrast, low frequency sonar has a high penetration capability but is limited in its scanning resolution. Consequently, whereas high frequency sonar can be suitable for clear water conditions, turbid water with high concentrations of suspended solids may require a lower frequency signal. Small defects are more likely to be observed by a high frequency signal. Some systems are capable of a multi-frequency scan to obtain maxi-mum information. A system that integrates sonar and video for use in submerged and large semi-submerged pipelines is also available. The cost of sonar inspections varies depending on the diameter of the pipe to be inspected.
2.3.2. Impact echo
Impact echo testing is based on the use of impact-generated stress waves that prop-agate through and are reflected by the object under test. The impact echo equation is [30]:
T = V 2Fp
(1)
where: T is thickness, V is wave speed and Fp is peak frequency.
The time domain test data of the impulse hammer and accelerometer are trans-formed to the frequency domain as illustrated in Fig. 4. A transfer function is com-puted between the hammer and receiver as a function of frequency. Peaks in the transfer function reflect the effective thickness of the pipe wall at the test location. A more com-plicated model would be required to discern other properties of the object under test from frequency responses.
Impact echo is typically applied to concrete, stone, plastic, masonry materials, wood and some ceramics. Various instruments are commercially available. Testing is con-ducted by hitting the test surface at a given location with a small instrumented impulse hammer or impactor and recording the reflected wave with a displacement or accelerom-eter sensor adjacent to the impact location [31]. The acceleromaccelerom-eter is usually mounted to or pressed against the test surface. Frequency domain analysis is complicated when
Figure 4: The principle impact echo testing.
information other than thickness and geometry is needed and experience is required. Embedded items may affect wave behavior and test results. This method is not limited by pipe size and can be applied both internally and externally only if the testing is executable.
2.3.3. SmartBall
SmartBall, a commercially available system, comprises a range of acoustic sensors, as well as an accelerometer, magnetometer, ultrasonic transmitter, and temperature sensors [32]. It travels with the water flow down a pipe and detects, locates, and estimates the magnitude of leaks as it rolls. All the sensors are encased in an aluminum alloy core with a power source and other electronic components [33, 32]. The core is encapsulated inside a protective outer foam shell or sphere. The outer foam shell provides additional surface area to propel the device and also eliminates the noise that the device might generate while traversing the pipeline. The diameter of the outer sphere depends on the pipe diameter and flow conditions.
The SmartBall is deployed into the water flow of a pipeline and captured at a down-stream point. It continuously records acoustic data and emits an acoustic pulse every 3 seconds for tracking purpose, while the device traverses the pipeline. A SmartBall acoustic receiver, which is a patented technique, is used to track the location of the device. The above-ground markers can be placed at 2 km intervals and leak locations can be determined within 1 meter. The recorded acoustic data are analyzed to identify air pockets and leaks. Air pockets and leak locations are determined using the other sensors attached to the SmartBall, e.g. accelerometer, temperature and pressure sen-sors. The severity of leaks is estimated by calibrated baseline data. Frequency analysis needs to be carried out to confirm that an acoustic anomaly is actually a leak.
SmartBall is a relatively new technology and has seen significant entry into the mar-ketplace. Further development of SmartBall technology for nature gas pipeline
applica-tions was supported by research funding from the U.S. Department of Transportation Pipeline and Hazardous Safety Administration [34].
2.3.4. Sahara system
The Sahara system uses a hydrophone tethered to an umbilical cable, which travels inside in-service water mains, to record leak noises [22, 35]. A locator beacon can be tracked on the surface, enabling leaks to be marked for excavation and subsequent repair [36]. Sahara locates leaks through identifying the distinctive acoustic signals generated by leaks in the pipe wall, the joints or steel welds. The magnitude of the leaks can also be estimated from the acoustic signal [36]. Gas pockets in the pipeline are also detected by their unique acoustic signature.
A video and lighting sensor is also available on the Sahara platform to provide CCTV inspection of in-service potable water pipelines. Wastewater force mains have also been successfully inspected by flushing the line with clean water during the inspection. An average wall thickness calculation across set intervals of pipe (typically 9 m/30 ft) is also offered based on speed of sound measurements taken with the Sahara system.
2.3.5. Leak detection
As illustrated in Fig. 5, the LeakFinderRT system is composed of leak sensors, a wireless signal transmission system, and a personal computer. Acoustic sensors, such as accelerometers or hydrophones, are attached to two contact points on the pipe, such as fire hydrant. Accelerometers are used to sense leak-induced vibration while hydrophones are used for sensing leak-induced sound in the water column. Accelerom-eters are sensitive to background noise and hydrophones are often used together with accelerometers to achieve a better signal to noise ratio. The computer calculates the cross-correlation function of the two leak signals to determine the time lag τmaxbetween the two sensors. Then the location of the leak can be derived from the equations below:
L1 = D − cτmax
2 (2)
L2 = D − L1 (3)
L1 and L2 are the positions of the leak relative to sensors 1 and 2, respectively; c is the propagation velocity of sound in the pipe; D is the distance between location 1 and 2. Propagation velocity needs to be determined experimentally or is estimated based on the type and size of the pipe.
LeakfinderRT uses an enhanced cross-correlation function that is calculated in-directly in the frequency domain using the inverse Fourier transform of the cross-spectral density function rather than using the shift-and-multiply method in the time domain [37]. The enhanced correlation function provides improved resolution for narrow-band leak signals. This is very helpful for plastic pipes (low frequency sound emission), small leaks, multiple leaks and situations with high background noise. Moreover, a major advantage of the enhanced function is that it does not require the usual filtering of leak signals to remove interfering noises [37].
Figure 5: The principle of LeakFinderRT for leak detection [37].
Based on principles similar to LeakfinderRT, a technique, “Wall Thickness Finder” was developed to estimate the average pipe wall thickness between two listening points on the pipe [38]. The average thickness of the pipe section between two acoustic sen-sors can be back calculated from a theoretical model, which incorporates the acoustic velocity, pipe diameter, Young’s modulus of the pipe wall, and the bulk modulus of elas-ticity of water [38]. Velocity measurement can be performed with the same hardware as LeakfinderRT by using the cross-correlation method.
Signals from leak sensors can be transmitted wirelessly to a computer for processing. Leak sounds are recorded and correlated by LeakfinderRT in a few minutes under most circumstances, but noisy records can take longer to process. The cross-correlation results are displayed on screen and are continuously updated in real time while leak signals are being recorded.
2.4. Ultrasound Methods 2.4.1. Guided wave ultrasound
The guided wave ultrasound technique is based on the capability of propagating a wave for a long distance [39]. The name of a guided wave depends on the struc-ture type and how energy is transmitted through the strucstruc-ture. Torsional waves travel via a shearing motion parallel to the circumferential direction. The attenuation by water and coatings is less for shearing motion. Longitudinal waves travel via flexu-ral/compressional motion in the radial and axial directions and can be easily affected by water and coatings. Depending on the type of guided wave, the number of trans-ducers can range between two and four. Torsional waves require two transtrans-ducers while longitudinal waves require three to four transducers. The torsional guided wave trans-ducers operate in a pulse-echo configuration where the transtrans-ducers are used for both excitation and detection of the signals. Torsional or longitudinal guided waves are in-duced into the pipe and propagated along the length of the pipe segment. A torsional wave system can be used in pipes filled with water while the longitudinal system can-not. In a longitudinal system, three transducers can only operate on a single frequency. Multiple frequencies can be applied if four transducers are used; this arrangement leads to an improved inspection result.
reflect back to the transducer’s original location. The time-of-flight for each signature is calculated to determine its distance from the transducer. The amplitude of the signature determines the size significance of the defect.
A probe in the form of a ring array of piezoelectric transducers is clamped around the pipe and an ultrasound is sent simultaneously in both directions along the pipe (Fig. 6 top). The acquired signal is similar to conventional ultrasound testing (UT) A-scans. The horizontal axis represents the distance along the pipe while the vertical axis represents signal magnitude, which can be used to characterize metal loss due to the corrosion. This technique is suitable for pipes above 50 mm in diameter and wall thicknesses up to 40 mm. Inspection for an elevated pipe can be conducted for a range of up to 30 m in either direction from a specific spot where the probe is placed.
Figure 6: The ultrasound testing: (top) guided wave ultrasound testing and (bottom) discrete ultra-sound testing.
The guided wave system was originally designed for use on above-ground exposed or insulated pipes. It has been applied to buried pipes, but the range of inspection will be shorter due to the rapid attenuation of the signals. The use of non-contact and couplant-free electromagnetic acoustic transducer (EMAT) was also reported [40]. The commercial system is available from many vendors and consulting companies.
2.4.2. Discrete ultrasound
Discrete ultrasonic measurement transmits a high-frequency short wave through a couplant to the material being tested (see Fig. 6 bottom). The wave can be generated by several methods, including piezoelectric ceramics, electromagnetic acoustic transducer, magnetostrictive sensor, laser and piezoelectric polymers. The waves propagate to the back wall of the specimen and are reflected back towards the transducer. Transition time is recorded and used in combination with the velocity of the wave propagating in the material to compute the travel distance of the wave. Materials with known thicknesses are used to calibrate the sensor.
A typical UT system consists of a pulser/receiver, transducer, and display unit. Driven by the pulser, the transducer generates a high frequency ultrasonic energy that propagates through the materials in the form of waves. When an object is encountered in its path, part of the energy is reflected back from the object’s surface. The reflected wave is transformed into an electrical signal, from which information on the reflector’s
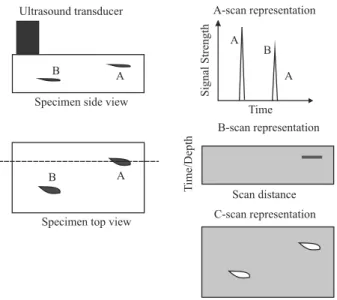
location, size, orientation, and other features can be inferred. Types of ultrasonic system displays include:
• A-scan: discontinuity depth and amplitude of signal;
• B-scan: discontinuity depth and distribution in cross sectional view; • C-scan: discontinuity distribution in plain view.
The three types of UT signal representation are illustrated in Fig. 7.
Figure 7: The representation of UT signals.
UT inspection of pipes can be done both externally and internally. Usually, UT inspection needs couplant or water to transmit the wave between the transducer and the pipe wall. However, the electromagnetic-acoustic transducer (EMAT) does not need couplant. The UT system is available from many companies.
2.4.3. Phased array technology
For conventional UT, the shape of a sound beam and its travel direction are fixed for each sensor. An array transducer contains a number of individual elements in a single housing. With phased array technology, it is possible to program virtual sensor arrangements, which can send sound beams with different characteristics and in differ-ent directions, i.e. the aperture, shape, and direction of the ultrasound beam can be controlled [41]. The central elements of this technology are arrays built up of composite sensor elements that are controlled individually by the ultrasound electronics [41]. A set of neighboring composite sensor elements is triggered simultaneously. The sound beam and its direction are determined by how the composite sensor elements are triggered.
Phased arrays use an array of sensor elements, all individually wired, pulsed, and time shifted [42]. The elements can be organized as a linear array, a two-dimensional matrix array, a circular array or in other more complex forms. Any set of sensor elements
Figure 8: Sound beams generated by phased array of composite sensor elements [41].
can be used as a virtual sensor. For instance, a virtual wall thickness measurement sensor can be built up by a group of composite sensor elements. If these elements are triggered simultaneously, a sound beam perpendicular to the wall surface is generated, as illustrated in Fig. 8. If the neighboring elements are triggered with a certain time shift from element to element, an angular sound beam is generated. A virtual crack detection sensor comprises a group of such sensor elements. The major advantage of the phased array technology is its capability on interpreting complex defects, such as discrimination between cracks and metal loss, and identification of hook cracks [41]. The technical features of phased array ultrasonic technology include [43]:
• Multiplexing of a large number of identical crystals as a single probe; • Control of the focal depth;
• Control of the steering angle; • Control of the beam width;
• Program of the virtual probe aperture; • Scan with a large number of A-scans;
• Display of the UT data in a generic view named S-scan.
The phased array UT is commercially available and continually undergoing further development, but the application to water mains has not been reported yet.
2.4.4. Combined UT inspection
A combined UT technique, which can simultaneously quantify metal loss and detect cracks, was reported in [44]. This technique uses a newly designed and optimized sensor carrier to perform both inspections in a single run. A sufficient number of UT sensors are placed to cover the circumference of the pipe. These sensors work in a pulse-echo mode with a high repetition frequency. Straight incidence of the ultrasonic pulses is used to measure the wall thickness and 45 degree incidence is used for the detection of cracks [44]. Although this technique was developed for gas and oil pipelines, it may also be a promising tool for water mains.
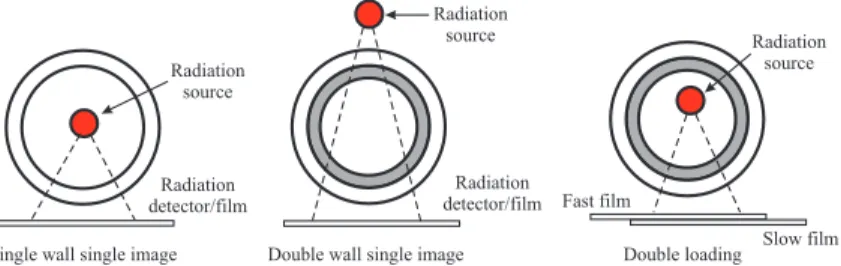
Figure 9: Radiographic method.
2.5. Radiographic Methods
Radiographic testing uses a source of radiation, either gamma or x-rays, which passes through the material and onto a photographic film. There are three basic setups for radiographic testing in the water sector as illustrated in Fig 9. The density changes on the film indicate possible imperfections. Nowadays, digital cameras have been used to replace film, but they are limited by the size of the complementary metal-oxide-semiconductor (CMOS) photodiode array in the image sensor.
X-rays created by cathode-ray tubes are used for plastic materials. Details of the material structure can be seen on the radiograph. However, it has technical limitations in that pipes of 38.1 cm diameter and greater must be emptied. The inspection of valves is with conventional film-based radiography. Darker areas correspond to thinner or less dense material. Typical defects that can be detected include:
• Pits in ferrous materials. Corrosion products are less dense and appear darker on the radiograph.
• Voids in cementitious materials. • Inclusions or manufacturing voids.
Gamma rays emitted from isotopes are used for ferrous and cementitious materials. Gamma radiography has been used to check welds in oil and gas pipelines.
A recent commercial development is the backscatter computed tomography (BCT), which does not require film on the other side of the inspected object [45]. This technol-ogy is currently being applied to the inspection of culvert, corrosion under insulation, fiberglass reinforced plastic (FRP) infrastructure, and structures in aerospace applica-tions.
2.6. Thermography Methods
Thermographic testing is a non-contact method of detecting thermal anomalies. Infrared radiation has a longer wavelength than visible light (> 700 nm). Any object above 0◦K radiates infrared energy and the amount of radiated energy is a function of the object’s temperature and emissivity, which is a measure of the surface efficiency in transferring infrared energy. Areas with different thermal masses will have different rates of heat absorption and radiation.
Figure 10: The pulse thermography testing.
The infrared radiation is converted into a visible image and tested objects can be distinguished on the basis of their heat emission.
In thermographic testing, an external heat source is typically used to heat the in-spected object. Subsequently, the object’s cooling characteristics are monitored by an infrared camera and these characteristics are then interpreted to discern object proper-ties [15]. Varied active thermographic testing methods, which use a heat source to ob-tain the desired thermal contrast, have been developed for different applications. These methods include pulse thermography, stepped heating thermography, lock-in thermog-raphy, and vibro-thermography. All the testing systems are commercially available.
3. Indirect Methods for Pipe Inspection
3.1. Linear polarization resistance (LPR) of soil
An electrochemical reaction with a weak electrical current is produced when a metal is immersed in an electrolyte solution, which leads to the corrosion of metal. The rate of corrosion is directly proportional to this current and inversely proportional to the electrical resistance (polarization resistance) of the metal/electrolyte pair. The direct measurement of corrosion current in the soil solution (electrolyte) is very difficult. Instead, it can be inferred by imposing a weak electrical potential (10 to 20 mV) between two electrodes. This potential produces small currents that are linearly proportional to actual corrosion current. The ratio between the imposed electrical potential and the resulting current provides the property known as the polarization resistance which, at low potential values, is nearly linear to the corrosion current. It should be noted that LPR is an inferential indicator of pipe corrosion as defined previously. Portable LPR instruments are commercially available from several companies. It allows the assessment of corrosion rate in real time.
3.2. Soil characterization
Soil characterization is used to explore the soil parameters relevant to the deterio-ration of buried pipes. Samples from the locations near the pipe are collected for lab characterization or in-situ testing. The following is a list of the main soil parameters of interest [4]:
• Soil resistivity: Low resistivity is likely to have high corrosion rates.
• pH value: Low pH value (< 4) is generally associated with corrosion of ferrous assets and deterioration of cementitious assets . However, high alkalinity soils (pH> 8) can also lead to high corrosion of metallic pipes as well as prestressing wire and steel cylinder in PCCP.
• Redox potential: The redox potential of soil is a measure of soil aeration and provides an indication of the suitability of conditions for sulfate reducing bacteria. High availability of oxygen promotes microbial induced corrosion (MIC) in the presence of sulfates and sulfides.
• Sulfates: Sulfates react with cementitious materials, forming gypsum and ettrin-gite. Sulfate attachment only occurs where the sulfate salts are in solution.
• Chloride content: Chloride ions permeate into cementitious and attached steel reinforcement. Presence of chloride ions in moist soil act as electrolyte and reduce soil resistivity, which encourages corrosion in metallic pipes, where the metal is in contact with the soil. In the case of PCCP (steel encased in concrete), if there are cracks in the outer mortar layer, ingress of chlorides in the presence of oxygen will promote corrosion in the prestressing steel wire as well as in the steel cylinder.
• Moisture content: Soil moisture acts as the electrolyte in electrochemical corrosion of ferrous pipes. It also defines the degree of soil saturation.
• Shrink/swell capacity: High shrink/swell capacities are known to have an in-creased failure rate due to the stresses imparted by the soil during the shrink/swell cycle.
• Buffering capacity: A soil’s buffering capacity is the degree to which it is able to resist changes in pH in particular acidification.
• LPR: High LPR indicates low corrosion rates. The corrosion rate can be roughly estimated from LPR measurements .
• Contaminants: Soil contaminants can have negative effects on polymeric materi-als. High levels of acidic contents can also cause environmental stress cracking of polymers, dramatically reducing lifetime.
• Soil compaction: The susceptibility of the trench filling and the surrounding sed-iments for compaction.
It should be noted that soil corrosivity is not a directly measurable parameter nor is there an explicit relationship between the soil corrosivity and soil properties. A number of empirical approaches have been proposed in literature to consider some or all of the above listed parameters in the determination of soil corrosivity and potential pipe deterioration [46, 47, 48, 49, 50, 51].
3.3. Pipe to soil potential survey
Pipe-to-soil potential reflects the interaction between ferrous pipes and the surround-ing soil. The measurement can be done with a voltmeter and a reference electrode [4]. There are two types of pipe potential survey. The first is the direct current voltage gradient (DCVG) survey that can be used to determine the location of gaps in a pipe’s protective coating. A direct current is introduced to the pipe and the difference between two reference electrodes is measured in the pipe-to-soil voltage. The two electrodes are gradually moved along the whole length of the pipe. If a gap exists in the coating, there will be a significant increase in voltage gradient compared with the gradient found when the coating is intact. The second type of potential survey consists of using a single ref-erence electrode (Cu/CuSO4) without an imposed current to determine the pipe-to-soil potential along the pipe. The pipe-to-soil potential can be used to estimate corrosion rate with calibration data. Calibration is carried out by directly assessing the external conditions of mains in different soils. In order to acquire enough soil information to calculate corrosion rate, the soil needs to be sampled at every 50 or 100 meters. It should be noted that potential survey reflects a propensity for corrosion rather than actual corrosion.
4. Other Technologies
4.1. Smart Pipe
The so-called “smart pipe” concept has been floating around in the last 15 years or so. It is a loosely defined concept, whereby the pipe is equipped with a range of sensors that provides a complete monitoring system of the pipe condition and performance. A smart pipe project for deep-sea pipelines was initiated in Europe in 2006 and is slated for completion in 2012. The objective is to develop a complete monitoring system for pipelines, integrating sensor technology, data acquisition, data interpretation, and decision support for on-line, real-time management of pipeline assets [52]. The entire length of each pipeline is to be monitored by sensors throughout the life of the pipe. The expected benefits include, but are not limited to, improved basis for decision making, improved residual life prediction, and decreased need for on site inspection.
4.2. Computer-Aided Approach: Augmented Reality
Augmented reality (AR) is a technology that blends in real-time, real-world video footage and computer-generated graphics. The AR system described in [53] consists of a stereo robotic head device, virtual reality graphics engine, scan converters, head mounted display, and a stereo monitor. The AR system itself does not introduce any
new method for pipe inspection, but provides a human-computer interface, which facil-itates advanced data manipulation and enhanced visualization of faults and deficiencies in the pipe.
4.3. Intelligent Pigs and Robotic Survey Systems
Pigs and robots serve as platforms for the introduction of one or more sensory payload into the pipe for assessing its condition [54]. The fundamental requirements of such systems include [55]: ability to traverse the entire pipe in a reasonable time without getting stuck; ability to inspect the pipe with acceptable accuracy and resolution, and ability to transmit the inspection data to the outside for reporting or save the data locally for later retrieval. Most of the robotic systems for water and sewer mains are tethered for power and communications. A list of available platforms is given in Table 2. Although not all platforms are intended for water mains, it is still a good source of reference for the development of the robotic platforms used in water mains.
An inspection system, which can be operated on-line without service interruption, is preferred. A robotic system for internal inspection of water pipelines was presented in [65]. From their research, the authors learned [65]:
• No cost-effective system will be able to negotiate through all possible scenarios that may exist inside a water pipeline network;
• A tethered solution is preferred for recoverability despite the greater autonomy that a non-tethered vehicle could provide.
The launch and retrieval of the inspection system/robot for the in-service pipe inspection is flexible and can be implemented by using chamber, open channel, hot tap, or sleeves with launcher/extractor pistons as adopted by the PipeDiver system [66].
5. Summary and Concluding Comments
As water mains age, they are increasingly exposed to continuous stress from oper-ational and environmental conditions. In consequence these mains deteriorate struc-turally and hydraulically, adversely impacting water quality, leakage, and reliability. Effective management of these assets requires condition assessment, which includes the collection of information about their condition, analysis of this information, and ulti-mately transformation of this information into knowledge, leading to effective decision about renewal.
This paper presented a state of the art review of direct and indirect sensing tech-niques/technologies for inspection and detection of pipe anomalies. The description of the performance of each technology is provided in Table 3. These techniques/technologies acquire direct distress indicators (observed and measured on the pipe itself) and/or in-ferential indicators (soil and environmental properties) for condition assessment of water pipes. The current relatively high cost of various technologies justifies their use mainly on large water transmission mains, where consequences of failure are relatively high. It is foreseen that as novel technologies develop and competition intensifies, prices will de-cline and non-destructive inspection will become justified even for pipes with relatively
Table 2: Robot systems for pipe inspection.
System Description Sensors Date
PIRAT [56] Pipe Inspection Real Time Assessment Technique (PIRAT) is a non au-tonomous tethered robot for the quantitative and automatic assessment of sewer conditions. A human operator can operate the robot from a surveil-lance unit via a cable, with a length of 250 m (maximum). An expert system running on a workstation was responsible for data interpretation and damage classification.
Video camera and laser scan-ner
2000
KARO [57] Kanalroboter (KARO) is an experimental semi-autonomous platform for sewer inspection. It is tethered via a cable to a surveillance unit. With on-board inclinometers, KARO is able to correct for tilt in its pose and wheel slippage. Standard video camera, ultrasound transducer, mi-crowave sensor, and 3D optical sensor 1998 2000
KURT [58] Kanal-Untersuchungs-Roboter-testplatform (KURT) is a six-wheeled au-tonomous un-tethered robot. A map of pipe net is needed for the navigation.
Ultrasound transducer, inclinometers, CCD camera
1997
KANTARO [59] KANTARO is a fully autonomous, untethered robot for pipes of diameter 20 to 30 cm. It was designed to move in straight pipes and pass different kinds of pipe bends without any special controller or sensor.
Fish eye cam-era and 2D laser scanner
2006
MAKRO [60] Multi-segmented autonomous sewer robot (MAKRO) is a fully autonomous, un-tethered, self-steering articulated robot platform for sewer inspection. It has six segments connected via flexible joints. This enables MAKRO to crawl along narrow pipes. The on-board batteries can support a two-hour operation of the robot. Infrared sen-sors, ultrasonic sensors, cam-era, laser crosshair pro-jector 2002
RoboScan [61] RoboScan is a modular platform for unpiggable gas distribution pipelines. Each module has its own micro-controller, which is connected through a net-work. A fiber optic cable is used to connect RoboScan and the base station. A magnetic flux leakage module was used for pipeline inspection.
Magnetic flux leakage
2004
Explorer-II [62] Explorer-II (X-II) is a modular robot platform for inspection of live gas mains. Digital camera 2008 Ultrasonic
inspection robot [63]
Ultrasonic inspection robots were developed by Inspector Systems for use in refinery pipes, buried pipes, and pipes with long vertical inclines. The robots are made of three modules connected with flexible folding bellows. One of the three modules is the ultrasonic element, which consists of an ultrasonic sensor unit for measuring pipe wall thickness, a camera, and a positioning unit. The robot can move both horizontally and vertically along pipes about several hundred meters long. A fiber optic cable is used to connect the control unit for transmission of control commands as well as inspection data. A special fluid is used as the couplant for the inspection.
Ultrasonic sen-sor and camera
Information
re-trieved in 2011
Robots for video and laser inspection [63]
These robots from Inspector Systems can be applied to nuclear power indus-try, refineries, chemical plants, pretrochemical plants, offshore indusindus-try, gas pipelines, beverage industry, and other types of pipes. The maximum dis-tance that the robot can travel is about 500 meter. A color camera with a ring of light emitting diode lights is mounted on the head with pan and tilt functions for video inspection. An adjustable point laser is used for internal measurement and classification of defects and corrosion. The robot has three drive elements and an inspection head as standard. The drive elements are connected via flexible folding bellows and each of them contains two direct current motors. A fiber optic cable is used to transmit inspection data and control commands.
Color camera and point laser
Information
re-trieved in 2011
PipeDiver At the 2009 International No-Dig Show (Toronto, Ontario, Canada), the PPIC demonstrated a prototype of its modularized free-swim platform, PipeDiver , for the inspection of in-service PCCP with diameters ranging from 0.6 to 1.5 m. Driven by water flow, the platform has three modules, which are used for vehicle tracking, pipe inspection, and power supplying, respectively. The remote field eddy current technique is integrated in the inspection module. Two challenges for PCCP inspection were considered in the design of the first generation of PipeDiver, platform launch and retrieval, passing pipe bend and butterfly valve. A version of PipeDiver was field tested at Louisville on 61 cm (24 inch) CI pipe. Field testing is being planned, but no detailed report is available.
Remote field eddy current
2009
Super-Pig [64] Super-pig is a platform with an ultrasonic module to measure the pipe wall thickness loss, longitudinal and circumferential cracks, damage to linings, and leaks. The targeted mains are in the range of 200 to 300 mm. The super-pig
Ultrasonic transducer array
moderate consequences of failure. Descriptions of sensor technologies with potential application in the water supply industry are provided in a companion paper.
Acknowledgment
This work was supported by National Research Council (NRC) Canada and US EPA (Environmental Protection Agency) through Battelle. The authors are grateful to the valuable discussions with Dr. Balvant Rajani, Dr. Osama Hunaidi and Mr. Alex Wang , and Dr. Daniel Cusson from NRC.
References
[1] B. Rajani, Y. Kleiner, Non-destructive inspection techniques to determine struc-tural distress indicators in water mains, in: Evaluation and Control of Water Loss in Urban Water Networks, Valencia, Spain, 2004, pp. 1–20.
[2] B. Rajani, Y. Kleiner, R. Sadiq, Translation of pipe inspection results into con-dition ratings using the fuzzy synthetic evaluation technique, Journal of Water Supply Research and Technology 55 (1) (2006) 11–24.
[3] O. Duran, K. Althoefer, L. D. Seneviratne, State of the art in sensor technologies for sewer inspection, IEEE Sensors Journal 2 (2) (2002) 73–81.
[4] D. Marlow, S. Heart, S. Burn, A. Urquhart, S. Gould, M. Anderson, S. Cook, M. Ambrose, B. Madin, A. Fitzgerald, Condition assessment strategies and pro-tocols for water and wastewater utility assets, Tech. rep., Water Environment Research Foundation (2007).
[5] J. Thomson, White paper on condition assessment of ferrous water transmission and distribution systems, Tech. rep., The U.S. Environmental Protection Agency (EPA), Washington, D.C. USA, white Paper on Condition Assessment of Ferrous Water Transmission and Distribution Systems (2008).
[6] J. C. Thomson, R. S. Morrison, T. Sangster, Inspection guidelines for wastewa-ter force mains, Tech. rep., Wawastewa-ter Environment Research Foundation, inspection Guidelines for Wastewater Force Mains (2010). doi:04-CTS-6URa.
[7] Z. Liu, Y. Kleiner, State of the art review of technologies for pipe structual health monitoring, IEEE Sensors Journal (2012) 1–6In press.
[8] O. Hunaidi, Condition assessment of water pipes, in: Proceedings of EPA Work-shop on Innovation and Research for Water Infrastructure in the 21st Century, Arlington, Virginia, USA, 2006, pp. 1–6.
[9] Hydraomax, Sset inspection: Side scanning evaluation technology, http://www.hydromaxusa.com/SSET.htm (2006).
Table 3: Summary of the performance of condition assessment technologies.
Condition assessment technologies Description of performance Visual
inspection
CCTV Depends on skills of personnel.
Laser scan The laser profiling is accurate, but still needs data processing to compensate for errors introduced during scanning. Report on performance study is not available.
Electromagnetic methods
Magnetic flux leakage The MFL test needs to be calibrated to interpret the acquired signal. It is mainly used for detecting corrosion pits and small defects. The detection of pipe wall remaining th ickness is quite accurate.
Remote field eddy cur-rent
Proprietors do not publish information about false positives/false negatives; however, RFEC seems to be the prevailing technology in the drinking water industry for inspection of ferromagnetic pipes and ferromagnetic components in composite pipes (e.g., PCCP).
Broadband electro-magnetic
The mean value of wall thickness is measured for a square grid. A surface scratch or an isolated pit smaller than the square grid will not be detected. Pulsed eddy current The instrument is capable of high accuracy and good repeatability. Ground penetrating
radar
The performance of GPR is highly dependent on soil conditions. No evi-dence of consistent ability to detect voids with GPR. Substantial operator interpretation of results is necessary.
Ultra-wideband pulsed radar system
Not yet determined.
Acoustic method
Sonar profiling Can generate precise pipe cross- section via dwell scan.
Impact echo Accuracy is typically 2% at high resolution when properly calibrated on a known thickness location. The typical thickness for the impact echo testing ranges from 66 mm to 1.8 m.
SmartBall As reported by Pure Technologies, the device can detect leaks of less than 0.026L/hr(0.1gal/hr) under ideal conditions (high pressure and low levels of ambient noise). Location accuracy depends on how well the configuration of a pipeline is known. Typically, the location accuracy of the device is within 1 m.
Sahara system Buried unknown leaks as small as 0.25 gal per hour have been successfully located. The accuracy of locating a leak is generally less than 1 m.
Leak detection The performance of the LeakfinderRTTM
system has been successfully tested for the following scenarios [37]:
• Narr ow-band leak noise in PVC pipes
• Small leaks in PVC pipes under a very l ow pressure of 20 psi • Locating small leaks in metal pipes
• Effective for situations with high background noise • Improved peak definition for resolving multiple leaks
• The smallest PVC pipe leaks detectable with LeakfinderRTTM’s low frequency vibration sensors (1.7L/min) and hydrophones (0.85L/min).
• Theoretical leak location error is less than 10 cm. Actual error de-pends on accuracy of sensor spacing and propagation velocity; The distance between acoustic sensors is determined by the pipe materials and size.
• The monitoring duration depends on the quality of the signal. More signal with much noises need a longer monitoring time.
Ultrasound methods
Guided wave ultra-sound
Sensitivity can be as good as 1% loss of cross-section in ideal conditions (but is typically set at 5%).
Discrete ultrasound Can achieve a reasonable degree of accuracy for the remaining wall thickness measurement.
Phased array technol-ogy
Phased array technique can optimize discontinuity detection while minimizing test time.
Combined UT inspec-tion
Not available for water main condition assessment.
Radiographic methods Can provide accurate measurements, but experience is required to interpret the inspection results.
[10] RapidView, Panoramo 3d optical scanner, http://www.rapidview.com/panoramo.htm (2007).
[11] Acuity, Principles of measurement used by laser sensor, http://www.acuitylaser.com/resources/principles-measurement.shtml (2008). [12] RedZone, 2D vs 3D lasers in large pipes, http://www.redzone.com, retrieved June
2011.
[13] Creafrom, http://www.creaform3d.com, retrieved in December 2011 (2008). [14] J. W. Wilson, M. Kaba, G. Y. Tian, New techniques for the quantification of defects
through pulsed magnetic flux leakage, in: Proceedings of 17th World Conference on Nondestructive Testing, Shanghai, China, 2008.
[15] B. Crouse, NDT resource center, http://www.ndt-ed.org, retrieved May 2011 (2009).
[16] B. Mergelas, X. Kong, Electromagnetic Inspection of Prestressed Concrete Pressure Pipe, Awwa Research Foundation and American Water Works Association, 2001. [17] Russell, See snake brochure, see Snake Brochure (2009).
[18] G. Hazelden, G. Ragula, M. Roubal, The use of broadband electromagnetic tech-nology for integrity inspection of a 760 mm (30 inch) cast iron and steel line, in: Proceedings of the 22nd World Gas Conference, Tokyo, Japan, 2003, 22nd World Gas Conference.
[19] C. S. Feeney, S. Thayer, M. Bonomo, K. Martel, State of technology review re-port on condition assessment of wastewater collection systems, Tech. rep., U.S. Environmental Protection Agency, Cincinnati, Ohio, USA (2009).
[20] C. Waters, Rtd-incotest- for the detection of corrosion under insulation, http://www.pndt.com.au (2005).
[21] Applus RTD, Pulsed eddy current system - incotest, http://www.mbinspection.co.uk/index/incotest (2008).
[22] S. B. Costello, D. N. Chapman, C. D. F. Rogers, N. Metje, Underground asset location and condition assessment technologies, Tunnelling and Underground Space Technology 22 (2007) 524–542.
[23] O. Hunaidi, P. Giamou, Ground-penetrating radar for detection of leaks in buried plastic water distribution pipes, in: Proceedings of 7th International Conference on Ground-Penetrating Radar, Lawrence, Kansas, USA, 1998, 7th International Conference on Ground-Penetrating Radar.
[24] P. G. Slaats, G. A. Mesman, L. P. Rosenthal, H. Brink, Tools to monitor corrosion of cement-containing water mains, Water Science and Technology 49 (2) (2004) 33–39.
[25] WATERPIPE, Integrated high resolution imaging ground penetrating radar and decision support system for water pipeline rehabilitation, http://www.waterpipe-eu.org (2009).
[26] E. N. Allouche, Computer aided tomography: Inspecting buried structures from inside out, in: 7th Annual Tulane Engineering Forum, New Orleans, USA, 2007, 2007.
[27] A. Jaganathan, E. Allouche, N. Simicevic, Pipeline scanning: Novel technology for detection of voids and internal defects in non-conductive buried pipes (2006). [28] CUES, Sonar profiler system for submerged and semi-submerged pipes,
http://www.cuesinc.com/Sonar-Profiler.html (2008).
[29] RedZone, Multi-frequency sonar: Fine tuning your pipe inspection system, http://www.redzone.com/education/multi-frequency-sonar (2008).
[30] D. A. Sack, L. D. Olson, Impact echo testing of in-situ precast concrete cylinder pipe, in: Proceedings of the 1998 Pipeline Division Conference: Pipelines in the Constructed Environment, American Society of Civil Engineers, San Diego, CA, USA, 1998, pp. 250–259.
[31] M. J. Sansalone, W. B. Streett, The impact-echo method, http://www.ndt.net/article/0298/streett/streett.htm (1998).
[32] PureTechnologies, Smartball for water leak detection, http://www.puretechnologiesltd.com(2009).
[33] R. Fletcher, Smartball - a new approach in pipeline leak detection, in: International Pipeline Conference, Calgary, Alberta, Canada, 2008.
[34] S. T. Ariaratnam, M. Chandrasekaran, Development of a free-swimming acoustic tool for liquid pipeline leak detection including evaluation for natural gas pipeline applications, Technical Report DTPH56-07-BAA-000002, Arizona State University and Pure Technologies Limited, prepared for US DPT PHMSA (August 2010). [35] B. Mergelas, G. Henrich, Leak locating method for pre-commissioned transmission
pipelines: North american case studies, in: Proceedings of Leakage Conference, Halifax, Canada, 2005, leakage 2005.
[36] PPIC, Transmission main leak location (sahara), http://www.ppic.com/l (2006). [37] O. Hunaidi, A. Wang, M. Bracken, T. Gambino, C. Fricke, Acoustic methods for
locating leaks in municipal water pipe networks, in: Proceedings of International Conference on Water Demand Management, Dead Sea, Jordan, 2004.
[38] O. Hunaidi, Non-destructive testing of pipes, non-Destructive Testing of Pipes (2006).
[39] J. L. Rose, J. Mu, Y. Cho, Recent advances on guided waves in pipe inspection, in: Proceedings of World Conference on Nondestructive Testing, Shanghai, China, 2008.
[40] W. Luo, J. L. Rose, Guided wave thickness measurement with EMATs, Insight 45 (11) (2003) 1–5.
[41] J. Bosch, A. Hugger, J. Franz, S. Falter, Phase array technology for automated pipeline inspection, Business Briefing: Exploration and Production - The Oil & Gas Review (2004) 1–4.
[42] P. O. Moore (Ed.), Nondestructive Testing Handbook: Ultrasonic Testing, Vol. 7, American Society for Nondestructive Testing Inc., Columbus, OH, USA, 2007, nondestructive Testing Handbook: Ultrasonic Testing.
[43] R/D Tech Corp., Phased array technical guidelines: Useful formulas, graphs, and examples.
[44] M. Beller, A. Barbian, Combined in-line inspection of pipelines for metal loss and cracks, in: Proceedings of European Conference on Nondestructive Testing, Berlin, Germany, 2006.
[45] Inversa Systems, Backscatter computed tomography, http://www.inversasystems.com, retrieved in December 2011.
[46] ANSI/AWWA C105/A21.5-99, American National Standard for Polyethylene Encasement for Ductile-IronPipe Systems, American Water Works Association (1999).
[47] Metalogic, http://www.metalogic.be/ (2003).
[48] B. Spickelmire, Corrosion consideration for ductile iron pipe, Materials Perfor-mance 41 (2002) 16–23.
[49] R. Sadiq, B. Rajani, Y. Kleiner, Fuzzy-based method to evaluate soil corrosivity for prediction of watermain deterioration, Journal of Infrastructure Systems 10 (4) (2004) 149–156.
[50] H. Najjaran, R. Sadiq, B. Rajani, Fuzzy expert system to assess corrosivity of cast/ductile iron pipes frombackfill properties, Computer Aided Civil and Infras-tructure Engineering 21 (1) (2006) 67–77.
[51] Z. Liu, R. Sadiq, B. Rajani, H. Najjaran, Exploring the relationship between soil properties and deterioration of metallic pipes using predictive data mining meth-ods, Journal of Computing in Civil Engineering 24 (3) (2010) 289–301.
[52] SINTEF, Smart pipe project, http://www.sintef.no/Projectweb/SmartPipe/The-SmartPipe-development-project/ (2008).
[53] S. W. Lawson, J. R. Pretlove, Augmented reality for underground pipe inspection and maintenance, in: M. R. Stein (Ed.), SPIE Proceedings of Telemanipulator and Telepresence Technologies V, Vol. 3524, 1998, pp. 98–104.
[54] H. Schempf, In-pipe-assessment robot platforms, Tech. rep., The Robotics Insti-tute, Carnegie Mellon University, Pittsburgh, PA, USA (2004).
[55] A. Jamoussi, Robotic nde: A new solution for in-line pipe inspection, in: 3rdMiddle East Nondestructive Testing Conference and Exhibition, Bahrain, Manama, 2005. [56] R. Kirham, P. D. Kearney, K. J. Rogers, J. Mashford, Pirat- a system for quantita-tive sewer pipe assessment, The International Journal of Robotics Research 19 (11) (2000) 1033–1053, pIRAT- A System for Quantitative Sewer Pipe Assessment. [57] H. B. Kuntze, H. Haffner, Experiences with the development of a robot for smart
multisensoric pipe inspection, in: Proceedings of the IEEE International Confer-ence on Robotics and Automation, Leuven, Belgium, 1998.
[58] F. Kirchner, J. Hertzberg, A prototype study of an autonomous robot platform for sewerage system maintenance, Autonomous Robots 4 (1997) 319–331, a Prototype Study of An Autonomous Robot Platform for Sewerage System Maintenance. [59] A. A. E. Nassiraei, Y. Kawamura, A. Ahrary, Y. Mikuriya, K. Ishii, A new
ap-proach to the sewer pipe inspection: Fully autonomous mobile robot ”kantaro”, in: Proceedings of the 32nd IEEE Annual Conference on Industrial Electronics, 2006. [60] E. Rome, J. Hertzberg, F. Kirchner, U. Licht, T. Christaller, Towards autonomous
sewer robots: the MAKRO project, Urban Water 1 (1999) 57–70.
[61] G. C. Vradis, W. Leary, Development of an inspection platform and a suite of sensors for assessing corrosion and mechanical damage on unpiggable transmission mains, Tech. rep., Northeast Gas Association (2004).
[62] H. Schempf, Explorer-ii: Wireless self-powered visual and NDE robotic inspec-tion system for live gas distribuinspec-tion mains, Tech. rep., Carnegie Mellon University (2006).
[63] http://www.inspector-systems.com/.
[64] M. Clay, Super-pig for cast iron pipe inspection, personal communication (2009). [65] J. Moraleda, A. Ollero, M. Orte, A robotic system for internal inspection of water
pipelines, IEEE Robotics and Automation Magazine 6 (3) (1999) 30–41.
[66] W. Jappy, PipeDiver: Condition assessment without shutdown, http://www.civil.uwaterloo.ca/catt/Pdfs/ (April 2012).


![Figure 5: The principle of LeakFinderRT for leak detection [37].](https://thumb-eu.123doks.com/thumbv2/123doknet/14115435.466887/13.918.267.648.115.316/figure-principle-leakfinderrt-leak-detection.webp)

![Figure 8: Sound beams generated by phased array of composite sensor elements [41].](https://thumb-eu.123doks.com/thumbv2/123doknet/14115435.466887/16.918.268.652.116.297/figure-sound-beams-generated-phased-composite-sensor-elements.webp)